© Sociologický ústav AV ČR, v.v.i., Praha 2018
The Mid-Week Effect and Why Thursdays Are Blue:
The Weekly Rhythm of Satisfaction in Hungary*
TAMáS KEllER**
Research Center for Educational and Network Studies, Hungarian Academy of Sciences, Budapest
Abstract: Research on the weekly fluctuation in people’s satisfaction has pro- duced mixed results about the nadir of levels of satisfaction in different coun- tries. This paper uses a Hungarian household survey with approximately 3400 individual observations. The fluctuation in satisfaction over the course of the week is assessed according to the day on which the personal interview was conducted during a six-week period of fieldwork. The analysis investi- gates the extent to which this is the result of a random process. Unlike previ- ous analysis, the nadir in satisfaction (in Hungary) is found to occur mid- week. This is explained as being related to workload. The results are robust after controlling for the interviewers’ unobserved characteristics or the hour of completion of the interview. Modification in workdays owing to national holidays did not alter the results. The results reveal which social groups are especially vulnerable to fluctuations in satisfaction. This could have practi- cal consequences for a more efficient work-life balance. The paper suggests questions for future research, which in particular should seek to understand differences between nations in terms of the nadir of satisfaction and to find a solution to the self-selection problem that may result in an underestimation of the true size of the weekly nadir.
Keywords: weekly rhythm in satisfaction, day-of-the-week effect, mid-week effect, satisfaction with life
Sociologický časopis/Czech Sociological Review, 2018, Vol. 54, No. 3: 371–399 https://doi.org/10.13060/00380288.2018.54.3.411
Introduction
It is presumably not just the Irish rock band the Boomtown Rats, but people all around the world wonder why they ‘don’t like Mondays’. One possible reason is that people greatly enjoy the weekend, when they can spend their free time as they wish, without bothering about work duties. However, empirical evidence
* This paper was supported by a János Bolyai Research Scholarship from the Hungarian Academy of Sciences.
** Direct all correspondence to: Tamás Keller, Research Center for Educational and Net- work Studies (RECENS), Hungarian Academy of Sciences, and TÁRKI Social Research Institute, Budapest, Educational Authority, Budapest, e-mail: keller.tamas@tk.mta.hu.
Sociologický časopis/Czech Sociological Review, 2018, Vol. 54, No. 3
does not point unambiguously to the peak of happiness being at weekends. Ger- man respondents, for example, report a lower level of satisfaction with life at weekends [Akay and Martinsson 2009; Maennig et al. 2014], whereas US citizens do indeed tend to be happier at weekends [Helliwell and Wang 2014].
It has already been established that respondents experience different levels of happiness, depending on the different kinds of activities they perform [Kah- neman et al. 2004]. Prior research using info and telecommunication devices has revealed that average happiness may differ across the days of the week [Killings- worth and Gilbert 2010]. However, as previous studies have shown [Akay and Martinsson 2009; Helliwell and Wang 2014], cycles in people’s well-being can be analysed not only with the help of telecommunication devices, but also using survey data and taking account of the date of the interview.
Whereas happiness is a subjective emotional experience, satisfaction is more a state of contentment, which requires cognitive evaluation (the distinction between instant emotions and later evaluations was introduced by Kahneman
& Riis [2005]). Since satisfaction is a result of evaluation, it might be connected less to personal mood, and therefore peaks and troughs in satisfaction should be smaller than those in happiness; however, no specific research has examined this question. A review of the relevant published articles in this field (Table 1) nev- ertheless reveals that the two notions, satisfaction and happiness, are somewhat mixed in the body of literature on the weekly fluctuation of well-being.
This paper analyses the weekly rhythm in satisfaction using Hungarian sur- vey data. As we have data on satisfaction rather than happiness, we concentrate on the cognitive part of subjective well-being [Bartram 2012]. Furthermore, this measure represents a general approach, which might not reflect people’s present situation or their feeling during their most recent activity [Kahneman and Krue- ger 2006].
In line with previous research, we found that there are weekly cycles—but with the nadir in the middle of the week. This finding is new in the literature, since prior scholarship found the peak in satisfaction at the weekend [Csiksze- ntmihalyi and Hunter 2003; Helliwell and Wang 2014; Taylor 2006], while other authors observed a nadir on Sundays [Akay and Martinsson 2009; Maennig et al.
2014]. Our results seem to be robust, even after taking into account special holi- days in the observed time period and controlling for interviewers’ unobserved characteristics.
We also found the weekly nadir in satisfaction to be higher among those who worked more during the week. This indicates that working weeks might shape people’s satisfaction. This interpretation is intuitive and confirms the find- ings of some prior research on happiness [Helliwell and Wang 2014]. However, it is necessary to point out that there is no consensus in the literature about whether workload decreases satisfaction. Prior research has reported that increased work- ing hours do have a positive effect on life satisfaction [Holly and Mohnen 2012].
Furthermore, there is a negative connection between unemployment and satisfac- tion [Winkelmann 2014].
Tamás Keller: The Mid-Week Effect and Why Thursdays Are Blue
Exploring rhythms in satisfaction has implications for future research, since many human biological processes exhibit a weekly cycle [Lee et al. 2003]. The suicide rate also fluctuates according to a weekly pattern and is higher on ‘work days’ [Beauchamp et al. 2014; Maldonado and Kraus 1991]. Exploring weekly cy- cles in human behaviour is of paramount importance because as a ‘timekeeper’
the week is a social construct [Zerubavel 1989], insofar as it is not attached to any lunar or solar periods. Therefore, the observed weekly cycles in human behav- iour appear because the cyclical rhythm of the week structures people’s lives and inevitably influences their life events.
Research into the cycles of well-being should, however, explore the mecha- nisms behind the fluctuation. Speculating about the mechanism helps us to iden- tify vulnerable social groups—those that are more exposed to the weekly fluc- tuations. The findings of our research imply that the active labour force is more exposed to the weekly rhythm. Therefore, the active labour force might need spe- cial attention to organise work and family life effectively [Haar et al. 2014]. This is something policy-makers might consider in the future.
The day-of-the-week effect in previous research
Previous research on the weekly rhythm in happiness is ambiguous. Previous analysis can basically be grouped into three clusters: (1) Early investigations found no significant effect [Stone et al. 1985]; (2) English-speaking countries report high- er satisfaction at the weekend [Csikszentmihalyi and Hunter 2003; Helliwell and Wang 2014; Taylor 2006]; (3) analysis of German samples found lower satisfaction at the end of the week [Akay and Martinsson 2009; Maennig et al. 2014]. The main results of previous research are summarised in Table 1. If the findings are compa- rable with our research, the size of the effect also appears in the table.
Research on this field also aimed at exploring why well-being shows a weekly fluctuation. Therefore, it is interesting to see which mechanisms might drive the day-of-the-week effect. As the seminal paper by Aarøe and Petersen [2013] indicates, blood glucose concentration (hormone levels, too) can partly ex- plain patterns in the way people regard particular issues, and thus possibly hap- piness as well. However, previous research in that field has tended to neglect the biological explanation for the rhythm of well-being.
The analysis conducted by Helliwell and Wang [2014] allows us to assume that respondents may be happier at weekends because of work-related stress dur- ing the week. They found the weekend peak to be twice as high among full-time workers, and it is estimated to be smaller among those who have a good relation- ship with their work superior and who report an open working environment.
However, this analysis also shows that while people have more positive and few- er negative emotions at the weekend, there is no weekly pattern in general life evaluation—probably because actual circumstances influence only actual emo- tions, whereas general life satisfaction is not as sensitive to these actual circum-
Sociologický časopis/Czech Sociological Review, 2018, Vol. 54, No. 3 374 Table 1. The day-of-interview effect—main previous analysis
Authors Country Data Question used Control Effect Size
Stone et al. [1985] US Small local data Depression scale No effect
Csikszentmihalyi
& Hunter [2003] US Authors’ own data
Whether people felt happy in themselves 7-grade scale, from 1 to 7
No Saturday is the hap-
piest day
Taylor [2006] United
Kingdom British House- hold Panel Survey (BHPS)
‘All things considered, how satisfied or dis- satisfied are you with your present job?’
7-grade scale, from 1 to 7
Individual unob- served heterogeneity is controlled for
People interviewed on Friday report higher levels of job satisfaction
Akay & Martins-
son [2009] Germany German Socio- Economic Panel (SOEP)
‘How satisfied are you with your life, all things considered?’
11-grade scale, from 0 to 10
Individual unob- served heterogeneity is controlled for
Sundays are found to be the bluest day
Helliwell & Wang
[2014] US Gallup/Health-
ways US daily poll
‘Did you experience happiness during a lot of the day yesterday?’
11-grade scale, from 0 to 10
Gender, age, educa- tion, income, marital status, children in family, religion, state
More positive emo- tions at the weekend.
But day-of-week effect is non-existent for (general) life evaluation
OLS:
between 0.015 and 0.033
Maennig et al.
[2014] Germany SOEP ‘How satisfied are
you with your life, all things considered?’
11-grade scale, from
Individual unob- served heterogeneity is controlled for
Sunday neurosis but its size varies by educational back- ground and gender
OLS:
between -0.08 and -0.15
Tamás Keller: The Mid-Week Effect and Why Thursdays Are Blue
stances. Taylor’s [2006] analysis focuses directly on job satisfaction: he found a higher level of job satisfaction among people who were interviewed on a Friday, and the impact was greater among full-time workers.
The inverse of happy weekends would be Sunday neurosis, which means that people tend to feel anxiety when they are freed from scheduled and organ- ised work settings. This is supported by the findings of Akay and Martinsson [2009], according to whom German people report a lower level of satisfaction on Fridays, Saturdays, and Sundays, compared to the level they would report on Mondays, all other things being held constant. Weekend unhappiness is stronger among full-time employees, married couples, and people who live in the former western part of Germany.
This is the first paper since the prior analysis on data from English-speaking countries and Germany to analyse the weekly rhythm of satisfaction in a post- communist country like Hungary. However, the paper will also speculate on why satisfaction fluctuates, and it assumes workload as one mechanism that may fuel the weekly cycles in satisfaction.
Method Data
The current analysis is based on a Hungarian cross-sectional household survey called the TÁRKI Household Monitor, which is conducted by the TÁRKI Social Research Institute roughly every other year. The survey wave used in this analy- sis was fielded from 27 September2014 to 1 November2014. This is a nationally representative sample of Hungarian households, and in terms of gender, age, and education of the household head, and type of settlement (urban, rural, etc.) it is weighted to the Hungarian census data for 2011. The survey is a paper and pencil survey, where the interviewer visits the respondents at home in order to conduct the interview. The survey contains 2011 households and has information on all the members of each respondent’s family (4420 individuals). Every individual in each household who was at least 16 years old completed an individual question- naire (3542 people).
Measures
The day of the week
As argued before, the weekly rhythm in satisfaction could also be investigated in a survey situation, if we assume that the choice of the exact day of the interview is the result of a random process. In this analysis, we used the day on which the personal interview was conducted as the main independent variable. This infor-
Sociologický časopis/Czech Sociological Review, 2018, Vol. 54, No. 3
mation is usually available as supplementary information about the fieldwork.
However, data collectors—at least in Hungary—usually do not provide this kind of information to third parties, such as researchers, in the data file, since the ano- nymity of the respondents may be compromised. Therefore, the dataset we work with provides us with a unique opportunity to analyse these questions.
General satisfaction and future prospects
In this paper, the analysis focuses on two survey questions, which were worded as follows: All things considered, how satisfied are you with your life? and How satisfied are you with your future prospects? In this paper, for the sake of simplicity, we refer to the first question as ‘general satisfaction’ and to the second question as ‘future prospects’. Both questions were answered on a scale from 0 to 10, where 0 meant
‘not at all satisfied’ and 10 indicated ‘extremely satisfied’. The two different ques- tions provided a kind of robustness check; in other words, they allow us to make certain that the weekly rhythm is not bound to one particular question, but is rather a general tendency in satisfaction.
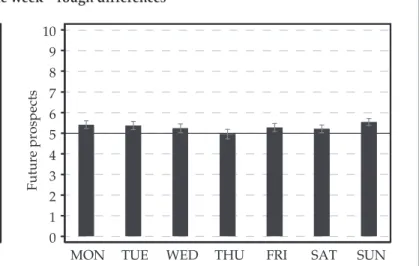
The average value of satisfaction is shown in Figure 1. In general, it can be said that the responses are slightly above the mathematical mid-point (5) of the 11-point scale. In terms of general satisfaction, the values are above 5.9 at the be- ginning and end of the week, and are at their lowest on Thursdays, with a value of 5.5. This decline of 0.4–0.5 points on the scale is remarkable, given the standard deviation for general satisfaction (which is 2). In other words, the drop in satisfac- tion is approximately a quarter of the standard deviation.
The same pattern can be seen in the case of future prospects. The lowest value is measured on a Thursday. The decline in satisfaction is about 0.6 scale- points, which is approximately 25% of the standard deviation (2.23) of the index.
The fluctuation in satisfaction during the fieldwork is presented in Figure 2.
This graph has at least three important ‘messages’ for further analysis. The first is that satisfaction shows a monthly pattern, and especially in the middle of the month average satisfaction is somewhat lower. This pattern should be taken into consideration in future analysis. Second, there are days (the first two and the last three days in the fieldwork period) when the total number of interviews fell below 10. As Figure 2 shows, average satisfaction on these days is lower. This underlines the importance of conducting robustness checks without those days when the number of interviewees is small. The third issue is that national holi- days meant some modifications to work days in October 2014: 18 October(Satur- day) was worked as a Friday, while 23 and 24 October were both national holidays (and treated as Sundays); moreover 1 November (Saturday) was also a holiday and was treated as a Sunday. The graph below does not indicate that these modi- fications had any extra impact on satisfaction, but later in the robustness check one should conduct a more profound analysis of this issue and its possible effect on the mid-week nadir of satisfaction.
Tamás Keller: The Mid-Week Effect and Why Thursdays Are Blue
37
Figure 1. The average value of satisfaction indices during the week—rough differences
0 1 2 3 4 5 6 7 8 9 10
General satisfaction
MON
Means with 95%-level confidence interval
0 1 2 3 4 5 6 7 8 9 10
Future prospects
Means with 95%-level confidence interval
TUE WED THU FRI SAT SUN MON TUE WED THU FRI SAT SUN
Sociologický časopis/Czech Sociological Review, 2018, Vol. 54, N 378 Figure 2. The average value of satisfaction indices during the fieldwork—rough differences
0 1 2 3 4 5 6 7 8 9 10
General satisfaction
10.01. THU THU THU 18.10. 23.10.: THU 24.10. THU 01.11.
Means with 95%-level confidence interval
Future prospects 27.09. 10.01. THU THU THU 18.10. 23.10.: THU 24.10. THU 01.11.
Means with 95%-level confidence interval 0
1 2 3 4 5 6 7 8 9 10
Tamás Keller: The Mid-Week Effect and Why Thursdays Are Blue
37
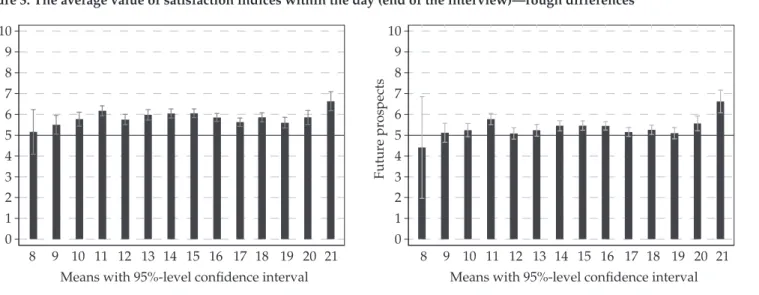
Figure 3. The average value of satisfaction indices within the day (end of the interview)—rough differences
0 1 2 3 4 5 6 7 8 9 10
General satisfaction
8
Means with 95%-level confidence interval
0 1 2 3 4 5 6 7 8 9 10
Future prospects
Means with 95%-level confidence interval 21
20 19 18 17 16 15 14 13 12 11 10
9 8 9 10 11 12 13 14 15 16 17 18 19 20 21
Sociologický časopis/Czech Sociological Review, 2018, Vol. 54, No. 3
Satisfaction also varies within the day, as Figure 3 shows. We can establish that in the early morning respondents report a lower level of satisfaction, but it steadily increases over the morning. There is a dip in satisfaction around noon, which is followed by a small but constant increase over the afternoon. A local minimum is found around afternoon tea-time, when most people finish work.
After supper-time, in the early evening, satisfaction begins to rise and reaches its maximum at 9 pm.
Control variables
Previous analysis showed that satisfaction is influenced by income, age, marital and health status, and religiosity (the relevant literature is reviewed by Maen- nig et al. [2014]). These characteristics could override the mid-week effect, and therefore it seems reasonable to rule out the impact of these characteristics if we seek to pinpoint the day-of-the-week effect in satisfaction. Controlling for these characteristics is necessary, since it could be that respondents with a particular set of socioeconomic background attributes are more/less likely to be interviewed on one particular day of the week. Activity status, income, and education, for ex- ample, could define a group of people whom it is harder to interview during the week. On the other hand, religious people or families with small children might be much less likely to be at home during the weekend. Obviously, the various combinations of background variables could be correlated with time preferences to determine the exact day of the interview. The following control variables were considered.
Gender:
The dummy variable of gender is coded 1 if the respondent was female.
Age:
Age appears as four categories: 16–35, 36–50, 51–65 and 66 and over.
Education:
Education refers to the highest completed educational level of the respondent.
It has four categories: elementary education, vocational education, high-school final exam, and tertiary education. Vocational education means that the respond- ent did not complete the academically oriented track of secondary education.
High-school final exam means that the person concerned completed the academi- cally oriented secondary-school track and took the high-school final exam, with which the respondent would have been eligible to study at university, but the respondent did not choose this track. Tertiary education applies to people with a post-secondary degree.
Tamás Keller: The Mid-Week Effect and Why Thursdays Are Blue
Activity status:
There are five different activity statuses distinguished in the analysis. Active peo- ple are employees or self-employed. We regard as unemployed those who are reg- istered as unemployed and are actively searching for a job. Being at home means that the respondent is either permanently disabled or is on maternity leave and without a formal job. Students are those who have not yet completed formal edu- cation. And retired means the person is a pensioner.
Household income:
We expressed total yearly net household income relative to its empirical median (found in the database) and used five categories: the household has less than 50% of median household income, has 50–80%, 80–120%, 120–200%, or more than 200%.
Marital status:
Married people and those living together with a partner are classified as couples, which is coded as a dummy variable.
Religiosity:
Those who attend religious services at least once a month are regarded as reli- gious, regardless of their denomination.
Body-mass index (BMI):
Body-mass index is person’s weight measured in kilograms and divided by the squared height measured in metres. It is divided here into three categories: nor- mal (BMI < 25), overweight (BMI > 25 and BMI < 29), and obese (BMI > 29).
Child in the household:
Households where at least one household member is under the age of 18 are in- dicated with 1, otherwise value of the variable is 0.
Day of the interview:
The day of the interview is indicated by the number of the calendar date and ap- pears as a continuous variable and also in a quadratic format using the square of the calendar day.
Fixed effects
Counties in Hungary:
It has already been established that weather can influence people’s mood [Han- nak et al. 2010; Sanders andBrizzolara 1982], and therefore it would be good to
Sociologický časopis/Czech Sociological Review, 2018, Vol. 54, No. 3
know the geographical location of the district where an interview is conducted.
This could be very interesting, as such information would capture all the local events and news on a particular day that could have influenced respondents’
satisfaction. It is plausible that the day-of-the-week effect could be biased by the effect of a cloudy day or even by some unfortunate mishap in a particular geo- graphical location. We assume that the county’s identifier code (Hungary has 19 counties) can pinpoint and capture both the impact of the weather and any special occurrences in a particular area. Therefore, these effects appear as fixed effects in the regression.
Interviewer fixed effects:
Interviewer fixed effects are dummy variables. It is assumed that interviewers’
characteristics (persistence, ability to persuade, etc.) could determine the day of the interview and thus violate the randomised allocation of the interview day.
The hour of completion of interview:
It is also known—and our data confirm this—that happiness varies through the day [Csikszentmihalyi and Hunter 2003]. If an interview falls through, it could simply be because the interviewer rang the doorbell at a bad time. In such cases, the interview is likely to be rescheduled for another day, and therefore it ceases to be random. Nor is it entirely random who is at home on a given date. A lower level of satisfaction may simply be a by-product of the fact that respondents’ sat- isfaction tends to be somewhat lower around tea-time (people usually get home around 5 pm), and so the interview can only be conducted at a time when people generally report lower levels of satisfaction. Thus, it would be reasonable to con- trol for the time at which the interview was completed as a fixed effect.
Household-level variation in satisfaction:
Satisfaction is not independent of the family (or the household) in which the re- spondent lives: people from the same family will tend to report a similar level of satisfaction, all things held constant. Respondents from the same family, there- fore, should not be regarded as independent observations. Standard errors are consequently clustered here according to household ID.
Omitted variable bias:
Regardless of how carefully we choose our control variables, we must acknowl- edge the fact that we cannot control for every individual-level factor that could bias the day-of-the-week effect. Since our data are cross-sectional, we have only one observation per respondent, and consequently, we are not able to control for individual unobserved heterogeneity. It is therefore likely that we overestimate the true size of the day-of-interview effect on satisfaction.
Tamás Keller: The Mid-Week Effect and Why Thursdays Are Blue
Self-selection:
However, even working with panel data would not necessarily mean unbiased estimates. It is fair to assume that there is a considerable degree of self-selection in the analysis: there are presumably people whom it is easier to interview on a given day of the week because on other days their mood is so bad that they would refuse to be interviewed. Moreover, it is also possible that interviewers are more effective on a particular day of the week: they manage to complete more inter- views, simply because they are in a better frame of mind. This means that the day of the interview is no longer random, but is predetermined by the mood of the respondents (which is the outcome of the analysis), and partly also by the mood of the interviewer, who might persuade respondents to participate in the survey.
If there is a general weekly nadir in satisfaction, it is reasonable to assume that those for whom the weekly cycle exerts the largest impact on satisfaction are not interviewed on the day with the lowest level of satisfaction; and moreover, the interviews on those days are completed by interviewers who are relatively more satisfied. This kind of self-selection would lead to underestimation of the lowest point of satisfaction. The inclusion of interviewer fixed effects might mitigate this concern. However, even after introducing interviewer fixed effects, the concern that the well-being of respondents may pre-determine the day of the interview is not treated.
Results Main results
The main estimation results are presented in graph form, with the focus on the main parameters of interest. The full regression results are provided in the ap- pendix. A straightforward interpretation of these graphs is possible. Since esti- mated parameters are plotted with confidence intervals (95% level), if this inter- val crosses the (vertical) 0-line, the parameter is not significant at the 95% level.
According to our results, even using an extended set of control variables, the drop in satisfaction on a Thursday is significant. This means that people inter- viewed on Thursdays are less satisfied with their lives and are more pessimistic about their future prospects. Satisfaction begins to decline even on Wednesday, but statistically significant differences cannot be measured until the fourth day of the week (assuming Monday to be the first day). The nadir is independent of the applied statistical model, since both OLS and the ordered logit indicate the
‘low-point’ as being Thursday.
Compared to Monday, the gap in satisfaction on Thursday is approximately 0.4 scale-points. Compared to similar previous results in the United States [Helli- well and Wang 2014] and Germany [Maennig et al. 2014], the day-of-the-week effect was found to be larger in Hungary. Comparing our results to the German
Sociologický časopis/Czech Sociological Review, 2018, Vol. 54, No. 3 384 Figure 4. Average satisfaction compared to Monday—estimated coefficients with 95%-level confidence intervals results of
multivariate analysis
Standard errors: are clustered at household level
Control variables: Gender; Age; Schooling; Activity status; Household income; BMI; Marital status; Religiosity; Child in household;
Day of the interview (linear and quadratic) Fixed effects: County code; Hour of interview
Tuesday Wednesday Thursday Friday Saturday Sunday
-0.75 -0.5 -0.25 0 0.25 0.5 Estimated coefficient
General satisfaction OLS
Tuesday Wednesday Thursday Friday Saturday Sunday
-0.75 -0.5 -0.25 0 0.25 0.5
Estimated coefficient Future prospects
Ordered logit results
General satisfaction Future prospects
0.06 -0.17
-0.43 -0.08
-0.03 0.05 -0.06 -0.20 -0.49
-0.11 -0.08
0.10
-0.01 -0.10 -0.34
-0.09 -0.16
0.01 -0.10 -0.09 -0.38
-0.10 -0.19
0.04
Tamás Keller: The Mid-Week Effect and Why Thursdays Are Blue
results, this may be influenced by the fact that that research controlled for unob- served individual-level heterogeneity. However, our estimated parameter is larg- er than the US analysis, which also uses cross-sectional data (but in that study the results refer to happiness rather than general satisfaction). Therefore, we conclude that the weekly fluctuation in satisfaction is remarkably large in Hungary.
As a possible mechanism, we assume workload to be behind the decline in satisfaction. It is assumed that work-related duties and things to be accomplished during the week exhaust people by the middle of the week (Thursday is exactly the middle of the week, the fourth day). This exhaustion could also weaken satis- faction. On Fridays, satisfaction might begin to increase because the weekend is approaching, and people usually work less on that day than on other workdays.
Note that this method of reasoning does not suggest that people are less satisfied because they were interviewed on a Thursday: we can only observe that those who were asked on a Thursday were less satisfied at the time.
Robustness checks
In this section, we are interested in the robustness of the results. We will focus only on the nadir on Thursday (a value of 1 was assigned if the interview was conducted on a Thursday and a 0 otherwise). Owing to spatial constraints, the results are presented only in graph form (in Figure 5) in this paper, but the full regression results can be requested from the author.
The first estimated parameter in Figure 5 corresponds to the OLS estimate.
The second estimated parameter (from the top) excludes those days on which the total number of interviews fell below 10 (the first two and the last three days of the fieldwork), because, as we saw in Figure 2, average satisfaction is less reliable on those days. The next three models contain the interviewer fixed effect. The third parameter is estimated only with interviewer fixed effect; the fourth param- eter is estimated with additional consideration of a ‘working-day reallocation’
in October for the purposes of this analysis (i.e. ;1 while the fifth and last model omits from the analysis the whole week containing the national holiday of 23 October (the reason being that because of the long weekend, the mid-week effect could be different that week).
The nadir in satisfaction on a Thursday may be regarded as robust. In most of the models, the confidence interval around the estimated parameter does not
1 This relates to the situation where if a national holiday fell, for instance, on a Tuesday, in order to have a 4-day vacation people would work on a Saturday to be able to get the Monday off. In this fieldwork, 23 October (=Thursday) was a public holiday, and therefore Friday (24 October) was also a holiday, but people had to work on the preceding Saturday, 18 October, which is therefore coded here as a Friday; and the dates of 23 and 24 October and 1 Novemberare coded as Sunday.
Sociologický časopis/Czech Sociological Review, 2018, Vol. 54, No. 3 386 Figure 5. Robustness checks concerning the Thursday-effect in satisfaction—all other controls held constant
-0.75 -0.5 -0.25 0 0.25 0.5
General satisfaction
-0.75 -0.5 -0.25 0 0.25 0.5
Future prospects
The sequence of the coefficients is the following OLS
Only days with 10 or more accomplished interviews Interviewer fixed effect
Interviewer fixed effect & working day recoding
Interviewer fixed effect & without the whole week of the national holiday 23 October
Tamás Keller: The Mid-Week Effect and Why Thursdays Are Blue
387
Figure 6. Sensitivity analysis, the Thursday-effect among active and retired respondents—all other controls held constant
Standard errors: are clustered at household level
Control variables: Gender; Age; Schooling; Activity status; Household income; BMI; Marital status; Religiosity; Child in house- hold; Day of the interview (linear and quadratic)
Fixed effects: County code; Hour of interview
General satisfaction
-1 -0.75 -0.5 -0.25 0 0.25 0.5
Estimated coefficient Active; N = 1555
General satisfaction
-1 -0.75 -0.5 -0.25 0 0.25 0.5
Estimated coefficient Active; N = 1542
Retired; N = 1381 Retired; N = 1361
-0.63
-0.31
-0.61
-0.43
Sociologický časopis/Czech Sociological Review, 2018, Vol. 54, No. 3 388 Figure 7. I nteraction-effect between the dummy variable Thursday and weekly working hours, average marginal effects
Standard errors: are clustered at household level
Control variables: Gender; Age; Schooling; Household income; BMI; Marital status; Religiosity; Child in household; Day of the interview (linear and quadratic)
Fixed effects: County code; Hour of interview -6
-4 -2 0 2 4
General satisfaction
5 40 83
Weekly working hours N = 1407
-6 -4 -2 0 2 4
Future prospects
5 40 83
Weekly working hours N = 1407
Tamás Keller: The Mid-Week Effect and Why Thursdays Are Blue
cross the 0-line. The only exception is the model for future prospects, where the sample is restricted to days when 10 or more interviews were conducted. In this case, the Thursday-effect is significant at the 8% significance level. All in all, we can conclude that the estimated mid-week effect is fairly robust and does not change much if we restrict or somehow modify the conditions of the models.
Sensitivity analysis
We caution against making a causal interpretation of our results. As we argued earlier, the drop in satisfaction on Thursdays might be influenced by a third fac- tor, which could be workload. However, we have cross-sectional data and this kind of dataset does not provide enough opportunity to test this hypothesis. We can, though, restrict the sample to groups where the workload is assumed to be higher, and therefore where the decline in happiness should be greater.
The results show that the drop in satisfaction is stronger among active people (employees or self-employed), but is not at all significant among retired respondents (Figure 6). This finding might indicate that workload shapes the fluctuation of satisfaction over the week. However, this conclusion calls for more rigorous future research.
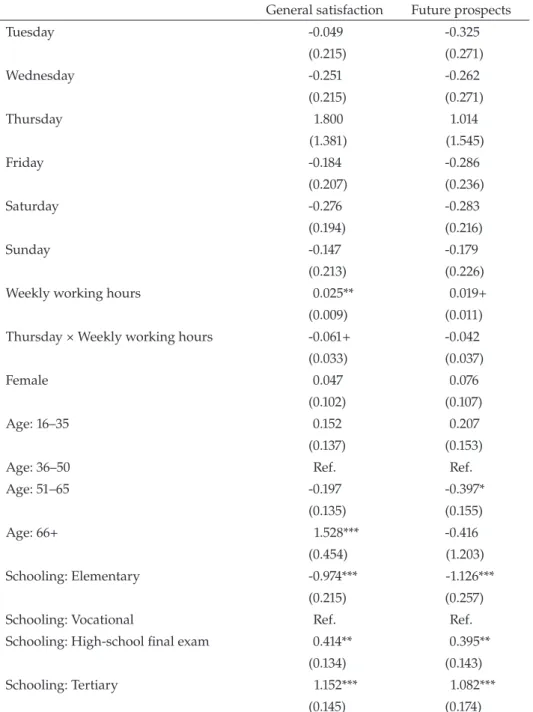
A further sensitivity analysis investigates the interaction between the week- ly nadir (Thursday) in satisfaction and the workload measured by weekly work- ing hours. Figure 7 visualises the average marginal effects. In general, there is a negative interaction (Appendix Table A2), which means that the weekly nadir of satisfaction increases with the increase in weekly working hours. As the graphs on the left-hand side show, the peak in satisfaction is -0.64 if someone works 40 hours, but it is around -3.1 if someone works double that. The difference between these two values is marginally significant (F = 3.37, p = 0.067). The results show a similar trend for future prospects.
Discussion
Previous research identified a weekly rhythm in satisfaction and happiness [Akay and Martinsson 2009; Helliwell and Wang 2014; Taylor 2006]. Our analysis demonstrated that this cycle exists in Hungary as well. However, while previous scholarship found differences particularly between the weekend and weekdays, our analysis showed a nadir occurring mid-week. Therefore, according to our interpretation, the novelty of our research findings lies not in the fact that in Hun- gary the lowest level of satisfaction is measured on a Thursday, but rather in the fact that in different countries the weekly rhythm of satisfaction also differs. This should be taken into consideration in future analysis.
The weekly fluctuation in satisfaction is by no means negligible, either in absolute terms (0.4 scale-points on an 11-point scale from 0 to 10) or compared
Sociologický časopis/Czech Sociological Review, 2018, Vol. 54, No. 3
to the impact of other variables. Moreover, after restricting the sample and cor- recting for the working-day reallocation during the observed time period, it was found to be fairly robust. The results are robust also in the sense that similar patterns were found for general satisfaction and satisfaction with future pros- pects. Our main results remain stable after addressing the issue that the day of the interview was not necessarily random, and so unobserved characteristics of interviewers could have influenced when the interview was conducted.
In this paper, we identified groups of people who are affected more by the weekly rhythm of time, since our aim was to find out more about vulnerable groups. Employees—and especially those who have a heavier workload—expe- rience a stronger peak in satisfaction. The finding presented here is not causal, though. Indications that human well-being and health are linked were also found by Crivelli et al. [2016]. Those who work more experience a larger nadir in satis- faction, which might also indicate exposure to illness. Furthermore, the findings have implications for work-life balance, meaning that a larger nadir in satisfaction among those who work more can cause more conflict in family life. Nevertheless, at this point further research is necessary, since working hours do not necessarily decrease satisfaction, as the results using German panel data show [Holly and Mohnen 2012].
Limitations
Clear limitations to this analysis are that 1) the data are cross-sectional, 2) the weekly rhythm of satisfaction was measured by the date of the interview, and 3) the observed time period is short.
Two possible biases might also limit the scope to generalise the findings.
Since unobserved individual heterogeneity is only partly controlled for (because of omitted variable bias), we could overestimate the mid-week effect. On the other hand, self-selection (that the day of the interview is predetermined by a respondent’s well-being) leads to underestimation. We could assume that the two different biases cancel each other out. However, we do not know the magnitude of either of the biases. Since it is possible that our results are biased in this or that direction, we warn readers to be cautious about the causal interpretation of the results. People are not necessarily less satisfied because they were interviewed on a Thursday, but rather those who were interviewed on a Thursday were just less satisfied at the time. This also means that the relationship between the day of the interview and satisfaction could be shaped by a third factor.
Conclusion
The week is is a peculiar timekeeper, because it is not tied to any lunar or so- lar event, the case the days, months, and years are [Zerubavel 1989]. If it were
Tamás Keller: The Mid-Week Effect and Why Thursdays Are Blue
tied to the lunar cycle, the length of such a quasi-week would be irregular. The unvarying weekly cycles of even length are a social construct [Zerubavel 1989:
10]. Biological processes that influence human physical well-being, such as blood pressure, do, however, exhibit weekly cycles [Lee et al. 2003]. This suggests that human life has adapted to the weekly cycle. The fluctuation in human mood also follows a weekly pattern, and the seven-day cycle accounts for around 40% of the variance in aggregated daily mood data [Larsen and Kasimatis 1990].2
Previous psychological research analysing weekly cycles in mood, however, has been conducted only on undergraduate students [Larsen and Kasimatis 1990;
McFarlane et al. 1988], whose life is especially governed by weekly rhythms. This finding thus cannot be simply generalised to apply to the total population. Even though the results obtained from population-wide social surveys corroborate the weekly cycles in people’s satisfaction [Akay and Martinsson 2009; Taylor 2006], those results do not point in the same direction: the data support both happy weekends [Taylor 2006] and also Sunday neurosis [Akay and Martinsson 2009].
Thus, the structured weekly rhythm can work in both directions.
Future research should shed more light on whether the national variations in the nadir of satisfaction could have any connection to the working environ- ment. Specifically, it could look at whether the relative dissatisfaction at week- ends in Germany [Akay and Martinsson 2009; Maennig et al. 2014] could be the product of a rigorous work schedule, which causes dissatisfaction if outside binding factors are removed. Also whether the working environment and free time spent with friends mitigate fluctuations in happiness only in the United States [Helliwell and Wang 2014], or whether this is a general tendency. In that sense, the mid-week effect found in Hungary is also worthy of further considera- tion. First, whether this drop is a general feature or is uniquely Hungarian, and second, to what extent it is a by-product of the population’s work tempo.
Another possible direction for future analysis could be to find ways of over- coming the self-selection problem in estimating the weekly rhythm of satisfac- tion (which is considered the weak point of previous analysis). Special attention should be dedicated to finding natural experiments, so that the day of the in- terview is completely random and is not predetermined by people’s well-being.
Using panel data and employing interviewer fixed effects only imperfectly ad- dress this problem. However, in the case of Hungary, this analysis leaves room for future analysis to answer the question of a weekly rhythm in satisfaction more profoundly and to control for individual unobserved heterogeneity and replicate the analysis on other samples and at other time points.
The results presented here will hopefully inspire future research about the connection between workload and satisfaction. Prior research focused on this question from the perspective of specific occupation [Groenewegen and Hutten
2 Prior psychological literature used the word ‘mood’ instead of ‘well-being’; therefore, we also use this word here.
Sociologický časopis/Czech Sociological Review, 2018, Vol. 54, No. 3
1991; Mamiseishvili 2011; Smith and Bourke 1992]. Our results, however, invite fu- ture research to connect the literature on satisfaction and workload to the weekly rhythm of satisfaction. Most importantly, however, since personal satisfaction is influenced by the day of the interview (see the references in Table 1), upcom- ing research should definitely control for this heterogeneity. This suggestion has already been proposed [Akay and Martinsson 2009], but did not bring about a change in the practice employed in analysing satisfaction data, since weekly dif- ferences in satisfaction do not yet figure among the standard control variables in well-being literature.
Tamás Keller earned his PhD at Corvinus University in Budapest. He has spent his postdoctoral years as an Alexander von Humboldt post-doctoral researcher at the Free University of Berlin and at the Berlin Social Science Centre (WZB). He works as a re- searcher in the Research Centre for Educational and Network Studies, Hungarian Acad- emy of Sciences.
References
Aarøe, L. and M. B. Petersen. 2013. ‘Hunger Games: Fluctuations in Blood Glucose Levels Influence Support for Social Welfare. Psychological Science 24: 2550–2556,
https://doi.org/10.1177/0956797613495244.
Akay, A. and P. Martinsson. 2009. ‘Sundays Are Blue: Aren’t They? The Day-of-the-Week Effect on Subjective Well-being and Socio-economic status.’ IZA Discussion Paper 4563.
Bartram, D. 2012. ‘Elements of a Sociological Contribution to Happiness Studies.’
Sociology Compass 6 (8): 644–656, https://doi.org/10.1111/j.1751-9020.2012.00483.x.
Beauchamp, G. A., M. L. Ho and S. Yin. 2014. ‘Variation in Suicide Occurrence by Day and during Major American Holidays. The Journal of Emergency Medicine 46 (6):
776–781, https://doi.org/10.1016/j.jemermed.2013.09.023.
Crivelli, L., S. Della Bella and M. Lucchini. 2016. ‘Happiness and Health.’ Pp. 372–399 in Handbook of Research Methods and Applications in Happiness and Quality of Life, edited by L. Bruni and P. L. Porta. Cheltenham, UK: Edward Elgar Publishing,
https://doi.org/10.4337/9781783471171.00023.
Csikszentmihalyi, M. and J. Hunter. 2003. ‘Happiness in Everyday Life: The Uses of Experience Sampling.’ Journal of Happiness Studies 4 (2): 185–199,
https://doi.org/10.1023/A:1024409732742.
Groenewegen, P. P. and J. B. F. Hutten. 1991. ‘Workload and Job Satisfaction among General Practitioners: A Review of the Literature.’ Social Science & Medicine 32 (10):
1111–1119, https://doi.org/10.1016/0277-9536(91)90087-S.
Haar, J. M., M. Russo, A. Suñe and A. Ollier-Malaterre. 2014. ‘Outcomes of Work–Life Balance on Job Satisfaction, Life Satisfaction and Mental Health: A Study across Seven Cultures.’ Journal of Vocational Behavior 85 (3): 361–373,
https://doi.org/10.1016/j.jvb.2014.08.010.
Hannak, A., E. Anderson, L. F. Barrett, S. Lehmann, A. Mislove and M. Riedewald.
2010. ‘Tweetin’ in the Rain: Exploring Societal-Scale Effects of Weather on Mood.’
Tamás Keller: The Mid-Week Effect and Why Thursdays Are Blue Proceedings of the Sixth International AAAI Conference on Weblogs and Social Media 479–482, https://doi.org/10.1.1.222.9736.
Helliwell, J. F. and S. Wang. 2011. ‘Weekends and Subjective Well-being.’ NBER Working Paper Series, Working Paper 17180. Retrieved 15 June 2018
(http://www.nber.org/papers/w17180).
Helliwell, J. F. and S. Wang. 2014. ‘Weekends and Subjective Well-being.’ Social Indicators Research 116 (2): 389–407, https://doi.org/10.1007/s11205-013-0306-y.
Holly, S. and A. Mohnen. 2012. ‘Impact of Working Hours on Work–Life Balance.’ SOEP Papers 465: 1–31.
Kahneman, D., and A. B. Krueger. 2006. ‘Developments in the Measurement of Subjective Well-being.’ Journal of Economic Perspectives 20 (1): 3–24.
Kahneman, D. and J. Riis. 2005. ‘Living, and Thinking about It: Two Perspectives on Life.’ Pp. 285–306 in The Science of Well-being, edited by F. A. Huppert, N. Baylis and B. Keverne. Oxford: Oxford University Press.
Kahneman, D., A. B. Krueger, D. A. Schkade, N. Schwarz and A. A. Stone. 2004.
‘A Survey Method for Characterizing Daily Life Experience: The Day Reconstruction Method.’ Science 306 (3 December): 1776–1781.
Killingsworth, M. and D. T. Gilbert. 2010. ‘A Wandering Mind Is an Unhappy Mind.’
Science, 330 (6006): 932, https://doi.org/10.1126/science.1192439.
Larsen, R. J. and M. Kasimatis. 1990. ‘Individual Differences in Entrainment of Mood to the Weekly Calendar.’ Journal of Personality and Social Psychology 58 (1): 164–171, https://doi.org/10.1037/0022-3514.58.1.164.
Lee, M. S., J. S. Lee, J. Y. Lee, G. Cornélissen, K. Otsuka and F. Halberg. 2003. ‘About 7-day (Circaseptan) and Circadian Changes in Cold Pressor Test (CPT).’ Biomedicine
& Pharmacotherapy 57: 39–44, https://doi.org/10.1016/j.biopha.2003.08.006.
Maennig, W., Steenbeck, M., & Wilhelm, M. (2014). Rhythms and cycles in happiness.
Applied Economics 46 (1): 70–78, https://doi.org/10.1080/00036846.2013.829206.
Maldonado, G. and J. F. Kraus. 1991. ‘Variation in Suicide Occurrence by Time of Day, Day of the Week, Month, and Lunar Phase.’ Suicide and Life-Threatening Behavior 2 (2): 174–187.
Mamiseishvili, K. 2011. ‘Teaching Workload and Satisfaction of Foreign-born and U.S.-born Faculty at Four-year Postsecondary Institutions in the United States.’
Journal of Diversity in Higher Education 4 (3): 163–174, https://doi.org/10.1037/a0022354.
McFarlane, J., C. L. Martin and T. M. B. Williams. 1988. ‘Mood Fluctuations: Women versus Men and Menstrual versus Other Cycles.’ Psychology of Women Quarterly 12 (2):
201–223, https://doi.org/10.1111/j.1471-6402.1988.tb00937.x.
Sanders, J. L. and M. S. Brizzolara. 1982. ‘Relationships between Weather and Mood.’
The Journal of General Psychology 107 (1): 155–156, https://doi.org/10.1080/00221309.1982.9709917.
Smith, M. and S. Bourke. 1992. ‘Teacher Stress: Examining a Model Based on Context, Workload, and Satisfaction.’ Teaching and Teacher Education 8 (1): 31–46,
https://doi.org/10.1016/0742-051X(92)90038-5.
Stone, A. A., S. M. Hedges, J. M. Neale and M. S. Satin. 1985. ‘Prospective and Cross- sectional Mood Reports Offer No Evidence of a “Blue Monday” Phenomenon.’ Journal of Personality and Social Psychology 49 (1): 129–134,
https://doi.org/10.1037//0022-3514.49.1.129.
Taylor, M. P. 2006. ‘Tell Me Why I Don’t Like Mondays: Investigating Day of the Week Effects on Job Satisfaction and Psychological Well-being.’ Journal of the Royal Statistical Society: Series A (Statistics in Society) 169 (1): 127–142,
https://doi.org/10.1111/j.1467-985X.2005.00376.x.
Sociologický časopis/Czech Sociological Review, 2018, Vol. 54, No. 3
Winkelmann, R. 2014. ‘Unemployment and Happiness.’ IZA World of Labour 94 (October):
1–10, https://doi.org/10.15185/izawol.94.
Zerubavel, E. 1989. The Seven Day Circle: The History and Meaning of the Week. Chicago, IL:
University of Chicago Press.
Tamás Keller: The Mid-Week Effect and Why Thursdays Are Blue
Appendix
Table A1. Regression results—first part
General satisfaction Future prospects
OLS Ordered OLS Ordered
Tuesday -0.054 -0.006 -0.135 -0.097
(0.151) (0.163) (0.179) (0.167)
Wednesday -0.112 -0.103 -0.132 -0.095
(0.162) (0.173) (0.200) (0.180)
Thursday -0.410* -0.342* -0.421* -0.380*
(0.172) (0.174) (0.183) (0.173)
Friday -0.101 -0.090 -0.153 -0.096
(0.152) (0.164) (0.169) (0.154)
Saturday -0.191 -0.158 -0.212 -0.186
(0.146) (0.159) (0.167) (0.159)
Sunday -0.052 0.007 -0.039 0.038
(0.150) (0.159) (0.163) (0.150)
Female 0.153* 0.145* 0.256*** 0.226**
(0.069) (0.073) (0.073) (0.070)
Age: 16–35 0.200+ 0.173 0.312* 0.282*
(0.118) (0.121) (0.129) (0.121)
Age: 36–50 Ref. Ref. Ref. Ref.
Age: 51–65 -0.015 -0.006 -0.249* -0.206+
(0.115) (0.115) (0.125) (0.112)
Age: 66+ 0.524*** 0.521** 0.111 0.161
(0.159) (0.164) (0.177) (0.160)
Schooling: Elementary -0.684*** -0.671*** -0.689*** -0.624***
(0.109) (0.112) (0.123) (0.107)
Schooling: Vocational Ref. Ref. Ref. Ref.
Schooling: High-school
final exam 0.318** 0.320** 0.334** 0.308**
(0.097) (0.100) (0.108) (0.100)
Schooling: Tertiary 1.106*** 1.284*** 1.070*** 1.104***
(0.111) (0.123) (0.136) (0.133)
Sociologický časopis/Czech Sociological Review, 2018, Vol. 54, No. 3
General satisfaction Future prospects
OLS Ordered OLS Ordered
Activity: Active 0.048 0.072 0.189 0.196
(0.128) (0.132) (0.143) (0.130)
Activity: Unemployed -1.375*** -1.346*** -1.274*** -1.101***
(0.220) (0.221) (0.231) (0.211)
Activity: Household work -0.635*** -0.634** -0.501* -0.426*
(0.190) (0.194) (0.219) (0.200)
Activity: Student 1.316*** 1.416*** 1.151*** 1.197***
(0.223) (0.238) (0.281) (0.258)
Activity: Retired Ref. Ref. Ref. Ref.
Median household income:
>50% -0.487** -0.450** -0.603*** -0.515***
(0.150) (0.153) (0.163) (0.149)
Median household income:
50%–80% -0.225+ -0.223+ -0.219 -0.200
(0.119) (0.123) (0.134) (0.124)
Median household income:
80%–120% Ref. Ref. Ref. Ref.
Median household income:
120%–200% 0.286** 0.330** 0.246+ 0.256*
(0.111) (0.119) (0.134) (0.125)
Median household income:
<200% 0.421* 0.499** 0.436* 0.421*
(0.166) (0.190) (0.197) (0.192)
Couple (has a partner) 0.249** 0.285*** -0.065 -0.063
(0.083) (0.086) (0.093) (0.085)
Religious 0.421*** 0.468*** 0.220 0.227+
(0.119) (0.130) (0.135) (0.124)
BMI<25: Normal -0.078 -0.053 0.045 0.024
(0.085) (0.090) (0.095) (0.086)
25<BMI<29: Overweight Ref. Ref. Ref. Ref.
BMI>29: Obese -0.162 -0.181+ -0.253* -0.247*
(0.104) (0.106) (0.114) (0.103)
Child (under 18)
in household 0.314** 0.305** 0.126 0.130
(0.110) (0.118) (0.127) (0.116)
Table A1. Regression results—second part
Tamás Keller: The Mid-Week Effect and Why Thursdays Are Blue
General satisfaction Future prospects
OLS Ordered OLS Ordered
Day of interview (linear) -0.074* -0.085** -0.034 -0.040
(0.029) (0.031) (0.035) (0.031)
Day of interview
(quadratic) 0.002** 0.003** 0.001 0.001
(0.001) (0.001) (0.001) (0.001)
Constant YES YES YES YES
Observations 3,386 3,386 3,346 3,346
R-squared 0.326 0.264
Hour of interview FE YES YES YES YES
County FE YES YES YES YES
SE is clustered by house-
holds YES YES YES YES
F 18.02*** 14.41***
Wald chi2 914.17*** 688.39***
Robust standard errors in parentheses
*** p<0.001, ** p<0.01, * p<0.05, + p<0.1 Table A1. Regression results—third part
Sociologický časopis/Czech Sociological Review, 2018, Vol. 54, No. 3
Table A2. The interaction between Thursday and the weekly working hours, OlS results—first part
General satisfaction Future prospects
Tuesday -0.049 -0.325
(0.215) (0.271)
Wednesday -0.251 -0.262
(0.215) (0.271)
Thursday 1.800 1.014
(1.381) (1.545)
Friday -0.184 -0.286
(0.207) (0.236)
Saturday -0.276 -0.283
(0.194) (0.216)
Sunday -0.147 -0.179
(0.213) (0.226)
Weekly working hours 0.025** 0.019+
(0.009) (0.011)
Thursday × Weekly working hours -0.061+ -0.042
(0.033) (0.037)
Female 0.047 0.076
(0.102) (0.107)
Age: 16–35 0.152 0.207
(0.137) (0.153)
Age: 36–50 Ref. Ref.
Age: 51–65 -0.197 -0.397*
(0.135) (0.155)
Age: 66+ 1.528*** -0.416
(0.454) (1.203)
Schooling: Elementary -0.974*** -1.126***
(0.215) (0.257)
Schooling: Vocational Ref. Ref.
Schooling: High-school final exam 0.414** 0.395**
(0.134) (0.143)
Schooling: Tertiary 1.152*** 1.082***
(0.145) (0.174)