Extended many-item similarity indices for sets of nucleotide and protein sequences
Dávid Bajusz
a,1,2, Ramón Alain Miranda-Quintana
b,⇑,1,3, Anita Rácz
c,4, Károly Héberger
c,⇑,5aMedicinal Chemistry Research Group, Research Centre for Natural Sciences, Magyar tudósok krt. 2, 1117 Budapest, Hungary
bDepartment of Chemistry and Quantum Theory Project, University of Florida, Gainesville, FL 32611, USA
cPlasma Chemistry Research Group, Research Centre for Natural Sciences, Magyar tudósok krt. 2, 1117 Budapest, Hungary
a r t i c l e i n f o
Article history:
Received 11 March 2021
Received in revised form 7 June 2021 Accepted 14 June 2021
Available online 16 June 2021 Keywords:
Multiple comparisons DNA sequences Protein sequences Diversity analysis Similarity indices Consistency ANOVA
Human protein kinases Human SH2 domains Cytochrome P450
a b s t r a c t
Quantification of similarities between protein sequences or DNA/RNA strands is a (sub-)task that is ubiquitously present in bioinformatics workflows, and is usually accomplished by pairwise comparisons of sequences, utilizing simple (e.g.percent identity) or more intricate concepts (e.g.substitution scoring matrices). Complex tasks (such as clustering) rely on a large number of pairwise comparisons under the hood, instead of a direct quantification of set similarities. Based on our recently introduced framework that enables multiple comparisons of binary molecular fingerprints (i.e., direct calculation of the similar- ity of fingerprint sets), here we introduce novel symmetric similarity indices for analogous calculations on sets of character sequences with more than two (t) possible items (e.g.DNA/RNA sequences with t= 4, or protein sequences witht= 20). The features of these new indices are studied in detail with anal- ysis of variance (ANOVA), and demonstrated with three case studies of protein/DNA sequences with vary- ing degrees of similarity (or evolutionary proximity). The Python code for the extended many-item similarity indices is publicly available at:https://github.com/ramirandaq/tn_Comparisons.
Ó2021 Published by Elsevier B.V. on behalf of Research Network of Computational and Structural Bio- technology. This is an open access article under the CC BY-NC-ND license (http://creativecommons.org/
licenses/by-nc-nd/4.0/).
1. Introduction
Much like molecular similarity is a key concept of cheminfor- matics [1,2], the comparison of amino acid and nucleotide sequences is a cornerstone of bioinformatics. Both are based on the similarity principle,i.e.structurally similar molecules are pre- sumed to exhibit similar properties and similar biological activi- ties, and analogously, similar nucleotide or amino acid sequences most often encode proteins with similar biological function.
Despite the common philosophical roots, the core methodologies of cheminformatics and bioinformatics are quite different, partly due to the different data representations of moleculesvs.macro- molecular sequences. Since small molecular structures were pri- marily conceived as drawings on paper, their computational
representations were developed from scratch and refined over the past decades, yielding a rich selection of file formats and binary molecular fingerprints [3]. Molecular fingerprints offer–among other advantages[4,5]–a direct way to quantify the similarity of molecules, with the application of binary similarity metrics (yield- ing pairwise similarity values usually in the [0;1] range, with a value of 1 corresponding to identical objects/fingerprints). While many such metrics exist[6], the past decades of practice have cemented the Tanimoto coefficient as the most popular similarity coefficient[7,8], despite its known shortcomings[9,10].
In contrast, the representation of macromolecular sequences was quite straightforward from the start, as sequences of one- letter monomer (amino acid or nucleotide) codes. Here, an addi- tional task is finding the optimal alignment of two (or more) sequences prior to evaluating their similarities. While the basics of (global) sequence alignments have been established already in the 19700s [11], decades of refinement have yielded local align- ment algorithms, particularly BLAST (Basic Local Alignment Search Tool) as today’s standard sequence alignment tool[12], and new generation alignment algorithms are still being developed [13].
For quantifying the similarity between two aligned sequences, per- cent identity values (for protein sequences, also percent similarity
https://doi.org/10.1016/j.csbj.2021.06.021
2001-0370/Ó2021 Published by Elsevier B.V. on behalf of Research Network of Computational and Structural Biotechnology.
This is an open access article under the CC BY-NC-ND license (http://creativecommons.org/licenses/by-nc-nd/4.0/).
⇑Corresponding authors.
E-mail addresses: quintana@chem.ufl.edu(R.A. Miranda-Quintana),heberger.
karoly@ttk.mta.hu(K. Héberger).
1These authors have contributed equally.
2https://orcid.org/0000-0003-4277-9481
3https://orcid.org/0000-0003-2121-4449
4https://orcid.org/0000-0001-8271-9841
5https://orcid.org/0000-0003-0965-939X
j o u r n a l h o m e p a g e : w w w . e l s e v i e r . c o m / l o c a t e / c s b j
values) are used, together with the expectation value (E) of finding an equivalent alignment by chance. Protein sequence alignments can also be assessed by substitution scoring matrices, which con- tain additive score contributions for each possible exchange of amino acid A to amino acid B. (With Point Accepted Mutation (PAM) matrices [14]and Blocks Substitution Matrices (BLOSUM) being the most popular such tools[15].)
In our recent works with binary (molecular and other) finger- prints, we have provided statistical findings that support the use of the Tanimoto coefficient[8], but we could also identify some coefficients, which are more advantageous in some circumstances, e.g.for metabolomic[16]or protein–ligand interaction fingerprints [17]. We have also introduced differential consistency analysis (DCA), a rigorous mathematical framework to reveal consistencies between any pair of similarity metrics[18]. Most importantly, in the direct predecessors of this work, we introduced the idea of comparing more than two molecules (i.e.groups/sets of molecules) at a time, defined a series of extended similarity indices based on this idea, and selected the best indices for further usage[19]. In a companion paper, we have proven the computational advantage of these new indices in assessing the similarity of large sets of molecules, and provided illustrative examples for their usage in:
i) the selection of diverse compound sets, ii) clustering applica- tions, and iii) assessing the compactness of clusters corresponding to ligands of different pharmaceutical targets[20]. Much of this is possible due to the unprecedented computational efficiency of our indices in quantifying the similarities of sets with an arbitrary number of objects.
In this work, we generalize this formalism even further, intro- ducing extended many-item–or (t,n)–similarity indices to compare any number of objectsn, containing any finite numbertof categor- ical variables. Realizing the prospective applications in bioinfor- matics, we showcase the usage of the new similarity indices on protein families and subfamilies relevant for current medicinal chemistry, using their DNA (t = 4), and amino acid (t = 20) sequences. We also introduce a simple amino acid categorization scheme to account for sidechains of similar character (t = 8). A thorough literature search reveals that related approaches are scarce: ‘‘integer coding” is sporadically used and definitely not for uncovering (macro)molecular similarities. Terms such as ‘‘non- binary similarity coefficients” usually refer to the use of (pairwise) similarity metrics for ordinal (integer) or continuous data[21,22].
Further uses appear in the distantly related fields of process control [23,24], feature selection [25]and multicriteria decision making [26]. Therefore, our work presents the first approach to directly compare arbitrarily large sets of DNA and amino acid sequences.
Hence, we suggest a terminology of (t,n)-comparisons,i.e.the com- parison ofnobjects (sequences) containingtpossible characters, as an extension of: i) (2,2)-comparisons, the ‘‘traditional approach”
for the pairwise comparison of binary (molecular) fingerprints, and ii) (2,n)-comparisons, our recent generalization to compare an arbitrary number nof such binary fingerprints [19,20]. More specifically for DNA and amino acids, these are (4, n)- and (20, n)-comparisons, as demonstrated in the case studies that are included in the present work
2. Theory
First, let us introduce some elements of notation. As explained before, we will use the term (t,n)-comparison for a comparison of nsequences, each containingmcharacters from a set oftitems.
An alternative term that we use here (also in the title) are ‘‘ex- tended many-item comparisons”, with ‘‘extended” meaning that we are comparing more than two objects (sequences)
simultaneously (in contrast to pairwise comparisons) and ‘‘many- item” meaning that there are more than two possible characters in each position of the sequences
As a reference, the pairwise comparison of binary sequences,i.e.
(2,2)-comparisons are used ubiquitously in cheminformatics to define the similarity of molecules by comparing their binary fin- gerprints (sequences of zeros and ones). In this case, each bit posi- tion can contribute to the occurrence of four events: (1,1), (1,0), (0,1) and (0,0), which are summed in the countersa,b,c andd, respectively. Binary similarity metrics are then defined with the use of these counters (e.g.the popular Tanimoto coefficient is given asa/(a + b + c)). Notice that the countersaanddexpress similarity of the two sequences, whilebandc express dissimilarity in the given positions. Our core idea for the generalization of similarity metrics for the comparison of more sequences (i.e. (2,n)- comparisons), is that even for arbitrarily large sets of compared objects, we can classify each bit position as a similarity or dissim- ilarity counter. For example, if we compare ten sequences and there are eight co-occurring 1 bits (and two 0 bits) in a given posi- tion, that will contribute to the similarity, while five co-occurring 1 bits (and five 0 bits) will contribute to the dissimilarity of the ten objects. In our recent work, we provide a systematic approach to the classification of positions into similarity and dissimilarity counters, using an indicator we have termed Dn(k)=|2k-n| and a coincidence threshold
c
[19]. In this work, we take this generaliza- tion one step further by allowing an arbitrary number oftdifferent characters, instead of two.In the more general (t,n)-comparisons we have sequences formed byX1;X2; ;Xtdistinct characters (it is arbitrary how we choose to represent these characters, they can be numbers, letters, etc.). In this work we will only discuss the ‘‘democratic matching”
case, meaning that matchingkcharacters of typeXpis equivalent to matching k characters of type Xq. This means that we can directly study similarity indices, which yield the following form for (2,n)-comparisons:
s¼X
iGi
gi1ðaþd;bþcÞ gi2ðaþd;bþcÞ
ð1Þ where the termsa + dandb + care the counts over the similar- ity and dissimilarity counters, respectively, as introduced in our recent work for (2,n)-comparisons [19,20]. (Briefly, a + d and b + care the numbers of sequence positions where the frequency of either ones or zeros is above/below a predefined confidence threshold
c
, respectively, see also below.) In particular, formula (1) holds for the SM (simple matching), RT (Rogers-Tanimoto), SS2 (Sokal-Sneath), CT1, CT2 (Consonni-Todeschini), and AC (Austin-Colwell) indices.The first step is counting, for each position of the sequences, the number of matches for each type of character. To fix ideas, let us consider the following case of five short DNA-sequences:
F1¼ðCGCTACAAÞ F2¼ðAACAGCACÞ F3¼ðCGCTCAACÞ F4¼ðAACCACAAÞ F5¼ðAGCTTCATÞ
ð2Þ
We can write up a general coincidence matrix as follows:
1 2 3 4 5 6 7 8
A 3 2 0 1 2 1 5 2
C 2 0 5 1 1 4 0 2
G 0 3 0 0 1 0 0 0
T 0 0 0 3 1 0 0 1
where the columns label the position (b), and the rows label the type of character (j). Each entry in this table corresponds tokjb, that is, the number of times that characterjappears in the positionb.
The next step is to assign a coincidence value to each bit posi- tion. As we follow the philosophy to maximize the final similarity, we assign to each position the column maximum. That is, from the previous table we can extract the reduced coincidence vector:
1 2 3 4 5 6 7 8
Coincidence 3 3 5 3 2 4 5 2
In other words, denoting the coincidence over bitbbykb: kb¼maxjkjb
ð3Þ Notice that, by definition (and if there are no gaps in the com- pared sequences):
n t
l m6kb6n ð4Þ
whered ex is the ceiling function.
Now, for each kb we calculate the indicatorDtnðkbÞ that will enable us to classify the various possible values ofkbas eithersim- ilarityordissimilaritycounters:
DtnðkbÞ¼tkbn ð5Þ
According to Eq.(4), possible values of this indicator will be in the following range:
tnmodt
ð ÞmodtDtnðkbÞnðt1Þ ð6Þ This means that the coincidence threshold to classify the vari- ous possible values ofkbas eithersimilarityordissimilaritycoun- ters,
c
, will have to be in the range:tnmodt
ð Þmodt
c
<nðt1Þ ð7Þ Thus, if we want to maximize the similarity in the end, we must choose the following coincidence threshold:c
¼ðtnmodtÞmodt ð8ÞWe note that ð2nmod2Þmod2¼nmod2, which was the expression we used in thet= 2 (binary molecular fingerprints) case [19]. In the present case,
c
¼ð45mod4Þmod4¼3.In general, akbvalue will indicate similarity if:
DtnðkbÞ>
c
ð9Þand dissimilarity if:
DtnðkbÞ
c
ð10ÞNow we define the counters. A counterCtnðkÞ will count the number of times a givenkappears in the set of allkb. In the exam- ple, we have been following so far, we have:
C45ð5Þ¼2;C45ð4Þ¼1;C45ð3Þ¼3;C45ð2Þ¼2 ð11Þ Notice that with this new definition we will haven nt coun- ters. Also, as expected, the sum of all the counters is equal to the length of the sequences (m).
We classify each counter as similarity or dissimilarity counters according to Eqs.(9) and (10), so:
C45 5ð Þis a similarity counter C45ð4Þ is a similarity counter C45ð3Þ is a similarity counter C45ð2Þis a dissimilarity counter
ð12Þ
Analogously to thet= 2 case, certain counters might indicate a stronger measure of similarity/dissimilarity,e.g.in our example, C45ð5Þ(the same character repeating in all 5 sequences at the same position) is stronger thanC45ð3Þ(the same character repeating in 3 out of 5 sequences at the same position). We can use suitable weighting functions to reflect this, using the natural generalization of the weight functions used in thet= 2 case[19], namely:
fs DtnðkÞ
¼ DtnðkÞ
nðt1Þ ð13Þ
fd DtnðkÞ
¼1DtnðkÞðtnmodtÞmodt
nðt1Þ ð14Þ
Now we have all the necessary ingredients to calculate the sim- ilarity indices. In the case of the weighted simple matching (or Sokal-Michener) index, for instance:
SM45w¼
P
sfs DnðkÞ
CnðkÞ
P
sfs DnðkÞ
CnðkÞþP
dfd DnðkÞ
CnðkÞ ð15Þ
SM45w¼ fs D45ð5Þ
C45ð5Þþfs D45ð4Þ
C45ð4Þþfs D45ð3Þ
C45ð3Þ
fs D45ð5Þ
C45ð5Þþfs D45ð4Þ
C45ð4Þþfs D45ð3Þ
C45ð3Þþfd D45ð2Þ
C45ð2Þ
ð16Þ
SM45w¼ 1:02þ0:7331þ0:4673 1:02þ0:7331þ0:4673þ1:02
¼4:133
6:133¼0:674 ð17Þ
Analogously as for the (2,n) similarity metrics, we can choose to omit the weighting schemes from the denominator and define the non-weighted analogs of the similarity indices, e.g. for the SM index:
SM45nw¼ P
sfs DnðkÞ
CnðkÞ P
sCnðkÞþP
dCnðkÞ ð18Þ
SM45nw¼fs D45ð5Þ
C45ð5Þþfs D45ð4Þ
C45ð4Þþfs D45ð3Þ
C45ð3Þ
C45ð5ÞþC45ð4ÞþC45ð3ÞþC45ð2Þ
ð19Þ SM45nw¼1:02þ0:7331þ0:4673
2þ1þ3þ2 ¼4:133 8
¼0:517 ð20Þ
The weighted and non-weighted formulas for each of the avail- able similarity metrics are collected inAppendix 1.
An additional part of the formalism that is especially important for DNA and protein sequences is the question of how we handle gaps in a set of aligned sequences. In our approach, positions with a majority of gap (-) characters are omitted from further analysis (they are regarded neither as similarity, nor as dissimilarity coun- ters), but a position with a smaller number of gaps can still be con- sidered as a similarity or dissimilarity counter. More precisely:
whenever we have a bit position for which the maximum number of identical ‘‘physical” (non-gap) characters is less thannt, then we ignore that position, as it does not contain enough information to say if it conveys similarity or dissimilarity.
3. Results
3.1. Individual index variations
In order to explore how the extended many-item similarity metrics behave for different input data, we have generated random
four-item (t= 4) character sequences of various lengths (m= 10, 100, 1000 and 100 000) and calculated the extended similarity val- ues for various numbers of compared objects (n), according to both the weighted (w) and non-weighted (nw) formulas. In each case, we randomly generated 16 sequences. First, let us study how the average (of the absolute value)|s|of the comparisons with an indi- vidual indexschanges when we changen(Fig. 1).
An interesting pattern emerges here, similarly to the case of molecular fingerprints (bitvectors, corresponding to t = 2) [19]:
notice the alternating ‘‘zigzag” pattern of maxima and minima with a period of four. This behavior can be rationalized on the basis of the potential number of dissimilarity counters when changing the number of compared objects (sequences). Generally, both our results for molecular fingerprints, as well asFig. 1reflect an inter- esting characteristic of the extended comparisons: the average val- ues will tend to show an oscillating behavior with a period of t when we change the value ofn. In addition, applying a weighting scheme clearly amplifies these differences (Fig. 1).
3.2. Analysis of mean similarity indices and ranking behavior
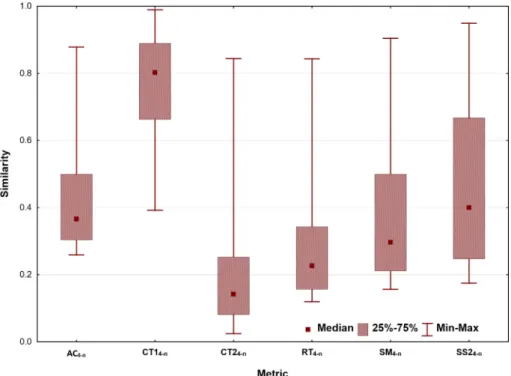
Next, we compared the range of similarity values returned by the various similarity metrics for the same dataset (Fig. 2). The indices cover different ranges from almost zero to one.
We can plausibly assume that all quaternary similarity indices express the similarity of the sequence sets with some error. As such, analysis of variance (ANOVA) is a suitable technique to decompose the effects of different factors. Here, the following fac- tors were considered: F2–number (n) of objects (sequences) com- pared, 14 levels withn = 2, 3,. . . 15; F3–weighting, two levels:
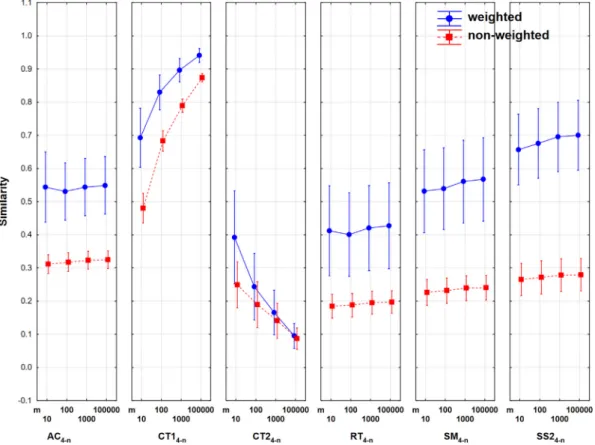
weighted and non-weighted versions; F4–the similarity coeffi- cients themselves: six levels (see Appendix 1); F5–length of the sequences, four levels:m= 10, 100, 1000, 100 000 (F1 is reserved for k-fold cross-validation iterations, see later). Altogether 14*2*6*4 = 6672 items (averages of similarity indices) have been decomposed into the above factors. The averages of the quaternary indices show a characteristic zigzag pattern (Fig. 3). The role of weighting is illustrated inFig. 3as a function of the number ofn (number of objects compared).
Here, the same zigzag pattern is observed as inFig. 1, with the
‘‘amplitude” being damped for non-weighted coefficients.
Weighted and non-weighted averages cover different ranges, the non-weighted indices are dispersed between ~ 0.2 and 0.5, whereas the weighted ones range from~0.2 to 0.9. The variances do not change much as the multiplicity of comparisons (n) increases. Weighting has no effect on pairwise (n= 2) comparisons;
and a similarly small effect can be seen for quintic (n= 5) compar- isons. The difference of weighted and non-weighted metrics is the largest forn= 4, 8 and 12,i.e.wherenis an exact multiple oft. The coupling of various factors reflects the behavior of the individual indices nicely (Fig. 4).
The two quaternary Consonni-Todeschini indices change rever- sely, with the gap between weighted and unweighted versions diminishing as the length of the sequences increases. The main rea- son for the fringe behavior of the CT indices is the presence of terms like ‘‘1 +p” and ‘‘1 +b+c” in their expression, which mean that the values of these indices will depend heavily on the length of the compared sequences. Compare this to an index like SM, which is calculated via (a+d)/p, it is clear that increasing the length of the sequences, the density of a given type of character is going to remain sensibly constant, so the overall effect is going to cancel between the numerator and denominator. This is in contrast with CT1 and CT2, in which the value of the indices will tend to mono- tonically increase or decrease, respectively, when we increase the length of the sequences, since the ‘‘1+” terms break the proportion- ality. This means that the CT indices cannot retrieve similarity
information from a set in a robust way, because of its marked length-dependence (note that this effect is more marked in the case of CT2). The other indices have values in a relatively narrower range and exhibit a slight increase as a function of sequence length.
To prioritize between the extended indices for further usage, a property that is even more important than the actual similarity values is the way the indices rank different groups of objects (se- quences), as compared to an ideal reference method (benchmark).
For this purpose, we have used Sum of Ranking Differences (SRD) [27], a robust multicriteria decision making tool that was exten- sively applied in our earlier works[8,17,19]. Briefly, SRD expresses the closeness of the individual methods (extended similarity met- rics) to the reference method by calculating a normalized Manhat- tan distance (termed the SRD value) between them, after rank- transformation. The smaller the SRD value, the closer the given metric is to the reference (benchmark). Here, the reference was defined as the average of the six similarity metrics, based on the consideration that the average will cancel out the individual errors at least partially. An illustrative example of SRD calculations is shown inSupplementary Figure S1.
After completing all SRD calculations for the groups detailed above (with varying settings ofn,mand weighting) with two types of sevenfold cross-validation, variance analysis (ANOVA) was com- pleted on the resulting SRD values. The following factors were con- sidered: F1–number (n) of compared objects (fingerprints or other representations), 14 levels:n= 2, 3,. . .15; F2–the similarity coeffi- cients themselves: 6 levels. The role of weighting (F3) was evalu- ated separately, because of the different scales of the weighted and non-weighted versions within the limits of 0 and 100. The ANOVA of the average similarity values (above) and the one on SRD scores exhibits an essential difference, as the smaller SRD val- ues are better.Fig. 5shows the comparison of the six different sim- ilarity measures in thet= 4 case.
First we can observe that weighted similarity metrics give almost identical rankings: SRD values are close to 0 for each metric, even for the two ‘‘outliers” CT1 and CT2. There is greater distinc- tion for non-weighted metrics: here, Rogers-Tanimoto (RT) emerges as the best option (closest to the reference), while Sokal-Sneath 2 (SS2) is the least favorable one. Taken together with the marked size dependence of CT1 and CT2 (see above), we can recommend the Rogers-Tanimoto (RT), and also the Austin- Colwell (AC) and Sokal-Michener (SM) metrics for further usage.
Additionally, we have compared the average SRD values in terms of the number of compared objectsn(Supplementary Figure S2):
for non-weighted metrics, a similar zigzag pattern (with maxima at multiples of four) emerges as for the similarity values them- selves, while for weighted metrics, there is again almost no distinc- tion between the metrics (SRD values close to 0).
3.3. Case studies of selected datasets
To evaluate our method in real-life scenarios, we have collected protein and DNA sequences for three families of proteins, each of which have great importance in medicinal chemistry. The three datasets also correspond to distinct cases in terms of the number and population of subfamilies, as well as their sequence diversities.
We have used then-ary similarity measures introduced here to quantify the similarity of these protein families and their subfam- ilies, based on their protein (t= 20), simplified protein (t= 8) and DNA (t = 4) sequences. For the simplified protein sequences, we have re-coded the protein sequences by classifying the amino acids into eight groups based on the chemical/pharmacophoric character of their side chains (seeTable 1).
The first case study involves the sequence comparison and mul- tiple (n-ary) similarity calculations of human protein kinases. Pro- tein kinases are regulatory and signaling proteins that account for
roughly 2% of the total human proteome[28], many of them are important pharmaceutical targets in mostly oncological indica- tions[29]. There are close to 500 protein kinases, having relatively diverse sequences, but a conserved structure (corresponding to their identical enzymatic function of transferring a phosphoryl group to a sidechain of a downstream signaling protein), classically grouped into eight subfamilies based on the sequence similarities of their catalytic sites (Fig. 6)[30,31].
The major (and minor) subfamilies display relatively close levels of similarity, except for the more diffuse ‘‘Other” category, consisting of kinases that are not grouped into the major subfam- ilies based on evolutionary relations/similarity. The DNA- and
protein-based similarities (t = 4 and t = 20, respectively) are roughly equal for most of the subfamilies, but the similarities based on simplified amino acid sequences (t= 8) are notably larger (this is particularly nicely illustrated by the otherwise diffuse group of all kinases). This supports the notion that due to the shared function of kinases (protein phosphorylation), amino acids tend to be replaced with sidechains of similar character (which is reflected in our sidechain categorization scheme, seeTable 1).
Set similarities calculated individually with the six (non- weighted and weighted) indices are included in Supplementary Figures S3 and S4. We can observe that non-weighted metrics usu- ally offer a greater level of distinction than weighted ones. The Fig. 1.Variation of the average (of the absolute value) of all possiblen-ary comparisons over 16 sequences of lengthm= 10 tom= 100 000 for different values ofnfor the quaternary (t= 4) weighted (w,left) and non-weighted (nw,right) AC (Austin-Colwell, top) and CT1 (Consonni-Todeschini 1, bottom) indices.
weighted formulas display a peculiar behavior, returning higher similarity values when more objects (n) are compared (this is also true for the non-weighted CT2 metric).
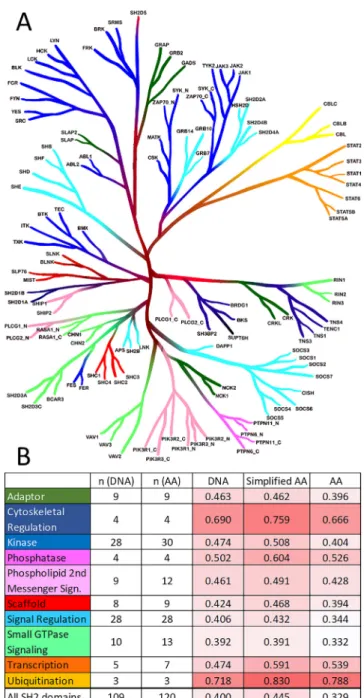
In the second case study, sequences of 120 human SH2 domains are compared. SH2 domains are ancient modular protein units that arose within multicellular life and are key regulators of cellular sig- nal transduction[32]. They recognize phosphotyrosine-containing peptide motifs in a highly selective manner, depending on the con- textual sequence[33]. SH2 domains have a relatively conserved fold and are found in proteins with diverse functions, including
kinases, transcription factors, scaffold proteins,etc., with many of them being involved in oncogenic processes [34]. Compared to kinases, we have more, relatively smaller groups of SH2- containing proteins, and interestingly, their functional grouping does not directly correspond to the phylogenetic distance of the SH2 domains themselves, as illustrated by their phylogenetic tree (Fig. 7).
Here, differences between the DNA/protein-based and simpli- fied protein-based similarities are much smaller than in the case of kinases, suggesting a higher degree of freedom in terms of amino Fig. 2.Box plots with the median, interquartile range and minimum–maximum of individual quaternary (t= 4) indices.
Fig. 3. The effect of weighting on the means of quaternary (t= 4) similarity coefficients as a function of the number of compared objectsn(w: weighted, nw: non-weighted).
acid substitutions. This can be explained by individual SH2 domains selectively recognizing phosphotyrosine-containing pep- tide segments with diverse contextual sequences, requiring more specific (and equally diverse) binding motifs on the SH2 domains themselves. Also, in this case, there is a greater level of distinction between the set similarities of smaller and more compact groups (e.g.cytoskeletal regulators) and larger, more diffuse groups (e.g.
small GTPase signaling proteins).
Set similarities calculated individually with the six (non- weighted and weighted) indices are included in Supplementary Figures S5 and S6. The non-weighted results are mostly in agree- ment withFig. 7B, although the CT1 and CT2 metrics seem to offer
a lower level of distinction (operating in a narrower range). A pecu- liar result in the case of the weighted metrics is that the group of all SH2 domains was assessed to be more similar than any of the subfamilies, but only based on the DNA sequences. Together with the results on the kinases, this suggests the wider applicability of the non-weighted formulas.
Finally, the last case study involves the sequence similarity cal- culations of a large family of cytochrome P450 (CYP) enzymes. CYP enzymes are heme-thiolate proteins that are found in virtually all organisms[35]. Commonly, they use electrons from NAD(P)H to catalyze the activation of molecular oxygen, but their reactions can be surprisingly diverse. They are involved in vital processes Fig. 4.Averages of extended similarity coefficients. Line plots correspond to weighted and non-weighted options. The lengths of the sequences (m, F5) are plotted on the upperx axis, whereas the lower x axis contains the individual extended indices.
Fig. 5.Comparison of the individual non-weighted (A) and weighted (B) similarity coefficients with the ANOVA analysis of their normalized SRD values (0–100). The abbreviations can be found inAppendix 1.
such as chemical defense in plants or degradation of xenobiotics in animals. The latter signifies their main importance in medicinal chemistry and drug design: hepatic CYP enzymes are the main dri- vers of drug metabolism[36]. The number of currently known CYP enzymes is over 40 000[37], their classification was introduced and refined by a nomenclature committee[38,39]as follows: the root symbol CYP is followed by a number for families (groups of proteins with more than 40% amino-acid sequence identity, cur- rently there are more than 300), a letter for subfamilies (with greater than 55% identity) and a number for the protein, for example CYP2C9. Here, we quantify the similarities of the CYP2 family and its subfamilies (Fig. 8): in addition to being the Fig. 7.A) Phylogenetic tree of human SH2 domains (adapted from the work of Liu et al.[32]with permission from Elsevier). While smaller protein groups generally comprise compact clusters (e.g.transcription factors, orange), larger groups are more diffuse (e.g.kinases, blue). B)n-ary similarities of the SH2 subfamilies (with matching colors to panel A), calculated for DNA, amino acid (AA) and simplified amino acid sequences (average of all six, non-weighted similarity metrics), along with the numbers of compared objects (n). (For interpretation of the references to colour in this figure legend, the reader is referred to the web version of this article.)
Fig. 6.A) Phylogenetic tree of human protein kinases, with the seven larger subfamilies (illustration reproduced courtesy of Cell Signaling Technology, Inc.–
www.cellsignal.com). B)n-ary similarities of the kinase subfamilies, calculated for DNA, amino acid (AA) and simplified amino acid sequences (average of all six, non- weighted similarity metrics), along with the numbers of compared objects (n).
Table 1
Re-coding scheme for producing the simplified protein sequences based on the chemical/pharmacophoric character of amino acid sidechains.
Residue Residue group
Glycine (G) Glycine (G)
Alanine (A), valine (V), leucine (L), isoleucine (I), methionine (M)
Hydrophobic (H) Phenylalanine (F), tyrosine (Y), tryptophan
(W), histidine (H)
Aromatic (A) Aspartate (D), glutamate (E) Negative (N) Lysine (K), arginine (R) Positive (P) Asparagine (N), glutamine (Q) Amide (D)
Serine (S), threonine (T), cysteine (C) OH/SH-based H-bond donor/
acceptor (B)
Proline (P) Proline (R)
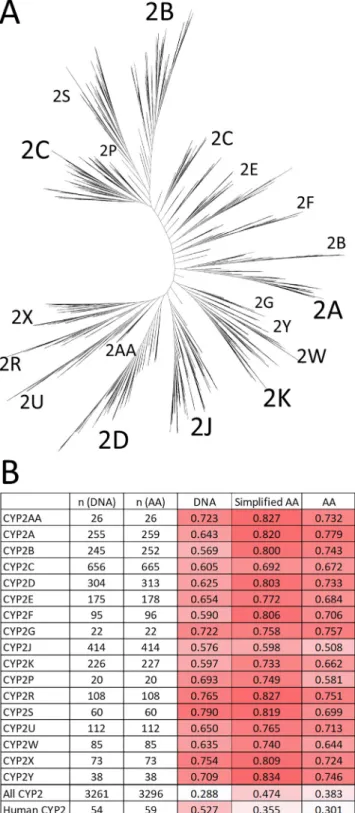
largest known family (3296 proteins), the CYP2 family contains many of the key human metabolic CYP enzymes (such as CYP2C9) with high relevance for the ADME prediction of drug candidates [40].
Here, since the large number of CYP enzymes are classified into subfamilies based on sequence homology, it is no surprise that we can observe higher levels of similarity in virtually all subfamilies.
Differences between the original and simplified protein-based sim- ilarities are mostly moderate, but the DNA sequences are consider- ably less similar for some groups (e.g.2B, 2D or 2F), suggesting that genetic codes of diverse species can yield CYP2 enzymes of similar protein sequence. The other face of the same coin is represented by the human CYP2 proteins: a group of 59 enzymes with representa- tives from 12 of the 18 CYP2 subfamilies inFig. 8(hence, constitut- ing a more diffuse group than any individual subfamily). Here, the genetic code is more similar than the protein sequences, suggest- ing that within the same species, relatively fewer/smaller genetic mutations can yield a more diverse panel of CYP2 enzymes.
Set similarities calculated individually with the six (non- weighted and weighted) indices are included in Supplementary Figures S7 and S8. From the non-weighted metrics, CT2 seems to be an outlier based on its assessment of the ‘‘All CYP2” and
‘‘Human CYP2” sets, while the rest of the metrics agree with the results inFig. 8B. At the generally much higher level of similarity of the CYP2 subfamilies, the weighted formulas offer little distinc- tive power, consistently returning values close to 1 (CT2 is interest- ingly an outlier again, this time by working in a wider operating range).
We briefly note that besides thet= 8 case presented here, other amino acid re-coding schemes can be introduced as well. A few of these possibilities (with varying values oft) are presented inSup- plementary Figure S9, with the similarity values calculated for each protein class summarized inFigure S10. While there seem to be slightly higher similarity values for several protein classes at lower values oft, the trend is not consistent and the differences between the re-coding schemes are always much smaller than the differ- ences across the protein classes. Nonetheless, we cannot recom- mend any further generalization than the one presented in the main text, since a smaller number of residue classes inevitably forces together amino acids of different character.
3.4. Diversity picking
Having a set of extended many-item (t,n) similarity metrics opens the doors to potentially many applications in bioinformatics.
Here, we explore diversity picking as an illustrative example. In cheminformatics, diversity picking is a key concept for selecting a smaller number of molecules that represents the variability of a much larger chemical space (this was addressed in detail in our recent work, where we introduced (2,n) similarity metrics[20]).
Analogously, selecting diverse macromolecular sequences can be important in certain situations (e.g.the selectivity of kinase inhibi- tors is often evaluated against a small, but diverse panel of kinases to cover all major branches of the phylogenetic tree[41,42]).
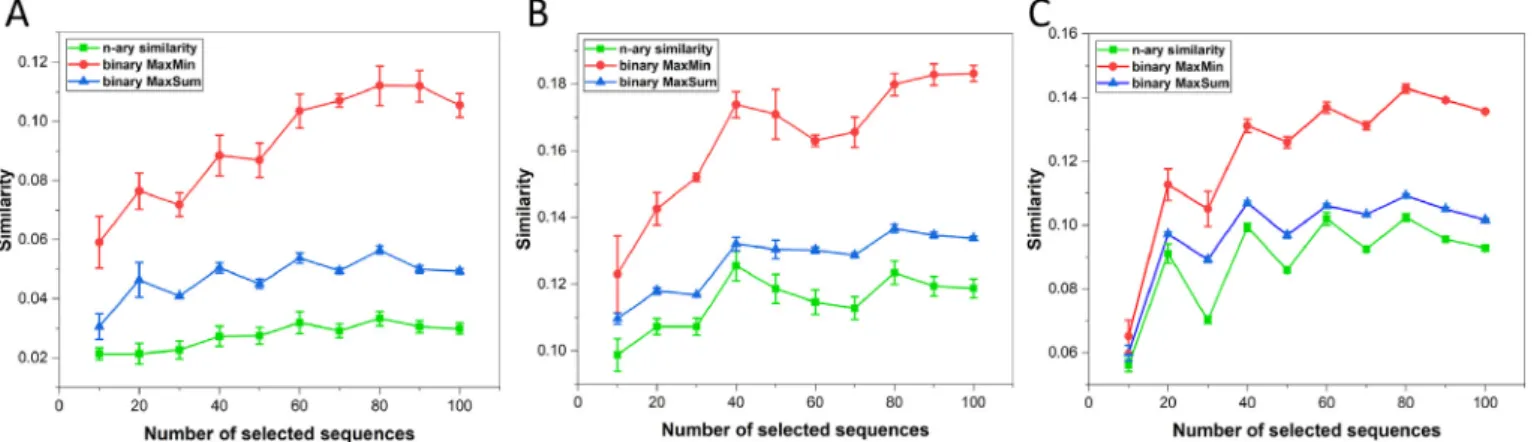
After implementing a diversity picker algorithm based on the (t,n) similarity metrics (as well as the MaxMin and MaxSum algo- rithms as two well-known diversity pickers for benchmarking [20]), we have tested it by selecting small sets of varying sizes (10, 20. . ., 100) from the CYP2 family of altogether 3296 enzymes (Fig. 9). Each set was selected three times to establish error ranges.
Most importantly, our n-ary diversity picker surpassed the benchmark methods by providing more diverse sets in every case, corroborating our earlier results for the (2,n) comparisons [20].
Interestingly, we also observe local maxima in most cases fornval- ues that are multiples oft(e.g.40 and 80 fort= 8). We can conclude that the new metrics present an ideal choice for diversity picking;
Fig. 8.A) Phylogenetic tree of CYP2 enzymes. B)n-ary similarities of the CYP subfamilies, calculated for DNA, amino acid (AA) and simplified amino acid sequences (average of all six, non-weighted similarity metrics), along with the numbers of compared objects (n).
the algorithm is available at https://github.com/ramirandaq/tn_
Comparisons.
4. Conclusions
We have recently introduced a framework to extend the con- cept of similarity calculations from binary comparisons (similarity of two objects) ton-ary or multiple comparisons (similarity of sets of objects), chiefly for molecular fingerprint similarities in chemin- formatics[19,20]. Expanding upon our results, here we have intro- duced extended many-item–or(t,n)–similarity metrics, moving from the domain of binary fingerprints (bit-strings containing two possible characters, such as 0 and 1) to character sequences (strings with an arbitrary numbert of possible characters), such as DNA (t= 4) and protein sequences (t= 20). In our ‘‘democratic matching” approach (where matches are quantified in the same way, independently of the characters being matched), six existing similarity metrics can be extended for this purpose: SM (simple matching), RT (Rogers-Tanimoto), SS2 (Sokal-Sneath), CT1, CT2 (Consonni-Todeschini), and AC (Austin-Colwell).
In addition to a full theoretical description, we have provided a detailed study on the characteristics of the new similarity indices, including the typical ranges of similarity values returned, and how certain factors influence these results. For this purpose, we have applied analysis of variance (ANOVA).
Additionally, we have demonstrated the usage of the extended many-item similarity indices on three case studies of DNA, protein, and simplified protein (eight categories of similar amino acids) sequences of three existing protein families, and briefly explored diversity picking as one of the possible applications. The metrics present a new option for a quick calculation of the similarity of sets of sequences and have been demonstrated to provide good levels of distinction between protein groups with varying degrees of simi- larity. Nonetheless, we can narrow down our choice from the wide selection of new similarity metrics, accounting for some of the observations in this study,e.g.non-weighted formulas usually offer more distinctive power, and the CT2 metric often acts as an outlier.
A multicriteria decision tool (sum of ranking differences) allowed to select the most advantageous similarity coefficents. Considering these results, along with the marked size dependency of the CT1 and CT2 metrics, we recommend the Rogers-Tanimoto (RT) coefficent as an optimum choice. The Python code for the extended many-item similarity indices is publicly available at:
https://github.com/ramirandaq/tn_Comparisons
5. Methods
5.1. Statistical analysis
In section 3.2, the means of the extended similarity coefficents were analyzed using factorial analysis of variance (ANOVA)[43].
Factorial ANOVA was applied on the raw data, considering the fol- lowing factors: F2–number (n) of objects (sequences) compare, 14 levels (n= 2, 3,. . .15); F3–weighted or unweighted version of the extended many-item similarity indices, two levels (w, nw); F4–
the extended many item similarity coefficients themselves, six levels (AC, CT1, CT2, RT, SM, SS2); F5–sequence lengths, four levels (m= 10, 100, 1000, 100 000). Here, sequences were generated ran- domly, using four characters: A, C, G, T. The factors yield a total of 14*2*6*4 = 672 combinations and their effects were examined sep- arately and in certain combinations (section 3.2).
Additionally, ANOVA was also performed on the normalized Sum of Ranking Differences (SRD) values obtained for the similar- ity measures (with the average of the six measures implemented as the reference method). Briefly, Sum of Ranking Differences is a robust multicriteria decision making tool [27] that is widely applied for method comparison in diverse fields [44–46]. SRD yields a normalized Manhattan distance (the SRD value) for each alternative method (here, similarity metric) as a measure of close- ness to the reference method, which can be an independent gold standard or can be defined by a suitable data fusion method (in most cases, the average) from the compared methods. To adjust for the possibly different scales of values returned by the methods, rank transformation is applied as a data preprocessing step.
SRD implements several validation steps, and is maintained for several platforms, including MS Excel (http://aki.ttk.hu/srd/), Python (https://github.com/davidbajusz/srdpy) and R Shiny (https://attilagere.shinyapps.io/srdonline/)
5.2. Collection of protein and DNA sequences
Pre-aligned kinase sequences were downloaded from http://kinase.com [28]. The SH2 domain sequence alignment was adapted from the work of Liuet al.[32]. Aligned sequences of the CYP2 family and its larger subfamilies (with20 proteins) were downloaded from the Cytochrome P450 Engineering Database (current website: https://cyped.biocatnet.de/) [37]. The phyloge- netic tree for the CYP2 family was drawn with Hypertree[47].
Fig. 9.Results of diversity picking from the CYP2 family of enzymes with then-ary (green, bottom), and the binary MaxMin (red, top) and MaxSum (blue, middle) diversity pickers for DNA (A), simplified amino acid (B) and amino acid (C) sequences. Diversities are expressed as extended many-item similarities (average of the six metrics) for the complete sets of 10, 20,. . .100 selected sequences. Data are shown as averages +/- standard deviations. (For interpretation of the references to colour in this figure legend, the reader is referred to the web version of this article.)
By default, our extended similarity metrics involve the detec- tion of identical characters as similarity counters (with the excep- tion of the "-" character for gaps). In contrast, during the comparison of protein sequences, amino acids of similar character (hydrophobic, aromatic, etc.) are also considered as a feature of similarity (as implemented in popular similarity scoring matrices, such as BLOSUM[15]). To reflect this, we introduce here a simple idea to ‘‘re-code” the protein sequences by grouping the natural amino acids into 8 groups, based on their sidechain character (Table 1). We have to note that this is a rather crude approach that does not account for the possible overlaps between these groups (for example, we classify histidine as aromatic, but it can assume a positively charged character upon protonation; similarly, cys- teine is often deprotonated,etc.). The introduction of overlapping features would require serious modifications to the methodology and would constitute the basis of a separate work.
Finally, DNA sequences were downloaded from corresponding NCBI databases (chiefly, Entrez [48]) by either a look-up of the gene identifiers of the proteins (for the CYP dataset), or a BLAST search of the corresponding protein sequences (with the tblastn algorithm[49], for the kinase and SH2 datasets). In the latter case, at most one mismatch was allowed between the query protein sequence and the protein sequence resulting from the translation of the gene hit (to allow for transcript variants if the exact sequence was not found), retaining a sequence identity of more than 99% in every case (100% in most cases). The lookup was suc- cessful for 437 kinases (out of 491) and 109 SH2 domains (out of 120). The DNA sequences were aligned with Clustal Omega[50].
6. Availability of data and materials
Python code for calculating the extended many-item similarity metrics is freely available at: https://github.com/ramirandaq/tn_
Comparisons.
Funding
- National Research, Development and Innovation Office of Hun- gary (OTKA), contracts K_20 134,260 (KH), K_20 135,150 (DB) and PD_20 134,416 (AR)
- University of Florida: startup grant: RAMQ
- Hungarian Academy of Sciences: János Bolyai Research Scholar- ship: DB
- Ministry for Innovation and Technology of Hungary: ÚNKP-20–
5 New National Excellence Program: DB.
CRediT authorship contribution statement
Dávid Bajusz:Conceptualization, Software, Writing - review &
editing, Data curation, Investigation, Methodology, Project administration.Ramón Alain Miranda-Quintana:Conceptualiza- tion, Software, Writing - review & editing, Formal analysis, Project administration, Resources. Anita Rácz: Conceptualization, Methodology, Writing - review & editing, Project administration.
Károly Héberger: Conceptualization, Validation, Funding acquisition, Writing - review & editing, Project administration, Resources.
Declaration of Competing Interest
The authors declare that they have no known competing finan- cial interests or personal relationships that could have appeared to influence the work reported in this paper.
Appendix 1:
Extended many-item similarity indices.
Metric Label Name Equation
AC ACt-n_w extended many-itemAustin-Colwell
ACtnw¼2parcsin
ffiffiffiffiffiffiffiffiffiffiffiffiffiffiffiffiffiffiffiffiffiffiffiffiffiffiffiffiffiffiffiffiffiffiffiffiffiffiffiffiffiffiffiffiffiffiffiffiffiffiffiffiffiffiffiffiffiP
sfsðDnðkÞÞCnðkÞ
P
sfsðDnðkÞÞCnðkÞþP
dfdðDnðkÞÞCnðkÞ
r
ACt-n_nw
ACtnnw¼p2arcsin
ffiffiffiffiffiffiffiffiffiffiffiffiffiffiffiffiffiffiffiffiffiffiffiffiffiffiffiffiffiffiP
sfsðDnðkÞÞCnðkÞ
P
sCnðkÞþP
dCnðkÞ
r
CT1 CT1t-n_w extended many-itemConsoni-Todeschini(1)
CT1tnw¼ ln 1þ P
sfsðDnðkÞÞCnðkÞ
ð Þ
ln 1þP
sfsðDnðkÞÞCnðkÞþP
dfdðDnðkÞÞCnðkÞ
ð Þ
CT1t-n_nw CT1tnnw¼ ln 1þ
P
sfsðDnðkÞÞCnðkÞ
ð Þ
ln 1þP
sCnðkÞþP
dCnðkÞ
ð Þ
CT2 CT2t-n_w extended many-itemConsoni-Todeschini(2)
CT2tnw¼ln 1þ P
sfsðDnðkÞÞCnðkÞþP
dfdðDnðkÞÞCnðkÞ
ð Þln 1þP
dfdðDnðkÞÞCnðkÞ
ð Þ
ln 1þP
sfsðDnðkÞÞCnðkÞþP
dfdðDnðkÞÞCnðkÞ
ð Þ
CT2t-n_nw
CT2tnnw¼ln 1þ P
sfsðDnðkÞÞCnðkÞþP
dfdðDnðkÞÞCnðkÞ
ð Þln 1þP
dfdðDnðkÞÞCnðkÞ
ð Þ
ln 1þP
sCnðkÞþP
dCnðkÞ
ð Þ
RT RTt-n_w extended many-itemRogers-Tanimoto
RTtnw¼
P
sfsðDnðkÞÞCnðkÞ
P
sfsðDnðkÞÞCnðkÞþ2P
dfdðDnðkÞÞCnðkÞ
RTt-n_nw RTtnnw¼
P
sfsðDnðkÞÞCnðkÞ
P
sCnðkÞþ2P
dCnðkÞ
SM SMt-n_w extended many-itemSimple matching
(Sokal-Michener) SMtnw¼
P
sfsðDnðkÞÞCnðkÞ
P
sfsðDnðkÞÞCnðkÞþP
dfdðDnðkÞÞCnðkÞ
SMt-n_nw SMtnnw¼
P
sfsðDnðkÞÞCnðkÞ
P
sCnðkÞþP
dCnðkÞ
SS2 SS2t-n_w extended many-itemSokal-Sneath(2)
SS2tnw¼ 2 P
sfsðDnðkÞÞCnðkÞ
2P
sfsðDnðkÞÞCnðkÞþP
dfdðDnðkÞÞCnðkÞ
SS2t-n_nw SS2tnnw¼ 2
P
sfsðDnðkÞÞCnðkÞ
2P
sCnðkÞþP
dCnðkÞ
![arXiv:1903.00692v1 [math.GR] 2 Mar 2019](data:image/gif;base64,R0lGODlhAQABAIAAAP///wAAACH5BAEAAAAALAAAAAABAAEAAAICRAEAOw==)