András BaloghA, Péter BajmócyB*, Zsófia Ilcsikné MakraB
Received: February 20, 2018 | Revised: July 04, 2018 | Accepted: July 21, 2018 DOI: 10.5937/gp22-16641
Social and Ethnic Segregation
amongst the Smallest Hungarian Villages
A Eötvös Loránd University, Savaria University Centre, 4 Károlyi Gaspar Square, 9700 Szombathely, Hungary; balogh.andras@sek.
elte.hu
B Department of Economic and Social Geography, University of Szeged, 2 Egyetem Street, 6722 Szeged, Hungary; bajmocy@
geo.u-szeged.hu, makra.zsofia@geo.u-szeged.hu
* Corresponding author: Péter Bajmócy; e-mail: bajmocy@geo.u-szeged.hu
Abstract
Social segregation is one of the most important social problems in Central-Eastern Europe not only in urban, but also rural areas. The social segregation usually coexists with ethnic segregation. In West- ern-Europe we can see segregation mainly in towns, but in Eastern-Europe also in villages, usually con- necting with Roma people. In the last decades number of population of small villages dropped dramat- ically and in some regions the most disadvantaged social groups appeared in these villages. Nowadays some of these villages have geographical, social and ethnic disadvantages together. To stop marginali- zation of people living in poverty is one of the biggest challenges nowadays in Hungary. According to the definition of Hungarian Statistical Office the whole settlement is regarded segregated if it has less than 200 inhabitants, therefore we also determined this limit. These settlements with population be- low 200 were the subject of this study. A complex indicator system was established containing six indi- cators (educational level, unemployment, comfort level of homes, etc.) These indicators served as the base of cluster analysis using the K-means algorithm resulted in five clusters. The 58 segregated settle- ments can be found mainly in peripheral areas of Northeastern- and Southwestern-Hungary. The pro- portion of Roma population is high in most of the segregated settlements. The aim of the paper is to describe the most important social problems of the smallest Hungarian villages, to find the groups of villages with social segregation and marginalization and to find context between marginalization, social and ethnic segregation amongst the tiny Hungarian villages.
Keywords: social segregation; ethnic segregation; tiny villages; Hungary; Roma; peripheries; marginali- zation
Introduction
Stopping of marginalization of people living in pover- ty is one of the biggest challenges nowadays in Hun- gary. This also causes significant modification in the spatial structure of the country and smaller territori- al units besides its many negative social and economic consequences. Although there were examples for es- tate-like coexistence and physical separation of cer- tain social groups before the regime change, the spa- tial location of the different social categories changed
significantly _ since the late 1980’s. During this peri- od the sociologists and geographers picked up on that coherent crisis zones were formed in some regions of the country due to emerging high-degree and perma- nent unemployment, ceasing of workplaces, impover- ishment and massive migration of those who are in a better social situation. The educational level and eth- nic composition of people also contributed to this ap- preciably. The spatial segregation within the different
social status groups is realized not only within the ad- ministrative boundaries (egg.: slumming quarters of the cities) of some settlements but the situation ap- plies to the settlement as a whole. It means that settle- ments become segregated in their entire extent that is fostered by the spatial positions and settlement mor- phological facilities of the settlements. In unfavoura- ble cases, their close spatial location results in forming bigger coherent disadvantaged regions.
The subject of our study is the settlement-level seg- regation in other words such small ghetto-like villages
that lost the majority of their population by now. Col- lective neighbouring occurrence of such villages result- ed in formation of regions with multiple disadvantages, primarily in the north-east and south Transdanubian parts of the country. These settlements are bordered by our own methodology we reveal the social economic reasons leading to their formation. We analyse the cur- rent situation of these settlements and the possibilities for development. We define the concept of segregation and the place of segregation, possibilities of characteri- zation and outline its story in Hungary.
Scope of segregation and place of segregation
Segregation is a social phenomenon when the social distance among different groups becomes spatial dis- tance as well. Segregation consolidates the inequality of income conditions, infrastructure of the settlement and access to the different services (Andorka, 2003;
Kadét & Varró, 2010; Milanković et al., 2015). Groups that have a stronger status restrict the opportunities to free choice of the weaker ones thus damaging _ equal opportunity of the last mentioned sending them to the status of total marginalization (Farwick, 2009;
Mező, 2013). The market conditions the first of all the housing market and the labour market, the mobility processes, the social and economic position, the so- cial prejudices and discrimination play the main role in the development of segregation (Cséfalvay, 1994;
Schönwalder, 2007). One of the most important in- dicators of social marginalization and spatial segre- gation is the low employment (Siptár & Tésits, 2014).
In the social hierarchy the status of an individual or a group is strongly determined by the income or the lack of it (Berényi, 1997).
Researches of segregation in sociology and ge- ography are above all from a poverty and an ethni- cal point of view (Allison, 1978; Duncan & Duncan, 1955; Kliček & Lončar, 2016; Liberson, 1963; Taubner
& Taubner, 1965; Steinnes, 1977). But it must be noted that regarding the income dimension not only pover- ty but material wealth can be resulted in spatial-mu- nicipal segregation of certain social groups. So it is absolutely typical not only for the spatial moving pro- cess of the low social status inhabitants as opposed to the general view (Rácz, 2012). The expression margin- al can be used for people who find themselves outside the mainstream behavioural pattern of society, but we have to be careful not to use it simply as a synonym for unfavourable, indigent or being in a disadvantaged position. Individuals and communities can be hap- py despite being far from the mainstream (Giddens, 1984; Balogh, 2002.). Looking at their spatial aspects
all marginal groups can create unique geographical
spaces, even within one settlement. Typical examples of these can be on one hand the housing estates of the wealthy, on the other hand the slums. Segregated area (segregatum) is a relatively new expression to describe settlements or part of a settlement with inhabitants of a low social status group.
Places of segregation are such geographical spaces developed by segregation where marginalized social groups are concentrated in a separate area. Therefore, spatial separation is not the reason but the conse- quence of the increasing social differences. There could be not only disadvantages (there is no social in- tegration, deepening conflicts, increasing alienation, and accumulation of constraints) but advantages of this process such as increased feeling of home (famil- iar rules, familiar micro environment) sense of secu- rity maintaining the values of the group and increas- ing group identity.
Generally speaking, a place of segregation is a ter- ritorially separated deteriorated site inhabited mainly by the Roma. This pejorative meaning is strengthened by politics and the perspectives of regional develop- ment and the official statistical methodology as well.
According to the second edition of Urban Develop- ment Handbook issued by the Ministry of National Development and Economic Affairs in 2009 delinea- tion of areas threatened by segregation can be based on one hand on census data in the following way:
minimum 50% of the working age population does not have regular labor income and the highest com- pleted level of education does not exceed grade 8. Ar- eas threatened by segregation are where this indica- tor is between 40% and 50% (Rácz, 2012). On the other hand, delineation can be based on regular social sup- port schemes so that in proportion of those eligible for support to the number of inhabitants/homes reaches double of the settlement average. The area is consid- ered to be threatened in case of value 1,7. The Urban Development Handbook also stipulates that the area concerned must have at least 50 inhabitants in order
to be treated as a place of segregation (Lennert et. al., 2014).
Places of segregation were delineated in Hungary based on census data of 2001 using this methodology by the Hungarian Central Statistical Office. Howev- er, the maps of places of segregation produced in this way were not aggregated and the segregation indica- tor could only be produced on settlement level where the number of inhabitants was over 2000 and not be- low. The information including the necessary data for mapping and delineation of segregated areas and ar- eas threatened by segregation was refined by a Gov- ernment Decree in such way that different segregation
thresholds were determined for the different size set- tlement and part of settlement. For example, an area is considered to be segregated of some part of the dis- tricts of the capital city where the employment and income-based segregation index is 20% or higher. In case of municipalities, district seats, towns and villag- es having more than 2000 residents this indicator is 35% or higher while in settlements with less than 2000 inhabitants this index reaches the above-mentioned 50% or more. The segregation indicator must be deter- mined for the whole settlement if the settlement has less than 200 residents.
Types of residential segregations
Segregations can be grouped based on coherent and partly overlapping aspects according to the previous investigations and experiences in Hungary.
• Segregations can be located inside of the settle- ment, in skirts of inhabited areas or in the outskirts.
(Lennert et. al., 2014).
• They can be distinguished based on their size whether they are part of the settlement or admin- istratively independent settlements. The most im- portant question regarding spatial expansion op- portunities and possibilities of further expansion of segregation to the neighbouring areas. Spread- ing of the effects significantly depends on the close- ness or openness of the place of segregation (Siptár
& Tésits, 2014).
• Categories can be defined based on the types of concerned settlements depending on whether the place of segregation is developing in a rural or an urban environment. Serious source of danger of to- tal segregation and emergence of ghetto-like settle- ments especially in villages where the number of inhabitants is relatively low. Some parts of the set- tlement can become site-like in case of bigger cities.
• The most valuable parts of the concerned settle- ment monopolized and occupied by the rich can
be distinguished based on the social stratum and some group-specific features (income, ethnicity, employment etc.). We can also distinguish village and small town Roma settlements or metropolitan housing estates occupied by low-income physical workers or pensioners too etc.
• Places of segregation can differ from each other based on their morphological features. Besides the dilapidated and totally same buildings of the pre- vious worker colonies and the same blocks of flats in the housing estates there are the so called low level of housing value flats (“Cs”-flats) where main- ly Roma people live. These are roughly unified and having different appearance and social political flats what were built by type design in poor quality.
Of course, besides this categorisation based on these aspects there are categorisations depending on the views of many other authors and researchers.
Settlement surveys were made in Hungary after the change of the regime by ministerial, demographical and medical officer coordination. These surveys in- evitably resulted in characterisation and their evolu- tion lived many variations until now. We do not make these variations known in this study.
Historical antecedents in Hungary
Separation of place of residence of the different so- cial strata according to religion and nationality was a general phenomenon in the feudal Hungary. There were so called Latin quarters in the early history of the free royal cities. The resettlement of the moving Roma population after the Turkish occupation can be attributed to the name of Maria Thereza and the first settlements developed at this time (Lennert et.
al., 2014). The authorities designated sites at the bor-
der of the villages, forced them to give their itinerant/
mobile crafts (pottery repair, basin deepening, metal work, knife sharpening etc.). It was difficult for them but they were able to fit in the local division of labour by performing blacksmiths works, shepherding, play- ing music etc.
About 90% of the Roma people in Hungary lived in segregation at the beginning of the 20th century in addition they slowly started to lose their existing tra-
ditional way of making a living (Csalog, 1984). Spread- ing of mass production of the manufactured goods, developing of mechanisation of the agricultural sec- tor and the loss of their traditional customer base in- creased unemployment among them. Besides Roma people increased proportion of the poorest people (e.g.: rural poor peasants) moved into sites (Lennert et.
al., 2014). Those living in the outskirts of settlements – in manors and scattered farms – were increasingly separated not only by space but social distance from the population of the central settlements.
Economical settlement development measures of the new state power system after World War II in- creased inequalities of settlements. On the base of classification of settlements originating different cen- tral financial resources top-down driven council sys- tem conferring the local organizations with executive functions, collectivization of agriculture and institu- tional regionalization (concerning the councils the collective farms schools and shops) the gap has grown continuously between the privileged settlements and the functionally exhausting settlements due to these measures (Balogh, 2008; Enyedi, 1980; Illés, 2009;
Virág, 2005). Selective emigration was the reaction of the population for these measures which almost ac- celerated as escaping in some areas from the coun- try, consequently only the elderly, the poor, people with low-level education and people working in agri- culture stayed in hopeless situation in small villages.
From the 1970’s the social structure started to change besides depopulation in any small villages. People with a lower social status moved into empty houses of moving people. These houses were unsalable due to depreciation and became enticing for poor people.
The state supported the loans that could be used to buy the empty properties. These loans were most frequent where because of the lack of investment in the infra- structure, lack of job opportunities and therefore leav- ing inhabitants, property prices were low. This made it possible together with state support that poor, main- ly Roma families could buy properties from those who moved out, using loans provided by the state. This also benefited those who moved out, since they could sell their otherwise unsalable properties for a reason- ably favourable price (Kemeny at al., 2004; Ladanyi
& Virag, 2009). Due to the fact that the local execut- ers of the central decisions were not the actual settle- ments, but the council districts or party committees, the decisions about purchasing discounted properties, the building and location of reduces value flats for the Roma were always made in the district centre. In other words, they could allocate the village where the Roma should be concentrated into. This lead to further seg- regation between settlements; some villages were sim- ply written off by the local authorities. This process
resulted in a new type of settlement ghetto-like small villages by the end of the 1970’s and beginning of the 1980’s where new type of excluded strata clog togeth- er the village underclass (Ladányi & Szelényi, 2004;
Ladányi & Virág, 2009). The traditionally local Hun- garian community and the newly arriving Roma peo- ple segregated together both from their wider envi- ronment and _ other settlements. In many cases they segregated from each other also in their own settle- ments. Existing differences regarding quality of life and philosophy of the two ethnics further increased that was accompanied by mutual disaffection result- ing in the phenomena of one settlement and two com- munities (Agarin, 2014; Baranyi et al., 2003; Fekete, 2005; Kocsis & Kovács 1999).
The change of regime in the 1990’s affected the eco- nomics the society and thus the spatial structure and settlement structure of the country fundamentally.
The most important consequence of the conversion was increase and acceleration of inequalities that was shown significantly in income differences and living conditions (Andorka, 2003; Kolosi, 2000). Segregation processes were further strengthened. Natural regen- eration of the population within settlements emerging of preferred and non-preferred areas produced again the already liquidated places of segregation (Lennert et al., 2014). 51% of responding local governments in- dicated that local segregation can be detected in the settlement according to the survey conducted by TÁRKI Economic Research Institute in 2003 (Kopasz, 2004). Then the starting site programmes supported by national or EU resources covered a narrow range of settlements and produced results only in some parts.
More forceful local government support civil capac- ity that is able to continue the initiatives more flexi- ble administration and more integrated and complex programmes would have been necessary. There are no_ two same sites so different answers are needed.
During the 2014-2020 planning period it was estimat- ed that liquidation of every seventh site seems to be realistic. The scope of the Hungarian planning doc- uments was widened with the Integrated Settlement Development Strategy that is a medium-term strate- gic-oriented implementation-oriented planning docu- ment. The so called anti-segregation plan is important part of this document. Delineation of the segregation threatened areas in the anti-segregation plans is laid out on the base of the guidelines of the Urban Devel- opment Handbook.
However, segregation strengthened not only with- in the settlements, but it was typical for whole are- as and regions and we are almost entirely indebted for their treatment. As social strata with higher in- come moved into suburbs at the same time outflow of people with lower status started to the peripher-
al parishes outside agglomerations increasing spa- tial separation (Ladányi & Szelényi, 1997). The ma- jority of the population of ghetto villages is excluded from the cities especially Budapest and successful- ly suburbanized villages. Great mass of these villag- es forms increasingly coherent spaces, ghetto-like ar- eas. The reason for this is that the low employment
and high unemployment rate, lack of jobs, migra- tion of educated/skilled people and relocation of the poor. Increasing number of residents, rising num- ber of young people, strengthening of ethnic concen- tration and local conflicts are the main characteris- tics of these settlements (Boros, 2011; Kertesi & Kézdi 1998; Ladányi & Virág, 2009).
Aspects of analysis and methodology
Those settlements of Hungary that are defined in this study _ can be considered as places of segrega- tion on their own. Considering that the more populat- ed settlements are too complex to be treated as places of segregation, only settlements with relatively small population can be delineated with these methods. Ac- cording to the definition of Hungarian Central Statis- tical Office (HCSO) the whole settlement is regarded segregated if it has less than 200 inhabitants, therefore we also determined this limit. All those settlements of the country were subjects of the study where the pop- ulation is below 200. There are 420 such settlements in Hungary based on the data of 1st January 2016. A com- plex indicator system was established containing sev- en indicators originally partly similar to those used by HCSO for delineation of segregated areas. We tried to find indicators from all the fields of social segregation, which are available by settlements.
Our indicators were the following:
1. Educational level: the ratio of the population of the age 7-x whose highest completed level of education is grade 8 of primary school (2011).
2. Proportion of the non-employed within the popu- lation (2011).
3. Comfort level of homes: Proportion of half-com- fort, non-comfort, emergency and other accommo- dations of the housing stock (2011).
4. Unemployment: Ratio of the number of registered job seekers of the inhabitants (2015).
5. Long-term unemployment: Proportion of regis- tered job seekers over 180 days within the residents (2015).
6. Ratio of people receiving regular social assistance in proportion to the population (205).
7. Proportion of the Roma of the inhabitants (2011).
We used the most recent available data for the in- dicators, except those data where annual data is not available. We applied the data of the census of the year 2011 for these indicators. Finally, we worked with six indicators out of the seven. We had to miss out the seventh indicator, the proportion of the Roma, due
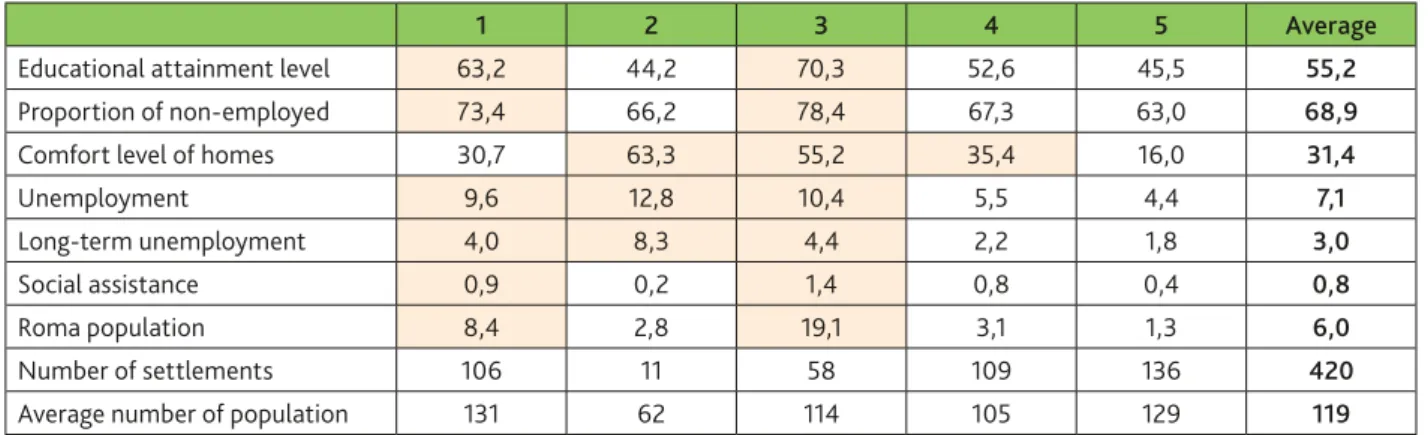
to that values very different from reality occur in the data of the census, because of self-declaration as it was noted several times (Krizsán, 2012; Surdu & Kovats, 2015; Timofey, 2014; Tremlett, 2014). Thus incompre- hensible values were derived from contraction of in- dicators. These six indicators served as the base of the cluster analysis using the K-means algorithm result- ed in five clusters (Table 1). Cluster analyse was an obvious method for treatment of our matrix includ- ing 6*420 elements deriving from our data and for de- velopment of settlements types based on the six fea- tures. This method was used in urban geography by many others, where a large number of elements and data was available. However, the six indicators did not make it necessary to decrease the number of variables by a new mathematical-statistical method.
Almost one quarter of the Hungarian tiny villag- es are in a relatively good situation (cluster 5), with low unemployment, good educational level and good comfort level of houses, while another quarter are in average situation (cluster 4). There are 11 extreme small villages in cluster 2, where the comfort level of the houses is low, and the unemployment rate is high, but the educational level is high and the percentage of people with social assistance is low. They are real- ly mixed because of the small population (average: 62).
The villages of cluster 1 and especially cluster 3 are in the worst social situation.
We can talk about segregation in that case if the values are under the average generally in the settle- ment group. These values are marked by gravy back- ground. This is the situation at cluster 1 and cluster 3 in our case. The settlements that got into cluster 2 have values under the average on the base of some in- dicators having the worst indicators in many cases out of all clusters but their values are above the average re- garding other indicators. This is due primarily to the extremely low population of these settlements, so seg- regation cannot be said in this case. Villages with av- erage values got into cluster 4 and villages with values above the average into cluster 5 in which cases they are clearly not places of segregation.
Results
Settlements of cluster 3 show the worst values regard- ing every indicator out of cluster 1 and 3. While there is a small-scale delay from the average in case of clus- ter 1 settlements of cluster 3 are in a significantly worse status than the average of tiny villages. Thus recently 58 settlements of cluster 3 can be classified as places of segregation however there is a risk of falling of grace into this category in cases of 106 settlement of cluster 1 because of unfavourable processes. In case of cluster
3 mainly data regarding educational attainment lev- el and comfort of homes is lower than the average of tiny villages and indicators of employment are below the average. These settlements show unfavourable pic- ture in every segment of the disadvantage of the socie- ty. There is no_ significant context between the official number of the Roma and values of different indicators on settlement level. However, the proportion of the Roma is almost 20%, the highest in cluster 3 altogeth- Table 1. Basic data of the clusters according to segregation of villages below 200 inhabitants
1 2 3 4 5 Average
Educational attainment level 63,2 44,2 70,3 52,6 45,5 55,2
Proportion of non-employed 73,4 66,2 78,4 67,3 63,0 68,9
Comfort level of homes 30,7 63,3 55,2 35,4 16,0 31,4
Unemployment 9,6 12,8 10,4 5,5 4,4 7,1
Long-term unemployment 4,0 8,3 4,4 2,2 1,8 3,0
Social assistance 0,9 0,2 1,4 0,8 0,4 0,8
Roma population 8,4 2,8 19,1 3,1 1,3 6,0
Number of settlements 106 11 58 109 136 420
Average number of population 131 62 114 105 129 119
* Cluster 1: less favoured tiny villages Cluster 2: extremely small tiny villages Cluster 3: segregated tiny villages Cluster 4: average tiny villages Cluster 5: favoured tiny villages
Source: Own calculations on the base of data of Hungarian Central Statistical Office
Table 2. Distribution of settlements of clusters by counties
Counties Statistical Regions 1 2 3 4 5 Total
Baranya Southern Transdanubia 41 19 15 23 98
Bács-Kiskun Southern Great Plain 2 2
Békés Southern Great Plain 1 1
Borsod-Abaúj-Zemplén Northern Hungary 17 8 13 13 6 57
Fejér Central Transdanubia 1 1
Győr-Moson-Sopron Western Transdanubia 3 2 13 18
Hajdú-Bihar Northern Great Plain 1 1 2
Heves Northern Hungary 1 1
Nógrád Northern Hungary 2 6 5 13
Pest Central Hungary 1 1
Somogy Southern Transdanubia 11 7 12 6 36
Szabolcs-Szatmár-Bereg Northern Great Plain 1 4 2 2 9
Jász-Nagykun-Szolnok Northern Great Plain 1 1
Tolna Southern Transdanubia 1 3 2 2 8
Vas Western Transdanubia 3 16 28 47
Veszprém Central Transdanubia 7 2 10 18 37
Zala Western Transdanubia 15 3 9 31 30 88
Total 106 11 58 109 136 420
* Cluster 1: less favoured tiny villages Cluster 2: extremely small tiny villages Cluster 3: segregated tiny villages Cluster 4: average tiny villages Cluster 5: favoured tiny villages
Source: Own calculations on the base of data of Hungarian Central Statistical Office
er based on the 2011 census. Values of the different in- dicators are average or are a bit under-average in clus- ter 1 regarding especially the educational attainment level and the situation of the national labour market.
Most of the tiny villages can be found in Baran- ya, Zala and Borsod-Abaúj-Zemplén counties and Vas, Somogy, Veszprém follow them (Table 2). There
are about 10-20 tiny villages in Győr-Moson-Sopron, Nógrád, Szabolcs-Szatmár-Bereg and Tolna coun- ties and there are only one or two settlement like this in the other places. Not many settlements like this can be found in Csongrád and Komárom-Esztergom counties.
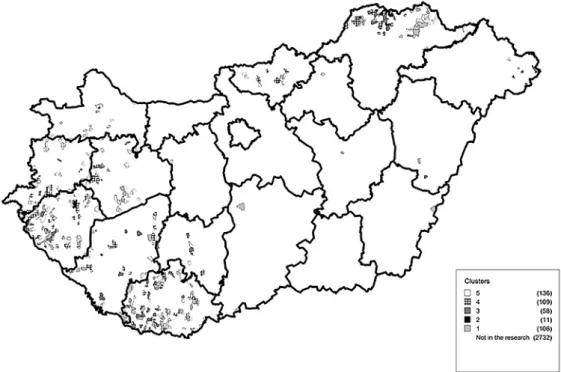
On the other hand, while cluster 4 and 5 are dom- inant in Vas, Győr-Moson-Sopron, Veszprém and Nógrád counties the picture is moderate in Somogy, Tolna and Szabolcs-Szatmár-Bereg counties. Settle- ments of Baranya and Borsod-Abaúj-Zemplén coun- ties are in majority in cluster 1 and 3 (Figure 1). Set- tlements of cluster 3, the cluster of segregated tiny villages can be found in the North, West and South peripheries of Baranya County. Segregated tiny vil- lages are mixed up with cluster 1 in Somogy County and in South-Zala. They can be found independent- ly or mixed with other clusters in the middle of Tol- na, Szatmár and Cserehát. Two regions containing the most elements are Ormánság and the surroundings of Cserehát.
Some of the settlements of cluster 3 have overall the worst indicators that have very bad values com-
pared to the average of this cluster. These villages can be found in Baranya and Borsod-Abaúj-Zemplén pri- marily (5-5 villages) besides these villages the status of two villages in Somogy and the status of one tiny vil- lage in Zala, Szabolcs, Hajdú-Bihar counties are be- yond hope. The villages are scattered in the North, West and South of Baranya County but the majority of the villages of Borsod County can be found in the area of Cserehát. According to our survey Gagybátor, Szakácsi and Abaújszolnok in Borsod County Somog- yaracs in Somogy County, Ág, Gyöngyfa and Dinnye- berki in Baranya County were the settlements having the worst values.
Szakácsi and Abaújszolnok well illustrate the sta- tus of this type of settlement. Szakácsi is not a dead- end village but the road leading out of the village is currently impassable from one direction. The status of the houses is desperate fenestration is missing in many of them. The condition of the newly renovated community house is deteriorating very quickly and there is not any other community institute. Majority of the inhabitants are in the streets however this phe- nomenon cannot be experienced in most of the settle- ments since starting the public-employment program.
The subjective sense of security is very bad in the set- tlement, far worse than in other similar areas of the country (Figure 2).
However, the sharpest contrast can be seen with the neighbouring settlement Irota in a distance of 2 km with about 70 inhabitants. Irota is an ageing set-
Figure 1. Position of settlements of clusters.
* Cluster 1: less favoured tiny villages Cluster 2: extremely small tiny villages Cluster 3: segregated tiny villages Cluster 4: average tiny villages Cluster 5: favoured tiny villages
Source: own edition
tlement and dead-end village but the homes are well- kept. The image of the village is friendly many hous- es were renovated and function as guest houses in the frame of the project ‘Fairy tale village’ (Figure 3).
Physical deterioration can be seen in Abaújszolnok that can be found further on two valleys. The deserted houses are vanished brick by brick. There are 10-15 ru- ined half-destroyed houses and the previous closed vil- lage appearance of the village is broken up (Figure 4).
It was revealed by dividing the settlements into 50-people categories that significant substantive dif- ferences cannot be detected in case of segregation and the category below 200 people is not differentiating further by size. Group of villages with less than 50 in- habitants shows higher value based on the comfort of homes and proportion of people getting social assis- tance for longer than 180 days and this difference is not significant either.
Figure 2. Szakácsi in Borsod-Abaúj-Zemplén County.
Source: index.hu
Figure 3. Guest house in Irota, Borsod-Abaúj-Zemplén County.
Source: szallasinfo.hu
There is some coherence between the situation and development of transport of the settlements but the spatial mosaic is much more complex because settle- ments being in very favourable position are in the pe- riphery as unfavourable in the vicinity of cities. The situation of transport was represented by distance of the nearest cities (Table 3). It was appropriate to sepa- rate the cities by legally and functionally on the base of the known characteristics of the cities. There are some of small cities in the areas of tiny villages that do not or slightly have functions of a city. Such cities are, among others Cigánd, Pálháza, Gönc, Szob, Beled, Jánosháza, Zalalövő, Nagybajom, Gyönk, Sásd, Sellye or Villány although this is not an exhaustive list.
Tiny villages located near this kind of cities cannot take city-level services here. The anomaly of the defi- nition of city building upon the existing central func- tion used in the Hungarian settlement geography is arising here because these tiny cities assure real cen-
tral functions (primary school, notary, chemists, and post office) for the surrounding tiny village area. All of these are basic functions so it means that these cit- ies have central but not city functions.
From the transport point of view the two best clus- ters cluster 4 and 5 are in the best position however sta- tus of cluster 3 that comprises segregated settlements is below the average. Only cluster 2 comprising extremely low inhabitant settlements has lower availability indica- tor than this. Comparing locations of these tiny villag- es to the county seats there is no significant difference among the clusters but it can be stated that practically there are not tiny villages in the vicinity of county seats (Pécs, Kaposvár, Zalaegerszeg, Szombathely, surround- ings of Miskolc) in such counties that are considered as having tiny villages. The population of these settle- ments remained stable in the last few decades and the number of inhabitants of some settlements even start- ed to increase due to suburbanization.
Figure 4. Abaújszolnok in Borsod-Abaúj-Zemplén County.
Source: mapio.net
Table 3. Location of clusters of villages under 200 inhabitants in comparison with the nearest city
1 2 3 4 5 Average
Distance of the nearest city (km) 14,3 24,6 16,0 14,0 12,1 14,0
Distance of the nearest
functional city (km) 20,2 28,7 21,0 18,2 16,1 18,7
Number of settlements 106 11 58 109 136 420
Average number of population 131 62 114 105 129 119
* Cluster 1: less favoured tiny villages Cluster 2: extremely small tiny villages Cluster 3: segregated tiny villages Cluster 4: average tiny villages Cluster 5: favoured tiny villages
Source: own calculation
There are such ten settlements in the country that had lower than 200 inhabitants in 1990 but nowa- days they are out of the range of settlements being surveyed by us due to increase of population. These villages can be divided into three categories. Group around large city (Remeteszőlős, Dozmat, Szil- vásszentmárton) and the touristic not urban type settlements would be classified into the best clus- ter. At the same time half of these villages have got
similar characteristics like cluster 3 thus these set- tlements (Uszka, Felsőregmec, Kiscsécs, Felsőgagy, Bódvalenke) can be regarded as places of segrega- tion. One way of the development of the segregated tiny villages is that they increase the number of in- habitants by natural reproduction and in some cas- es by migration and they get out from the category of tiny villages, forming a segregated settlement with a higher number of population.
Conclusion
There are segregated areas of settlements in the coun- try having complex social-economic problems but their exact delineation in not easy with the data of the avail- able data bases. The segregated areas cover only a small- er part of a settlement meaning one or two streets, on the other hand in case of smaller villages it is also pos- sible that the whole settlement can be regarded as a place of segregation. Such villages mostly can be found among the smallest settlements of the country so our goal was delineation and characterisation of these vil- lages in our study. We refined the indicator system de- fined by HCSO then 58 tiny villages considered as seg-
regated were successfully delineated out of the 420 with the help of the cluster analysis. The labour market posi- tion, status of homes, education attainment level of the population and the social assistance indicators are very unfavourable in these settlements. These settlements can be found mainly in the tiny village peripheral are- as of the country, in the North, West and South periph- erals of Baranya County, in Somogy County, in South- Zala and North-Borsod. On the other hand, in case of location and size of settlements significant context can- not be found. Proportion of Roma population is high in most of the segregated settlements.
References
Agarin, T. (2014). Angels with dirty faces? Europe- an identity, politics of representation and recogni- tion of Romani interests. Ethnicities, 14(6), 849-860.
doi:10.1177/1468796814542186
Allison, P.D. (1978). Measures of Inequality. American Sociological Review, 43(6), 865. doi:10.2307/2094626 Andorka, R. (2003). Bevezetés a szociológiába. Buda-
pest: Osiris Kiadó. 662 pp. (in Hungarian).
Balogh, A. (2002). Centrum-periféria relációk és a marginalizáció. In Határok és az Európai Unió.
Nemzetközi Földrajzi Tudományos Konferencia, Szeged. (pp. 208-214). (in Hungarian).
Balogh, A. (2008). Az aprófalvas településállomány dif- ferenciálódási folyamatai Magyarországon. (p. 110).
Szombathely: Savaria University Press. (in Hungar- ian).
Baranyi, B.G., Fekete, É., & Koncz, G. (2003). A ro- ma-szegregáció kutatásának területi szempontjai a halmozottan hátrányos helyzetű encsi és a sellyei- siklósi kistérségekben. Kisebbségkutatás, 2, 103-125.
(in Hungarian).
Berényi, I. (1997). A szociálgeográfia értelmezése. (p.
135). Budapest: ELTE Eötvös Kiadó. (in Hungarian).
Boros, J. (2011). A települési szegregáció feltételezett okai és következményei. Acta Sociologica, 1, 97-112.
(in Hungarian).
Csalog, Z. (1984). A cigánykérdés Magyarországon 1980 előtt. Magyar Füzetek, 14-15, 93-137. (in Hun- garian).
Cséfalvay, Z. (1994). A modern társadalomföldrajz kézikönyve. (p. 366). Budapest: IKVA. (in Hungar- ian).
Duncan, O.D., & Duncan, B. (1955). A Methodologi- cal Analysis of Segregation Indexes. American Soci- ological Review, 20(2), 210. doi:10.2307/2088328 Enyedi, G. (1980). Falvaink sorsa. (p. 185). Budapest:
Magvető Kiadó. (in Hungarian).
Farwick, A. (2009). Segregation und Eingliederung.
Zum Einfluss der räumlichen Konzentration von Zuwanderern auf den Eingliederungsprozess. (p.
338). Wiesbaden: VS Verlag für Sozialwissenschaf- ten. (in German).
Fekete, G.É. (2005). Cigányok a Cserehát-Hernád- Bódva vidéken: Tájegységi elemzés. In B. Baranyi (Ed.), Roma szegregációs folyamatok a csereháti és a dél-baranyai kistérségekben. (pp. 53-83). Budapest:
Gondolat/MTA Etnikai-nemzeti Kisebbségkutató Intézet. (in Hungarian).
Giddens, A. (1984). The Constitution of Society. Out- line of the Theory of Structuration. (p. 402). Berkeley - Los Angeles: University of California Press.
Illés, I. (2009). Területfejlesztés Magyarországon a 20.
században. (p. 180). Miskolci Egyetemi Kiadó. (in Hungarian).
Kadét, E., & Varró, G. (2010). A roma lakosság hozzáfé- rése az uniós fejlesztési forrásokhoz Szabolcs-Szat- már-Bereg és Borsod-Abaúj-Zemplén megyében.
Budapest. (in Hungarian).
Kemény, I., Janky, B., & Lengyel, G. (2004). A mag- yarországi cigányság: 1971-2003. (p. 192). Budapest:
Gondolat Kiadó. (in Hungarian).
Kertesi, G., & Kézdi, G. (1998). A cigány népesség Mag- yarországon. Budapest: Socio-Typo.
Kocsis, K., & Kovács, Z. (1999). A cigány népesség társadalomföldrajza. In F. Glatz (Ed.), A cigányok Magyarországon. (pp. 163-204). Budapest: MTA. (in Hungarian).
Kolosi, T. (2000). A terhes babapiskóta. (p. 238). Buda- pest: Osiris Kiadó. (in Hungarian).
Kopasz, M. (2004). Lakóhelyi szegregáció és társadal- mi feszültségek a magyarországi településeken. Tár- sadalmi riport. (pp. 414-424). (in Hungarian).
Klicek, S., & Loncar, J. (2016). Analysis of migration trends and functions of areas inhabited by Roma:
Example of Medjimurje county (Croatia) and the settlement of Kursanec. Geographica Pannoni- ca, 20(4), 227-241. doi:10.5937/geopan1604227k Krizsán, A. (2012). Group self-determination, individ-
ual rights, or social inclusion? Competing frames for ethnic counting in Hungary. Ethnic and Racial Studies, 35(8), 1392-1408. doi:10.1080/01419870.2011.
607501
Ladányi, J., & Szelényi, I. (1997). Szuburbanizáció és gettósodás. Szociális, etnikai és térszerkezeti vál- tozások az ezredforduló Magyarországán és Buda- pestjén. Kritika, 7, 4-12. (in Hungarian).
Ladányi, J., & Szelényi, I. (2004). A kirekesztettség vál- tozó formái. Közép- és délkelet-európai romák tör- ténetei és összehasonlító szociológiai vizsgálata. (p.
189). Budapest: Napvilág Kiadó. (in Hungarian).
Ladányi, J., & Virág, T. (2009). A szociális és etni- kai alapú lakóhelyi szegregáció változó formái Magyarországon a piacgazdaság átmeneti időszakában. Kritika, 8-9, 2-8. (in Hungarian).
Lennert, J., Kovács, A.D., Farkas, J.Z., & Bódi, F. . Lakóhelyi szegregáció a dél-alföldi mezővárosokban. Esély, 6, 3-19. (in Hungarian).
Liberson, S. (1963). Ethnic patterns in American cities.
New York: Free Press of Glencoe. 230 pp.
Mező, B. (2013). Párhuzamos társadalmak - Sze- gregációs és integrációs folyamatok Hajdúböszörmé- nyben. University of Debrecen. PhD thesis, 152 pp.
(in Hungarian with English summary).
Milankovic, J., Ivkov-Dzigurski, A., Djukicin, S., Ivanovic, B., Lukic, T., & Kalkan, K. (2015). Atti- tudes of school teachers about Roma inclusion in education, a case study of Vojvodina, Serbia. Geo- graphica Pannonica, 19(3), 122-129. doi:10.5937/geo- pan1503122m
Rácz, A. (2012). Szegregáció a fejekben. A statiszti- kai és a mentális társadalmi és térbeli elkülönülés vizsgálata Szegeden. Corvinus University of Buda- pest. PhD thesis, 133 pp. (in Hungarian with Eng- lish summary).
Schönwalder, K. (2007). Residential segregation and the integration of immigrants: Britain, the Nether- lands and Sweden. WZB Discussion Paper, Nr. SP IV 602.
Siptár, D., & Tésits, R. (2014). A szegénységi sze- gregáció területi jellegzetességei Baranya megyé- ben. Human Innovation Review, 1-2, 139-162. (in Hungarian).
Steinnes, D.N. (1977). Urban Employment And Residential Segregation: A Conditional In- dex. Journal of Regional Science, 17(2), 291-298.
doi:10.1111/j.1467-9787.1977.tb00499.x
Surdu, M., & Kovats, M. (2015). Roma Identity as an Expert-Political Construction. Social Inclusion, 3(5), 5. doi:10.17645/si.v3i5.245
Taubner, K.E., & Taubner, A.F. (1965). Negroes in cities:
Residential segregation and neighborhood change.
Chicago: Aldine Publisching. 284 pp.
Tremlett, A. (2014). Making a difference without creat- ing a difference: Super-diversity as a new direction for research on Roma minorities. Ethnicities, 14(6), 830-848. doi:10.1177/1468796814542183
Virág, T. (2005). Az etnikai szegregáció változatai. In B. Baranyi (Ed.), Roma szegregációs folyamatok a csereháti és a dél-baranyai kistérségekben. (pp. 84- 132). Budapest: Gondolat/MTA Etnikai-nemzeti Kisebbségkutató Intézet. (in Hungarian).
http://index.hu/belfold/2013/10/25/szakacsi/ • (16.01.2018).
http://mapio.net/a/95532884/ (16.01.2018).
http://szallaskereso.info/szallas-irota/talentum-falu- si-udulo (16.01.2018).