DOI: 10.32565/aarms.2019.1.6
Public Sector Innovation in Europe
1Csaba MAKÓ,
2Miklós ILLÉSSY,
3András BORBÉLY
4In the recent decades there is a growing interest in how public and private organisations can develop abilities to innovate in order to cope with the challenges created by the changing priorities of the political market, the intensification of global competition and the higher speed of the technological changes. The ability of organisations to mobilize their internal resources into efficient and dynamic routines depends on intangible resources (e.g. creativity) and less on such traditional tangible factors as physical or financial sources. The core aim of the paper is to identify and compare the creative/learning capabilities of the workplaces in the EU–27 countries. The data of the European Working Conditions Surveys (2005, 2010 and 2015) shows that public administration boosts creative workplaces in all countries. The increasing rate of creative jobs may speed up the implementation of the “High-Engagement Civil Services”.
Keywords: innovation, private/public sector, work organisation, creativity, country cluster
Introduction: The Role of Innovation in the Employment Growth and in the Organisational Performance
There is a growing consent between the practitioners and academics on the importance of non-technological (e.g. workplace development programmes, etc.) innovations in generating sustainable competitiveness of the national economies and in opening a new road for both economic and social development. Systematically collected experiences on the diffusion of various types of innovation indicate that—in the long run—the higher employment rate is one of the visible outcomes. [1] The World Bank’s research institute carried out the most comprehensive and methodologically well-founded research on the employment impacts of innovative or non-innovative firms. The survey covered 26,000 firms in 71 countries.
According to their results, innovative firms generate significantly greater employment
1 This work was created in commission of the National University of Public Service under the priority project PACSDOP-2.1.2-CCHOP-15-2016-00001 entitled “Public Service Development Establishing Good Governance” in the “Innovative – Learning Public Administration – Ludovika Research Centre of Excellence”.
2 Prof. Em., Dr. (DSc), National University of Public Service, Szent István University; e-mail: mako.csaba@
tk.mta.hu; ORCID ID: 0000-0002-2597-3103
3 Research Fellow, Hungarian Academy of Sciences, Centre for Social Sciences, Institute for Sociology;
e-mail: illessy.miklos@tk.mta.hu; ORCID ID: 0000-0002-0241-0287
4 Ph.D. student, Szent István University, Doctoral School of Management and Business Administration;
e-mail: andras.borbely1989@gmail.com; ORCID ID: 0000-0002-9853-577X
growth and this growth is much more inclusive than previously expected. [2] In addition, according to the recent review of some sixty American papers on workplace innovation indicates that the efficiency effects of workplace innovation on performance premiums range between 15% and 30%. [3] Looking at the European experiences, according to the Finnish workplace development programmes (2004–2010) “…active employee and middle management participation in planning and implementation phase of the project, close internal collaboration during the process, competence in project work, methods used by external experts, and external networking were related to simultaneous improvements in productivity and the Quality of Working Life (QWL) at workplaces. […] Direct participation of employees can function as a ‘change agent’.” [4: 41]
In spite of favourable performance outcomes of the workplace innovation, the mainstream innovation streams are stressing the importance of the technological (i.e. product and process) innovations and are neglecting the roles of such non-technological innovations as new models of work organisations, new working and employment practices, new business models and marketing methods, etc. For example, according to such emblematic figure of the so-called open innovation system as Chesbrough: “There is no inherent value in a technology per se. The value is determined by the business model used to bring it to market. The same technology taken to the market through two different business models will yield different amounts of values. An inferior technology with better business model will often trump a better technology commercialized through inferior business model.” [5: 14] However, the European innovation policy landscape is still dominated by a technological focus, despite the undeniable but rather slow transition to a more holistic approach.
The so-called Dortmund/Brussels Position Paper elaborated by the European Network for Workplace Innovation (EUWIN) and other experts of non-technological innovation stress that although social innovation is a pre-condition for the successful implementation of new technologies, it cannot be implemented successfully without the necessary organisational adjustments and innovations, if the share of the organisation investing in workplace innovation is low. Stakeholders and decision-makers often lack the adequate information and knowledge resources, and consequently they are rarely aware of the importance of workplace innovation. Organisational and workplace innovations represent a hidden resource for the whole Europe to become more competitive, especially in South and Eastern Europe. [6]
In these countries “…perception of work may be classified as an individual one. This notion has a focus on the quality of a single workplace, its individual skill requirements and individual employment condition protection. The collaborative character and its implications in the ‘Nordic debate’ which are meant in the notion of ‘new forms of work organisation’ are badly understood.” [7: 412]
Beside the visible inequalities in the share of workplace innovation investment within the country groups of the European Union (i.e. the highest investment in the Nordic countries and the lowest one in the Mediterranean and Central and Eastern European countries), both theoretical experts and practitioners often underestimate the important role of the social (collective) and organisational learning necessary for the successful implementation of the innovations—especially in case of their radical forms.
For example, the potentials of the use of such generic or integrative technologies as the Information and Communication Technology (ICT) are un-exploited or under-utilised due to these shortcomings. In this relation it is worth quoting Lundvall, [8: 2–3] who stressed
that “…firms that introduced ICT without combining it with investments in the training of employees, with change in management and with work organisation got a negative effect on productivity growth that lasted several years. […] What is at stake is the capacity of people, organisations, networks and regions to learn. Learning to cope with the full potential of the new technologies is, in a sense, to transform them from being new to being old.” In addition to the Lundvall insistence on the key role of learning absorbing new technologies (i.e. ICT), we have to add the growing importance of the combination of technical and social competencies. There are “…more and more voices suggesting that the digital economies will also require the collaboration of the ‘Techies’ with humanities majors, the so-called ‘Fuzzies’
in order to complement their understanding of the social challenges and creativity among other elements.” [9: 1] In this relation it is worth noting that “…the better competence of US firms in utilisation of ICTs explains as much as 50 per cent of the differences in growth in productivity between Europe and the US.” [10: 39]
The paper is structured as follows. Following the introduction on the importance of the interplay between technological and social innovations, the first section briefly outlines the theoretical and methodological foundations in the public sector innovation research.
The second section describes the methods on how to measure the creativity of work. The third section is dealing with the empirical analysis of the various waves of the European Working Conditions Survey (EWCS 2005, 2010 and 2015) aimed to identify types of work shaping innovativeness of the organisations—with special focus on public administration. Finally, the concluding section summarizes the analysis.
Innovation in the Public Sector: Theoretical and Methodological Foundations
After World War II, until the end of the 1970s, the mainstream international innovation surveys have been focusing and collecting data on Research and Development (R&D) activities in the private sector. These analyses were able to describe the innovation potential of mainly manufacturing (and other industrial) firms operating in the private sector, while the innovation activity of the service sector and in particular the organisations of the public administration were omitted. The report of the expert group of the European Commission indicated “…that public sector innovation today mostly happens through uncoordinated initiatives rather than as a result of deliberate, strategic efforts. The quest for more and better public sector innovation is hindered by several barriers, which fall into four major categories: weak enabling factors or unfavourable framework conditions, lack of innovation leadership at all levels, limited knowledge and application of innovation processes and methods, and insufficiently precise and systematic use of measurement and data.” [11: 5]
Following a more than a decade-long preparation, the OECD did initiate pilot studies on the innovation—in private and manufacturing sectors—in the Nordic countries. The lessons from these surveys were summarized in the Oslo Manual (1992). This manual served as a theoretical and methodological guideline for the various waves of the Community Innovation Surveys (CIS) which were carried out by the National Statistical Offices (NSO) within the European Union. The first edition of the Oslo Manual essentially aimed to measure or map not only the R&D activities in their strict sense but the diffusion of technological
(product + process) innovation, as well. In this relation it is worth mentioning that the original questionnaire elaborated in the first edition of the manual and used in the following surveys was not able to measure the innovation in the fast growing service sector. The modified version of the questionnaire published in the second edition of the Oslo Manual (1997) is suitable to measure innovation in both the manufacturing and service sector. However, only the third edition of this Manual (2005) covers such types of non-technological innovations as marketing or new business and organisational practices. According to this Manual:
“…innovation represents a new or significantly developed product (services) or process, new marketing methods, or the implementation of the new management-organisational methods in the business or workplace practices and in the external relations of the organisation.” [12: 494]
There is a rather new research agenda having the ambition to compare and identify the similarities and differences of organisational innovation characterising the private and the public sectors. Following Hollanders et al., [13] Table 1 compares the characteristics of the innovation in the private and the public sectors. The table indicates well both the similarities and differences of innovation activities in the two sectors. For example, similarities are dominating in the fields of process and organisational innovation. However, service innovation instead of product innovation and communication innovation instead of market innovation characterise the public sector in comparison with the private one.
In the innovation management literature, the following definition of service innovation is used widely: “Service innovation is a new service or such a renewal of an existing service which is put into practice and which provides benefit to the organisation that has developed it: the benefit usually derives from the added value that the renewal provides the customers. […] A service innovation process is the process through which the renewals described are achieved.” [14: 4]
Table 1. Differences between the private and public sector innovation. (EPSIS [13])
Private sector Public sector
Product innovation Service innovation
Process innovation Process innovation
Organisational innovation Organisational innovation Marketing innovation Communication innovation
Before presenting the methods used to identify the creative or innovative potentials of the European workplaces, it is necessary to briefly outline the main features of the systematic theoretical framework. We adopted a broad-based innovation policy approach elaborated by Ramstad [15] and called “expanded triple helix as an innovation generating policy model”.
This model goes beyond the traditional national innovation approach in the following fields.
It stresses the importance of the “social innovation”, focusing besides public players to other organisations, in addition to inter-organisational relations, the internal development of the organisation has decisive roles in innovations, and finally this approach stresses that changes are not located at one level (e.g. at the top or bottom) but “…changes on different levels are interrelated. Without knowledge about the micro-structures we might get little out of attempts to change institutions and organisations at the meso- and macro-levels.” [15: 2]
In a recent study of the European Centre for the Development of Vocational Training (Cedefop) [16] the authors tried to combine the different levels of data. Three aspects of intellectual capital were identified and considered as determinants of a firm’s innovative ability: human capital, structural capital and relational capital. Human capital covers individual knowledge, skills and competencies of the members of an organisation. Structural capital is defined as the “organisational and technological structures and processes allowing the sustained operation and innovation of the organisation.” [16: 22] Relational capital includes all relations through which an organisation is linked to its environment.
It is essentially important in capturing relevant information from stakeholders, customers, suppliers, associations, etc. The authors conceptualized the three fields of intellectual capital in the following way (see Table 2):
Table 2. Human, structural and relational capital as determinants of innovative ability. [16: 23]
Intellectual capital
Human capital Structural capital Relational capital Domain related knowledge, skills
and competences Organisational culture Relations to customers Practical experience Cooperation and communication
within the organisation Relations to suppliers Social skills and competences Equipment relating to information
technology, software and other
technological systems Relations to investors/shareholders Motivation Knowledge transfer and storage External cooperation with
educational institutions Leadership skills R&D infrastructure for product
innovation External knowledge acquisition Personal skills and competences R&D infrastructure for process
innovation Social engagement/Corporate social responsibility
Continuous vocational training Organisational structure Image of company/brand Initial vocational education and
training Organisational processes Engagements in associations and public relations
Continuing higher education Use of modern ICT School and higher education Learning-intensive forms of
organisation
Methodology: How Can We Measure Creative and Innovative Capability at the Workplace?
In testing empirically the various types of work, our analysis uses the datasets of the 4th (2005), 5th (2010) and 6th (2015) wave of the European Working Conditions Surveys (EWCS).5 The methods used are based on the work of Lorenz and Lundvall, [18] who
5 EWCS is a cross-sectional survey taken in every five years since 1990, organised by the European Foundation for the Improvement of Living and Working Conditions (Eurofound, Dublin). The recent waves of this survey cover more than 40,000 workers in the EU member states and in various other European countries. [17]
analysed the fourth wave of the European Working Conditions Survey and distinguished three types of employees according to the dimensions of cognitive demands of work and employees’ autonomy. These three groups are “creative workers”, “constrained problem solvers” and “Taylorised workers”. The methodological background of these groups will be presented later in detail at the end of this section and at the beginning of the next section.
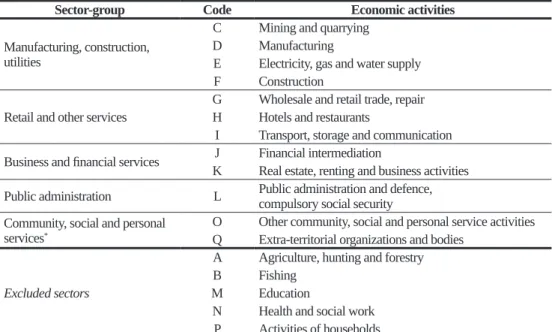
In our study, we focus on salaried employees working in organizations with at least 10 employees in non-agricultural sectors as industry, service and public administration, excluding education; health and social work; household activities; as well as agriculture and fishing.6 The sample examined consists of 11,661 salaried employees in case of the 4th wave (2005), 14,192 in the 5th wave (2010), and 14,425 in case of the 6th wave (2015).
Not only the sampling procedure, but also our method to group the sectors of the statistical nomenclature is consistent with Lorenz and Lundvall’s work. [18] (See our groups in Table 3 below.)
Table 3. Summary table of NACE sectors, codes and the sector groups used in the paper.
(Own compilation following the work of Lorenz and Lundvall. [18])
Sector-group Code Economic activities
Manufacturing, construction, utilities
C Mining and quarrying D Manufacturing
E Electricity, gas and water supply F Construction
Retail and other services
G Wholesale and retail trade, repair H Hotels and restaurants
I Transport, storage and communication Business and financial services J Financial intermediation
K Real estate, renting and business activities Public administration L Public administration and defence,
compulsory social security Community, social and personal
services* O Other community, social and personal service activities Q Extra-territorial organizations and bodies
Excluded sectors
A Agriculture, hunting and forestry
B Fishing
M Education
N Health and social work P Activities of households
Legend: *We did not indicate the “Community, social and personal services” group in our sector level tables, however, we included it in the aggregate results.
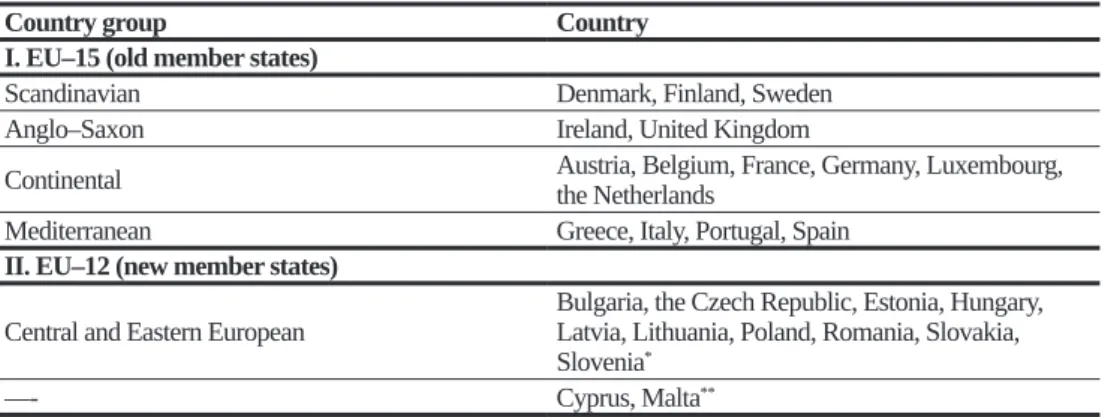
In order to identify the main differences between EU countries, we distinguished five country groups on the basis of their institutional settings (i.e. welfare system, labour market regulation, labour relation issues etc.). Our typology is analogous to country groupings
6 EWCS uses the NACE (Nomenclature Statistique des Activités Économiques dans la Communauté
Européenne) industry standard classification system (its Hungarian equivalent is the TEÁOR system). In order to achieve data interoperability, we used the NACE 1.1 version.
used in comprehensive institutional studies (e.g. Hall and Soskice’s work, [19]) as well as organizational studies using the same database. [20] [21] [22] In this perspective, we distinguished “Scandinavian”, “Anglo–Saxon”, “Continental”, “Mediterranean” and
“Central and Eastern European (CEE)” country clusters. (See Table 4.) In order to elaborate unbiased results, all tables presented in this study incorporate cross-national weighted data.
Table 4. Summary table of countries and country groups used in the paper.
(Own compilation following several recent studies. [19] [20] [21] [22])
Country group Country
I. EU–15 (old member states)
Scandinavian Denmark, Finland, Sweden
Anglo–Saxon Ireland, United Kingdom
Continental Austria, Belgium, France, Germany, Luxembourg, the Netherlands
Mediterranean Greece, Italy, Portugal, Spain
II. EU–12 (new member states)
Central and Eastern European Bulgaria, the Czech Republic, Estonia, Hungary, Latvia, Lithuania, Poland, Romania, Slovakia, Slovenia*
––- Cyprus, Malta**
Legend: *Croatia was excluded from our analysis. **Countries of Cyprus and Malta were not assigned to any of the country groups; however, we included them in the EU–27 aggregates.
Not only the sampling procedure but also the choice of variables and methods of analysis for this study is consistent with the approach of Lorenz and Lundvall. [18] In order to characterize the main attributes of a creative workplace, we used the following six binary variables:
1. a variable measuring whether the work requires problem solving [PBSOLV];
2. a variable measuring whether one’s able to learn new things from work [LEARN];
3. a variable measuring the presence of complex task in one’s work [COMPLX];
4. a variable measuring the use of individual’s own ideas at work [IDEAS];7
5. a variable indicating the presence of autonomy in choosing the working methods [AUTMET];
6. a variable indicating autonomy in choosing the order of tasks [AUTORD].
The type of the factor method which was carried out on these variables is Multiple Correspondence Analysis (MCA). Further analyses were elaborated on two factors which contributed together to 58% of the inertia in case of EWCS 2005, 60% of the inertia in case of EWCS 2010, and 59% of the inertia in case of EWCS 2015. In order to group the cases, hierarchical clustering (Ward’s method) was carried out on the basis of the factor scores on each sample.
7 A binary variable transformed from a five-level ordinal scale, as follows: “always”, “most of the time”
(“almost always” and “often” in EWCS 2005) answers were recoded into “yes”; “sometimes”, “rarely”, and
“never” (“sometimes”, “rarely”, “almost never” in EWCS 2005) were recoded into “no”.
This paper, however, uses Lorenz and Lundvall’s work [18] only as a theoretical and methodological starting point, and it differs from it in several ways. First, we included data from the fifth and sixth wave of EWCS (2010 and 2015). This allowed us to enlarge the scope of the analysis with the comparison of periods before and after the recent financial (2008) crisis. Second, our paper widens the limits of their study by evaluating the differences between each European country group, and including the public administration sector into the analysis. In the current phase of our research, we intend to introduce several results of descriptive analyses8 on the basis of the results of the abovementioned more sophisticated statistical tools.
Creative Jobs in the European Union: Sharp Contrast along the North–West and South–East Axis
Before presenting the distribution of different job clusters and later their changes over time, it is worth describing shortly the characteristics of these clusters. As we can see from Table 5 below, variables used to measure both the cognitive and the autonomy dimensions of work show relative stability in the three waives of the European Working Conditions Survey carried out between 2005 and 2015. The creative cluster can be characterised by an overrepresentation in all six variables: they mobilise extensively their cognitive abilities during the employees’ work and they enjoy high level of autonomy in doing so. Around half of the European employees belong to this category of workers. The constrained problem solver jobs show high degree of problem-solving and learning activities, their working tasks are rather complex, but—surprisingly enough—they rarely use their own ideas during work. Similarly, the level of autonomy in choosing the methods of work and the order of tasks is far the lowest compared to other employees. They account for nearly one quarter of the employees. The group of Taylorist workers can be characterised by the lowest level of problem solving and learning activities, they execute relatively simple tasks. In contrast, their autonomy is significantly higher than those belonging to the category of constrained problem solvers, although it is far below the average of creative employees: from one fourth to one third of employees belong to this job category.
Table 5. Distribution of work organisation variables across job clusters, EU–27.
(Following Lorenz and Lundvall’s choice of variables, [18]
own calculations based on EWCS 2005, 2010, 2015.)
Variable 2005 2010 2015
CW CP TW AV CW CP TW AV CW CP TW AV
PBSOLV 97 87 40 80 97 91 45 81 97 92 44 83
LEARN 91 85 16 70 92 85 14 69 93 87 14 72
COMPLX 84 82 8 64 85 78 7 62 86 77 7 64
IDEAS 76 22 29 51 71 16 25 46 70 16 25 46
AUTMET 94 22 37 62 94 16 38 60 94 18 41 63
8 For the sake of transparency, the tables and figures presented in this paper incorporate results without decimals (i.e. due to rounding, not all results add up to 100).
Variable 2005 2010 2015
CW CP TW AV CW CP TW AV CW CP TW AV
AUTORD 91 14 34 58 94 17 37 60 93 19 38 62
Total share 50 24 26 100 49 24 27 100 52 24 24 100
Legend: CW = creative workers; CP = constrained problem solvers; TW = Taylorised workers;
AV = average; PBSOLV = solves problems during work; LEARN = learns new things in work;
COMPLX = solves complex tasks; IDEAS = able to use own ideas; AUTMET = able to choose work methods; AUTORD = able to choose the order of tasks
Creative jobs are especially prevalent in such sectors as research and development;
other computer related activities; electricity, gas, steam and hot water supply; insurance, reinsurance and pension funding; financial intermediation. Constrained problem solvers are typically working in such sectors as land transport and transport via pipelines; manufacture of textiles; manufacture of motor vehicles; manufacture of chemicals and chemical products and manufacture of basic metals. Taylorised workers are most prevalent in sewerage;
manufacture of textiles; manufacture of wearing apparel; land transport and transport via pipelines; postal and courier activities.
Creativity and Autonomy of Employees in the European Union:
Polarisation of Work Organisation from North-West to South-East
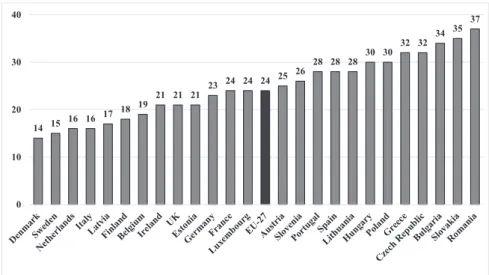
As we can see from the table above, undoubtedly the creative job cluster gives the biggest opportunity for the employees to work autonomously and to deploy their creativity. It is not at all surprising that the Scandinavian countries are those where these kinds of jobs dominate the most. (See Figure 1.) In Denmark 77% of all jobs investigated are creative, whereas the same ratio is 74% in Sweden and 73% in Finland. In addition to these countries, we find above the European average presence of creative workplaces in such Continental countries like Luxembourg (65%), the Netherlands (63%), France (62%), Belgium (59%) and Austria (57%), together with the two Anglo–Saxon countries: the UK (59%) and Ireland (55%). It is interesting to see that while all Mediterranean countries are below the European average (52%), two former socialist countries, namely Estonia (62%) and Slovenia (55%) have a share of creative jobs above the average. The position of Germany is also surprising: creative work organisations are less widespread in Europe’s biggest economy than the EU–27 average and exceeds Spain by only two percentage points. Besides Germany we find only Mediterranean and Central and Eastern European countries below the EU–27 average, with Greece, Latvia, Slovakia, Romania and Hungary being the last five countries where creative jobs are the least widespread.
28 35 35 35 37 38 38 41 41 45 45 47 49 52 55 55 57 59 59 62 62 63 65
73 74 77
0 20 40 60 80 100
Figure 1. The share of creative jobs in the European Union (2015).
[Own compilation based on EWCS 2015.]
The jobs of Taylorised workers can be characterised by a low level of both creativity and employee autonomy. The next figure, illustrating the share of these jobs in Europe, is almost the inverse version of the previous one presenting the share of creative jobs. (See Figure 2.) This means that in most of the cases, in a country where creative jobs are more widespread we will find the least Taylorised workers. This is true, for example, for the Scandinavian and for the Central and Eastern European (CEE) countries: Denmark, Finland and Sweden are leader countries in terms of creative jobs and are lagging behind all other countries when it comes to Taylorised workers. In contrast, creative jobs are less prevalent in the CEE countries while we found the highest shares of Taylorised ones in this region.
9 9 11 11
14 18 19 19 20 21 21 24 24 25 27 28 28 29 29 30 31 31 33 38 40
48
0 20 40 60
Figure 2. The share of Taylorised workers in the European Union (2015).
[Own compilation based on EWCS 2015.]
However, there are notable exceptions as well. It is surprising that almost one third of the German workplaces (29%) belongs to the Taylorised cluster and this is the 9th biggest share among the EU–27 countries. Italy is middle-ranked among the European countries in the share of creative jobs, but it is one of the most Taylorised countries with 38% of jobs being Taylorised. All in all, four countries have a significantly higher share of Taylorised jobs than the EU–27 average: Latvia (48%), Greece (40%), Italy (38%) and Hungary (33%).
They are followed by Slovakia, Portugal, the Czech Republic, Poland, Germany, Romania, Bulgaria and Lithuania (27–31%). Spain and Ireland are around the EU–27 average (25%
and 24%, respectively). The Netherlands, Belgium, the UK, Slovenia, Austria and Estonia are the countries where the share of Taylorist jobs is visibly below the average (18–21%), while we find the lightest presence of this type of work organisation in Denmark (9%), Finland (9%), Sweden (11%), Luxembourg (11%) and France (14%).
Constrained problem solvers are those employees whose jobs demand a relatively high level of cognitive capacities during the work but allow the lowest level of employee autonomy at the same time. Given the fact that creative jobs represent around three quarter of all jobs in the Scandinavian countries, it is not at all surprising that the share of both Taylorised employees and constrained problem solvers is among the lowest in Denmark, Sweden and Finland. (See Figure 3.) Their share is similarly low in the Netherlands, Italy, Latvia, Belgium, Ireland, the UK and Estonia (between 16–21%). The EU–27 average is 24% and we find eight countries very close to this rate: Germany, France, Luxembourg, Austria, Slovenia, Portugal, Spain and Lithuania (23–28%). The highest share of constrained problem solvers can be found in CEE countries, namely in Hungary, Poland, the Czech Republic, Bulgaria, Slovakia and Romania (30–37%), together with Greece (32%), the only representative of Mediterranean countries in this group of countries with the highest share of constrained problem solvers.
14 15 16 16 17 18 19
21 21 21 23 24 24 24 25 26
28 28 28 30 30 32 32 34 35 37
0 10 20 30 40
Figure 3. The share of constrained problem solvers in the European Union (2015).
[Own compilation based on EWCS 2015.]
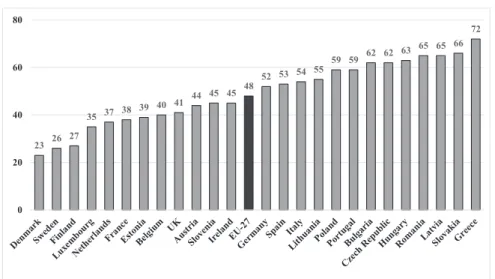
If we add the share of constrained problem solvers to the share of Taylorist workers, it gives a good proxy indicator on those employees who enjoy less autonomy in their work. It is even more important because the lack of participative employee involvement sets serious limits to any kind of creativity having long-term impact on innovation. It is obvious that employees are important sources of innovation, their active participation in the implementation is a necessary precondition of any innovation: “The basic idea of Employee-Driven Innovation rests on the assumption that employees have hidden abilities for innovation, and that this potential can be made visible, recognised and exploited to the benefit of both the firm and its employees.” [23: 66]
23 26 27
35 37 38 39 40 41 44 45 45 48 52 53 54 55 59 59 62 62 63 65 65 66 72
0 20 40 60 80
Figure 4. The share of constrained problem solvers and Taylorist workers in Europe (2015).
[Own compilation based on EWCS 2015.]
As we can see from Figure 4 above, the three Scandinavian countries are visibly separated from the rest of Europe, the share of the two least autonomous job clusters is around 25%.
The follower country group is composed by Luxembourg, the Netherlands, France, Estonia, Belgium, the UK, Austria, Ireland and Slovenia (35–45%). These countries are below the European average (48%). It is interesting to note that we do not find any Mediterranean country and only two CEE countries below the average: Estonia and Slovenia. These two country groups are overrepresented at the low end of the scale: more than every second job has limited level of employee autonomy in Spain, Italy and Lithuania. Their share is about 59–66% in Portugal, Poland, Bulgaria, the Czech Republic, Hungary, Latvia, Romania and Slovakia. The situation is the worst in Greece where the same ratio is 72%. This means that these countries have the lowest potential to develop innovative capabilities of employees and their work organisations.
Work Organisation in the Old Member States:
Significant Differences between and within Country Groups
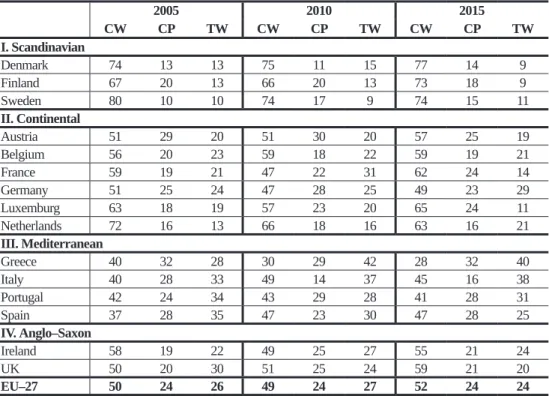
The share of different employee groups varies greatly between countries. In the Old Member States (OMS), creative workers dominate in the Scandinavian country group: in Sweden, for example, four out of five employees had a creative job at the beginning of the period investigated (2005) and this ratio fell to 74% in ten years (see Table 6). In 2015, we found the highest share of creative jobs in Denmark (77%) with a slight increase between 2005 and 2015. Finland experienced a significant catch-up period: the share of creative jobs increased from 67% to 73%. The share of Taylorist jobs increased a bit in the first five years, but after that, it dropped back to its original ratio. Constrained problem solvers are the second most populous job cluster in this country group representing 14–18% of employees.
Table 6. Distribution of job clusters in the Old Member States.
[Own calculations based on EWCS 2005, 2010, 2015.]
2005 2010 2015
CW CP TW CW CP TW CW CP TW
I. Scandinavian
Denmark 74 13 13 75 11 15 77 14 9
Finland 67 20 13 66 20 13 73 18 9
Sweden 80 10 10 74 17 9 74 15 11
II. Continental
Austria 51 29 20 51 30 20 57 25 19
Belgium 56 20 23 59 18 22 59 19 21
France 59 19 21 47 22 31 62 24 14
Germany 51 25 24 47 28 25 49 23 29
Luxemburg 63 18 19 57 23 20 65 24 11
Netherlands 72 16 13 66 18 16 63 16 21
III. Mediterranean
Greece 40 32 28 30 29 42 28 32 40
Italy 40 28 33 49 14 37 45 16 38
Portugal 42 24 34 43 29 28 41 28 31
Spain 37 28 35 47 23 30 47 28 25
IV. Anglo–Saxon
Ireland 58 19 22 49 25 27 55 21 24
UK 50 20 30 51 25 24 59 21 20
EU–27 50 24 26 49 24 27 52 24 24
Legend: CW = creative workers; CP = constrained problem solvers; TW = Taylorised workers In the majority of the Continental countries, the share of creative jobs increased between 2005 and 2015, with the notable exceptions of Germany and the Netherlands. However, we can see a dramatic decrease between 2005 and 2010 in France and Luxembourg, too, with a remarkable recovery experienced during the following five years. The case of the Netherlands is exceptional as it shows a continuous decrease in the share of creative jobs from 2005 to 2010 and further to 2015. In fact, it started from the level of the Scandinavian
countries in 2005, whilst by 2015 it nearly touched the Continental country group average which is significantly lower. The share of constrained problem solvers decreased only in Austria, it remained the same in Belgium, Germany and the Netherlands, while it increased significantly in France and in Luxemburg. As concerning the Taylorist workers, their share did not change in Austria and Belgium between 2005 and 2015, it decreased to a notable extent in Luxemburg, while it increased radically in Germany and the Netherlands. The case of France is particularly interesting as radically opposite trends were observable between 2005 and 2010, and between 2010 and 2015. During the first phase, the share of Taylorist jobs increased from 21% to 31%, whilst it decreased even more significantly during the second phase from 31% to 14%.
Different job clusters are more evenly distributed in the Mediterranean countries than in other OMS. This means that the share of creative jobs is significantly lower, while the other two job clusters, especially the Taylorist one is overrepresented compared to the European average. These four countries show different dynamics in terms of the changes in distribution of job clusters over time. The share of creative jobs increased in Italy and Spain, while it decreased in Greece. In contrast, the share of Taylorist workers remarkably increased in Greece, to a lesser extent in Italy, where the share of constrained problem solvers decreased dramatically from 28% (2005) to 16% (2015).
Similarly to the Mediterranean country group, we can observe opposite trends in case of the Anglo–Saxon countries. In the UK, the share of creative jobs increased significantly from 2005 to 2015, while the share of Taylorist workers decreased by the same extent (10 percentage points). In Ireland, the share of creative employees decreased remarkably from 2005 to 2010 but it increased again since then. The opposite trends were observable in case of the two other job clusters: after an increase during the first phase (between 2005 and 2010), we detected a decrease of similar extent during the second phase (between 2010 and 2015).
New Member States:
Highest Density of Creative Jobs Found in Estonia and Slovenia
It is not surprising that the share of creative jobs is less prevalent in the New Member States (NMS) than in the OMS. This country group is closer to the Mediterranean countries in this regard than to any other European country cluster. There are two exceptions from this rule, Estonia, where the 62% of jobs are creative, and Slovenia, where the same ratio is 55%. (See Table 7.) Latvia also had a relatively good position in 2005 and 2010 (52% and 58% respectively) but the share of creative jobs has been decreasing considerably since then and became one of the lowest in Europe for 2015 with 35%. This loss was compensated by an incredible increase in the number of Taylorist jobs: the share of this type of workplaces more than doubled in only five years, from 2010 to 2015 (from 22% to 48%). This is by far the biggest ratio for Taylorist workers ever registered in a European country.
Table 7. Distribution of job clusters in the New Member States (“CEE” country group).
[Own calculations based on EWCS 2005, 2010, 2015.]
2005 2010 2015
CW CP TW CW CP TW CW CP TW
Bulgaria 40 30 29 32 30 38 38 34 28
Czech Rep. 43 30 27 44 30 26 38 32 30
Estonia 57 25 19 62 21 16 62 21 18
Latvia 52 19 29 58 20 22 35 17 48
Lithuania 39 30 31 44 25 31 45 28 27
Hungary 44 29 27 48 29 23 37 30 33
Poland 46 32 22 42 29 29 41 30 29
Slovenia 52 24 24 52 31 17 55 26 19
Slovakia 37 32 31 35 32 32 35 35 31
Romania 37 39 24 35 34 31 35 37 28
EU–27 50 24 26 49 24 27 52 24 24
Legend: CW = creative workers; CP = constrained problem solvers; TW = Taylorised workers A similar pattern of increasing share of Taylorist jobs at the expense of a loss in creative ones can be observed in Hungary, where the second highest share of jobs without significant level of employee autonomy and learning opportunity was registered among the NMS, and to a much lesser extent in the Czech Republic. In Poland, Taylorist jobs gained importance already from 2005 to 2010 and have been stabilised since then. In Bulgaria, this shift from the creative to Taylorist workplaces was experienced between 2005 and 2010 but the creative cluster regained its importance in the next five years. The distribution of different job types has been relatively stable over time in Romania and Slovakia with a low level of employee- level autonomy at work: the share of constrained problem solvers is the highest in these two countries. Lithuania, in contrast, shows a mild but steady rise in the share of creative workers.
The Role of the 2008 Global Crisis: New Member States on a Diverging Development Path
It remains to be explored in more details how the global financial crisis and economic downturn might influence the distribution of different job clusters. The data sets allow us to distinguish short-term and mid-term impacts. It is worth noting that in not less than eight OMS, the share of creative jobs decreased between 2005 and 2010. This loss in creative jobs was compensated by an increase in the share of constrained problem solvers in Sweden, Germany and Luxemburg. On the contrary, in Greece and France the share of Taylorist jobs increased in parallel with the decrease of creative ones, while in the Netherlands and Ireland the loss in creative jobs was evenly distributed between the other two clusters.
Among the NMS, the share of creative jobs decreased from 2005 to 2010 in Poland (46% vs. 42%), Romania and Slovakia (37% vs. 35%). A significantly bigger decrease was experienced in the long run (i.e. between 2010 and 2015) in Latvia (58% vs. 35%), Hungary (48% vs. 37%), and the Czech Republic (44% vs. 38%). Latvia is an especially interesting
case as we observed a 6 percentage point increase in the share of creative workplaces from 2005 to 2010 but their share decreased dramatically in the following five years. Surprisingly enough, we find some countries where the share of creative workers increased despite economic recession: in Estonia (57% vs. 62%), Lithuania (39% vs. 45%) and Slovenia (52%
vs. 55%). There was a decline in the number of creative jobs from 2005 to 2010 in Bulgaria (40% vs. 32%) but their share has increased again in the following five years.
It is also interesting to note that while the differences between the country groups of the Old Member States have been shrinking over time, the CEE countries seem to diverge from this pattern. While the averages of Scandinavian and Continental country groups did not change much between 2005 and 2015, the Mediterranean countries show visible catching up tendencies in terms of both creative and Taylorised jobs, the first being augmenting and the second being decreasing. (See Tables 8, 9 and 10.) Also, the same is true for the Anglo–
Saxon country group. Meanwhile, the shares of different job clusters develop in the opposite direction in case of CEE countries. For example, in case of creative jobs, the difference between CEE and EU–27 averages increased from 7 to 13 percentage points between 2005 and 2015. In case of Taylorist jobs, the CEE country group average was 1 percentage point below the EU–27 average in 2005, it turned to a 5 percentage points handicap in 2015.
Table 8. The share of creative jobs by country groups in Europe (2005, 2010 and 2015).
[Own calculations based on EWCS 2005, 2010, 2015.]
SCD AGS CON MED CEE EU–27
2005 75 50 56 39 43 50
2010 72 51 50 46 42 49
2015 75 59 55 46 39 52
Legend: SCD= Scandinavian; AGS= Anglo–Saxon; CON= Continental; MED= Mediterranean;
CEE= Central and Eastern European country group
Table 9. The share of constrained problem solvers by country groups in Europe (2005, 2010 and 2015). [Own calculations based on EWCS 2005, 2010, 2015.]
SCD AGS CON MED CEE EU–27
2005 13 20 22 28 32 24
2010 16 25 25 20 30 24
2015 15 21 22 25 32 24
Legend: SCD = Scandinavian; AGS = Anglo–Saxon; CON = Continental; MED = Mediterranean;
CEE = Central and Eastern European country group
Table 10. The share of Taylorised workers by country groups in Europe (2005, 2010 and 2015). [Own calculations based on EWCS 2005, 2010, 2015.]
SCD AGS CON MED CEE EU–27
2005 12 30 22 33 25 26
2010 12 24 25 34 29 27
2015 10 20 22 29 29 24
Legend: SCD = Scandinavian; AGS = Anglo–Saxon; CON = Continental; MED = Mediterranean;
CEE = Central and Eastern European country group
Although the individual country analysis calls attention to the differences within conventional country groups and there are some notable exceptions from the general trends at both the high-end (e.g. Estonia and Slovenia) and the back-end (Greece, Latvia, Hungary), the country group analysis gives a more nuanced picture and calls attention to the diverging path taken by the majority of former socialist countries during the global economic crisis.
This calls for a deeper analysis of the effects of the global financial crisis and economic downturn and the individual country-level answers to it.
Sectoral Differences: The Public Sector is an Important Locus of Creative Jobs
In the followings, we will analyse differences in the share of job clusters from a sectoral perspective. As a first step, we distinguished work organisations operating in the private and public sectors.9 In order to keep the analysis easy to understand, we will focus on Hungary and aggregate, country group-level data. As we can see from Table 14 (see Annex), the public sector is an important locus of creative jobs in all country groups as their share is visibly higher compared to the private sector. However, this is not true for Hungary where there were no differences between the two sectors in 2015. Longitudinal analysis shows that this is a relatively recent trend in Hungary, because the public sector had a notably higher share of creative jobs than the private sector both in 2005 (58% vs. 40%) and 2010 (59% vs. 44%). This shift was due to the expansion of Taylorised workplaces. In 2010, for example, only 16% of public sector jobs were Taylorised but this ratio doubled in only five years (16% vs. 33%, from 2010 to 2015). Similar trends were observable in other CEE countries but to a significantly lesser degree (24% vs. 26%). In contrast, the Anglo–Saxon country group showed a reverse trend: the share of Taylorised workers was 33% in 2005 and it declined to 18% in 2015. The case of the Mediterranean and Continental country groups is also interesting: in the public sector there was a slightly higher share of creative jobs in 2005, but during a 10-year time span, this difference has been growing significantly higher and the public sector became undisputable the leader in the share of creative jobs.
9 Based on the related question asked in each of the three waves of the survey (“Are you working in the…? private sector; public sector; joint private–public organisation or company; not-for-profit sector, NGO; other”) we were able to distinguish between private and public sector employees (“joint private–public organisation or company”;
“not-for-profit sector, NGO”; and “other” answers were excluded from the results presented in Table 14).
In the following, we will analyse in more detail the changes in public administration compared to other sectors such as manufacturing, construction, and utilities; retail and other services; and business and financial services. It is impossible to make a comparison at country level because of the low number of cases, therefore we will limit our analysis to country group- level investigation. As we can see from the table below (Table 11), public administration has a leading role in promoting creative workplaces in all country groups. Even the “business and financial services”—which is traditionally regarded as one of most innovative sectors—is lagging behind public administration in terms of the share of creative jobs. This is not a novel phenomenon, the results of the data analysis show a similar pattern for 2005 and 2010, public administration being one of the most creative sectors. (See Table 15 in Annex.) It justifies the argument that innovation in the public sector should not be overlooked, instead it needs much more attention from both policy makers and social scientists.
Table 11. The share of creative jobs in some sectors by country groups (2015).
[Own calculations based on EWCS 2015.]
Sector SCD AGS CON MED CEE EU–27
Manufacturing, construction, and utilities 75 64 53 44 38 50
Retail and other services 68 42 46 39 37 43
Business and financial services 78 70 63 54 46 61
Public administration 85 75 69 59 43 64
Average 75 59 55 46 39 52
Legend: SCD = Scandinavian; AGS = Anglo–Saxon; CON = Continental; MED = Mediterranean;
CEE = Central and Eastern European country group
Despite this inherent innovative characteristic of the public administration in every country group, there are non-negligible differences, as well. Among them, the most striking is the high rate of constrained problem solvers in the public administration of the CEE countries. (See Table 12.) The share of these jobs varies between 11–20% in the Old Member States, while— in a sharp contrast—the same ratio is 35% in case of post-socialist countries, which is 14 percentage points higher than the EU–27 average. This is also the only country group in Europe where this type of job is the most prevalent in public administration in comparison with the other three sectors investigated.
Table 12. The share of constrained problem solvers in some sectors by country groups (2015). [Own calculations based on EWCS 2015.]
Sector SCD AGS CON MED CEE EU–27
Manufacturing, construction, and utilities 16 24 24 30 34 27
Retail and other services 17 25 26 26 28 26
Business and financial services 14 17 19 17 33 20
Public administration 11 17 18 20 35 21
Average 15 21 22 25 32 24
Legend: SCD = Scandinavian; AGS = Anglo–Saxon; CON = Continental; MED = Mediterranean;
CEE = Central and Eastern European country group
Concerning the Taylorised jobs, it is worthy of note that these jobs are almost missing in the Scandinavian public administration. (See Table 13.) Only every 25th employee is working in such an organisational arrangement characterised by a low level of creativity and autonomy. CEE countries are closer to the European average mainly due to the fact that the Mediterranean countries perform relatively low as well. The real breach therefore can be found not between Old and New Member States but between Mediterranean and CEE countries on the one hand, and Scandinavian, Continental and Anglo–Saxon countries on the other.
Table 13. The share of Taylorised jobs in some sectors by country groups (2015).
[Own calculations based on EWCS 2015.]
Sector SCD AGS CON MED CEE EU–27
Manufacturing, construction, and utilities 9 12 23 26 29 23
Retail and other services 15 33 28 35 35 31
Business and financial services 7 14 19 29 22 20
Public administration 4 8 13 21 22 15
Average 10 20 22 29 29 24
Legend: SCD = Scandinavian; AGS = Anglo–Saxon; CON = Continental; MED = Mediterranean;
CEE = Central and Eastern European country group
In order to put the analysis in a dynamic perspective, we also calculated the distribution of different job clusters for 2005 and 2010. As Table 15 shows (see Annex), while the rate of creative jobs did not change significantly from 2005 to 2015, however, this apparent stability hides important sectoral differences. For example, the share of creative jobs decreased in the retail and other services sector, as well as in business and financial services, while in manufacturing it slightly increased. In contrast, European public administration experienced an 8 percentage point increase and became the most creative sector among the investigated four branches. This growth was primarily due to the performance of the Mediterranean, Continental and Anglo–Saxon countries, producing an impressive increase of creative jobs (the growth rate varies between 14–17 percentage points). In the Scandinavian countries this ratio remained almost at the same high level. Meanwhile, the CEE country group experienced a significant loss in creative jobs as it was already pointed out earlier in this section.
In contrast to the creative jobs, the share of constrained problem solvers decreased significantly between 2005 and 2015 in the European public administration. (See Table 16 in Annex.) This was especially true for the Mediterranean countries where the growth of creative workplaces was compensated mainly by a loss in constrained problem solvers. It is also worthy of note that in case of Anglo–Saxon group, there was a fluctuation in between the two terminal dates of the investigation. The share of these workers increased from 18%
to 27% between 2005 and 2010, and then fell back to 17% in 2015. On the contrary, the share of constrained problem solvers remained the same after 2010 in the post-socialist countries (23%, 35% and 35%, respectively in the three periods).
Similarly to the previously analysed job cluster, the share of Taylorist workers also decreased in the European public administration between 2005 and 2010, but to a lesser
degree (from 19% to 15%, see Table 17 in Annex). Anglo–Saxon countries experienced the biggest loss in this regard but the share of Taylorised workers decreased in all other country groups, as well. The only exception is the CEE countries in which their share grew from 18% to 22%. Almost the same dynamics characterised the manufacturing sector: there were significantly less Taylorised workers in Scandinavian, Anglo–Saxon and Mediterranean countries, while their share remained the same in the Continental countries. The only country group where a slight increase was detected is that of the CEE countries (from 27% to 29%).
Conclusions
People are playing a key role in the public administration innovation, “…so one of the goals of public human resource management should be to support employees in innovating—that is, ensuring they have the ability, motivation and opportunity to come up with new approaches.
Ability requires not just technical skills but also creativity and associative thinking, as well as the behavioural and social skills needed to bring about change.” [24: 11] In relation with the types of investment in the innovation ability, the majority of efforts is focusing on the development of the “human capital” (i.e. investment in vocational education). Much less effort is taken to understand and invest into the improvement of the “structural capital”.
Focusing on structural capital “…may imply creating and/or implementing learning- intensive forms of organisation or technology.” [16: 22]
The ambition of our analysis is to better understand the characteristics of the “structural capital” fostering innovation in public administration. To create a new innovation policy framework, it is necessary to identify the pool of creative/innovative and less creative jobs reflecting the quality of structural capital in the European public administration in comparison to other sectors (e.g. manufacturing, knowledge intensive business services, etc.).
To make a general picture on the variation in creativity in the European economy, firstly a cross-country analysis was carried out in an ambition to map the share of job clusters
—measured by six variables presented in the methodology section of the paper—labelled as “creative”, “constrained problem solver” and “Taylorist” types. Secondly, we intended to indicate the differences of job clusters by sectors (e.g. private vs. public, public administration vs. manufacturing etc.).
One of the most important lessons of this exercise is that—in spite of the 2008 financial crisis and economic downturn—every second European worker is carrying out creative/
innovative work offering them both excellent learning possibilities and a substantial level of autonomy in their job. This type of job is one key factor in developing a learning/innovative organisation. [25] The remaining European workforce is characterised—with equal shares—
by constrained problem solvers and Taylorist workers. Jobs belonging to the constrained problem solver cluster offer substantial learning opportunity and rather limited autonomy.
The Taylorist jobs, as an emblematic mass production type of work, is characterised by lack of learning/innovation and low level of autonomy. Patterns of job clusters’ distributions remained fairly stable as compared with the three waves of the EWCS (2005, 2010 and 2015).
In addition to this rather stable European trend of job clusters’ structure during the last ten years (from 2005 to 2015) visible country group and sector (e.g. private vs. public;
manufacturing, services, etc.) differences were identified. In our analysis, Old Member
![Table 1. Differences between the private and public sector innovation. (EPSIS [13])](https://thumb-eu.123doks.com/thumbv2/9dokorg/1332087.107840/4.722.82.638.582.673/table-differences-private-public-sector-innovation-epsis.webp)