Prevalence of gambling-related harm provides evidence for the prevention paradox
MATTHEW BROWNE* and MATTHEW J. ROCKLOFF
School of Health, Medical and Applied Sciences, Central Queensland University, Branyan, QLD, Australia
(Received: December 11, 2017; revised manuscript received: March 22, 2018; second revised manuscript received: April 7, 2018;
accepted: April 8, 2018)
Background:The prevention paradox (PP) describes a situation in which a greater number of cases of a disease-state come from low-risk members of a population, because they are more prevalent than high-risk members. Past research has provided only tangential and disputed evidence to support the application of the PP to gambling-related harm.
Aims: To assess whether the PP applies to gambling, the prevalence of a large set (72) of diverse harmful consequences from gambling was examined across four risk categories for problem gambling, including no-risk, low- risk, moderate-risk, and problem-gambling.Methods:Respondents who had gambled on non-lottery forms in the past 6 months completed an online survey (N=1,524, 49.4% male). The data were weighted to the known prevalence of gambling problems in the Victorian community.Results:The prevalence of gambling harms, including severe harms, was generally higher in the combined categories of lower risk categories compared to the high-risk problem-gambling category. There were some notable exceptions, however, for some severe and rare harms. Nevertheless, the majority of harms in the 72-item list, including serious harms such as needing temporary accommodation, emergency welfare assistance, experiencing separation or end of a relationship, loss of a job, needing to sell personal items, and experiencing domestic violence from gambling, were more commonly associated with lower risk gamblers.
Conclusion: Many significant harms are concentrated outside the ranks of gamblers with a severe mental health condition, which supports a public-health approach to ameliorating gambling-related harm.
Keywords:gambling harm, prevention paradox, public health
INTRODUCTION
Problem gambling (PG) has been defined as being charac- terized by“difficulties in limiting money and/or time spent on gambling which leads to adverse consequences for the gambler, others, or for the community”[Neal, Delfabbro, &
O’Neil, 2005, p (i)]. Prevalence screens of PG generally report a population prevalence rate of around 1%. However, population screens of PG–rather than detecting the pres- ence of adverse consequences–tend to focus more on classifying individuals with “impaired control” or depen- dence, with content strongly influenced by diagnostic (i.e., DSM-4/5) criteria (Williams & Volberg, 2010). This raises the question of whether the harmful consequences of gambling are restricted to these high-risk individuals.
In line with Korn and Shaffer’s (1999) proposal to adopt a public-health (PH) approach to gambling, an ongoing theme has been the reconciliation of this paradigm with the existing clinical/pathological model. The latter tradition is exemplified by a focus on the individual problem gambler (PG) as the source of harm, and a reliance on population screens based on diagnostic criteria, such as the Problem Gambling Severity Index (PGSI). Implicit corollaries of the clinical model are that negative consequences from gam- bling are bound up with addiction symptomatology, and that
non-PG individuals are largely free of significant adverse consequences. In contrast, the PH approach emphasizes the distinction between risk factors–such as excessive gambling or psychological dependence and the sequelae– the negative consequences of such behaviors or conditions.
Furthermore, the PH perspective encourages thinking about both gambling and negative consequences on a continuum, ranging from low/negligible to intense/severe, with progres- sively decreasing population prevalence toward the more severe end of the spectrum (Browne, Rawat, et al., 2017;Li, Browne, Rawat, Langham, & Rockloff, 2016; Shaffer &
Korn, 2002).
The conflict between these two perspectives was recently drawn into sharp focus by Delfabbro and King (2017), who considered arguments for and against the proposition that the “prevention paradox”(PP) is applicable to harms from gambling. The PP refers to a situation in which “A large number of people exposed to a low risk is likely to produce more cases than a small number of people exposed to a high
* Corresponding author: Matthew Browne; School of Health, Medical and Applied Sciences, Central Queensland University, Bundaberg Campus, B8 G.47 University Drive, Branyan 4670, QLD, Australia; Phone: +61 7 4150 7002; E-mail: m.browne@
cqu.edu.au
This is an open-access article distributed under the terms of theCreative Commons Attribution-NonCommercial 4.0 International License, which permits unrestricted use, distribution, and reproduction in any medium for non-commercial purposes, provided the original author and source are credited, a link to the CC License is provided, and changes–if any–are indicated.
DOI: 10.1556/2006.7.2018.41 First published online May 15, 2018
risk” (Rose, 1981, p. 1849). Delfabbro and King (2017) provide an illustrative example, in which a study of alcohol- related harm found that most alcohol-related problems (e.g., fights and hospital admissions) emerge from lower- rather than higher-risk alcohol consumption categories (Rossow & Romelsjö, 2006).
There is some evidence that the PP may be supported in the case of gambling-related harm. In a British population survey, Canale, Vieno, and Griffiths (2016) observed that harms were distributed across low- (LR) to moderate-risk (MR) gamblers and not confined to PGs. Furthermore, most individuals experiencing at least one harm were drawn from groups consuming gambling less intensely in terms of time and money expenditure. In a national Finnish telephone survey, Raisamo, Mäkelä, Salonen, and Lintonen (2015) noted that harms were reported even at low gambling frequency and expenditure levels, and suggested an in- creased focus toward the lower end of the intensity spec- trum. Browne, Rawat, et al. (2017) applied PH elicitation protocols to estimate the typical decrement to quality of life associated with each PGSI risk category. Adjusting for population prevalence, they found that at the population level, most harm (treated as a total decrement to quality of life) was attributable to lower risk categories.
Delfrabbro and King (2017) provide a critical evaluation of the PP in gambling, raising several important points.
First, both Raisamo et al. (2015) and Canale et al. (2016) employed an alternative scoring for the PGSI, which assigned more cases to the LR, rather than the MR category.
This has the effect of increasing the apparent relative contribution of these categories. Second, the measurement of gambling harm in both studies is questionable: they relied on indicators such as“chasing losses,”or“betting more than one can afford,” which are arguably not harmful conse- quences. However, gambling-related harm is complex and multifaceted (Langham et al., 2016), and inadequate or incomplete coverage of the construct domain may lead to underestimates of the prevalence or degree of harm in the community. Nevertheless, the broader point made by Delfabbro and King (2017) is that any conclusion regarding the distribution of harm depends very much upon where one draws the threshold of harm. That is, the PP will always be supported, if the threshold for harm is set at a sufficiently low level (e.g.,“lost money at gambling”). Supporting this point of view, an item-response theoretical analysis of Li et al. (2016) on 72 specific negative consequences of gambling confirms that they widely vary in terms of severity and prevalence. Browne, Rawat, et al.’s (2017) approach to assessing population-level harm focused on a global decre- ment to health and well-being via PH“Burden of Disease” elicitation methods. However, it does not directly address the PP question, which is concerned with the relative prevalence of specific sequelae (e.g., credit card debt and depression) that arises from gambling (Browne & Rockloff, 2017).
As implied in the preceding overview, there is a currently substantial conceptual ambiguity in the definition and mea- surement of gambling-related harm. One can speak about harm as a unitary construct, as a quantifiable decrement to an individual’s health and well-being. Alternatively, one can enumerate a plurality of harms, delineating a range of
specific potential adverse consequences of excessive gam- bling involvement–ranging from relatively trivial to very severe. Analysis of prior survey data suggests that, although individuals vary considerably in the quality of harm (i.e., reporting differing profiles of specific harms), these specific consequences reflect an underlying continuum of varying degrees of overall harm (Browne, Rawat, et al., 2017;Li et al., 2016). This can be measured with satisfac- tory accuracy using a dedicated short-form instrument (Browne, Goodwin, & Rockloff, 2017). Nevertheless, the PP is concerned with binary categories (high vs. low risk, or–alternatively–adverse consequence occurring or not).
Therefore, this study focuses on the relative prevalence of specific harms, rather than aggregating a unitary metric as has been done previously (Browne, Greer, Rawat, &
Rockloff, 2017,Browne, Rawat, et al., 2017).
The PP has been introduced as an important question for gambling, with strong implications regarding which seg- ments of the population should be the focus of research and interventions. However, to date, very little direct evidence has been presented addressing whether the proposition is true in the case of gambling. This study attempts to partially address the concerns raised by Delfabbro and King (2017) and attempts to directly address whether the PP is meaning- fully true in the case of gambling-related harms. We address concerns regarding measure suitability by employing Li et al.’s (2016) comprehensive and dedicated harms checklist of 72 discrete consequences, based on a multidimensional framework developed by Langham et al. (2016). Thus, the PP question will be separately addressed for a wide variety of consequences, ranging from mild to severe. The proposed analysis will be carried out using the standard PGSI risk categories and the conventional approach to scoring. The conventional and validated interpretation of the PGSI is as a classification of PGs versus others (Currie, Hodgins, &
Casey, 2013). The PP question will therefore be framed in terms of whether or not the majority of cases in the population arise from the high-risk PG subpopulation or the lower-risk non-PG population. Nevertheless, we shall report results for all four gambling risk categories: recrea- tional gamblers (RG), LR, MR, and PG.
METHODS
This study represents a secondary analysis of a data set originally used to develop the short gambling harms screen (SGHS; Browne, Goodwin, et al., 2017).
Participants
Adult gamblers (N=1,524) who had gambled on non- lottery gambling modes in the past 6 months were recruited for the study through an online survey panel recruitment service (ResearchNow, www.researchnow.com). The sam- ple was composed of 49.4% males and ages ranged from 18 to 101 years (M=44.99,SD=15.57). The median age of the sample was slightly higher than that of the Australian population (38 years in 2017). The majority of participants were born in Australia (78.1%), with the remainder born in England (5.6%), New Zealand (2.4%), India (2.2%), and
other countries (11.7%). This is quite similar to the Austra- lian census statistics, which reported 77.8% of Australian- born overseas in 2015. In our sample, 34.5% had attained a bachelor’s degree or higher educational qualification, which is similar to the 2017 censusfigure of 31.4%. Furthermore, 59.8% were in some kind of paid employment, which is comparable to the Australian (2016) participation rate of 60.3%. About 38% of participants reported an income of
$32,000 per annum or less, and 23.1% reported earning more than $78,000 per annum, with the remainder (38.6%) earning within this range. Finally, 68.2% of our sample were in a married, de facto, or domestic partnership, compared to a census figure of 71.5%.
Procedure
Eligible members of the online panel were invited through e-mail to participate in an online survey regarding their gambling activity and outcomes over a 2-week period in 2016. The survey took approximately 10 min to complete and participants were compensated with credit points from the panel provider, which they can accumulate and ex- change for cash and prizes.
Measures
The key measures of gambling risk and negative conse- quences from gambling were both framed with respect to the past 12-month period.
Gambling risk
The PGSI (Ferris & Wynne, 2001) was used to classify gamblers into risk categories. The scale consists of nine questions, five of which deal with negative consequences.
The fact that the PGSI incorporates probes of both risk and consequences is a limitation that will be discussed below.
PGSI total scores were used to classify gamblers into four groups: 0 → RG, 1–2→LR, 3–7→MR, and 8+ →PG.
Cronbach’sαfor this study was high (α=.95). Common with what has been found in other online panels (e.g., Browne, Greer, et al., 2017), the sample included a high proportion of gamblers in higher risk categories: 39.5% RG, 22.3% LR, 17.4% MR, and 20.6% PG. While not representative of the general population, this characteristic conveniently yields an approximately stratified sample with respect to gambling risk severity, although it is otherwise broadly similar with respect to key demographic characteristics (see “Partici- pants”section).
Negative consequences of gambling
The negative consequences of gambling were measured using a 72-item checklist (Langham et al., 2016,Li et al., 2016), including harms across six domains (financial, rela- tionships, emotional/psychological, health, work/study, and social deviance), and which vary considerably with respect to prevalence and severity. For example, social deviance harms, which include criminality and neglect of children, are considerably less prevalent thanfinancial harms, such as increased credit card debt or selling items to fund gambling.
Each item is binary scored, i.e., respondents indicate that the harm eitherdidordid nothappen to them as a result of their gambling within the past 12 months. Although not designed to be a summative scale, coefficient ofαfor the present data was quite high, ranging from 0.79 (work/study) to 0.90 (emotional/psychological). Correlations between the do- main sums are provided in the “Results”section.
Analyses
Descriptive analyses were conducted to estimate the preva- lence of negative consequences from gambling in the general population, with respect to each of the four PGSI risk categories. Prevalence of harms in the population,p(H), can be estimated in a two-step process by treating the harm prevalence estimates from a stratified sample asconditional with respect to PGSI category p(H|C), and weighting with respect to previously established population prevalence of PGSI categoriesp(C). That is,^pðHÞ=pðHjCÞpðCÞ. Such a calculation will provide an unbiased measure ofp(H), under the assumption that the prevalence of harm in the stratified sample is a true reflection of the population, conditional on PGSI category. Further discussion of this assumption is provided in the “Discussion”section.
All the results presented are based on the above calcula- tion for^pðHÞ, employing PGSI prevalencefigures forp(C) of RG=0.5759, LR=0.0891, MR=0.0279, and PG= 0.0081, as reported by a recent Australian prevalence survey (Hare, 2015). The marginal probabilities p(H|C) were calculated from the online panel survey described above in the “Participants”section.
Ethics
The study underwent ethical review and was approved by the institutional Human Research Ethical Review board (no.
H16/05-125), with participants providing informed consent before participation.
RESULTS
Table 1provides descriptives and bivariate correlations of the panel sample for age, gender, educational level, PGSI score, and harm domain counts. Overall, financial and emotional/psychological harms were most prevalent, and social deviance harms were the least prevalent. Counts of harms within each domain were moderately to strongly correlated with each other and PGSI.
Figure 1a illustrates the probability that a randomly selected member of the Australian population is a member of each of the PGSI categories. Figure1bshows the average count of harms (out of 72) reported by members of each PGSI category. Figure1cdisplays the number of gambling harms per 1,000 people, reported by individuals in each of the PGSI categories. That is, Figure1cincorporates both the number of harms reported per person and the base preva- lence of persons in each PGSI category. From Figure1, it can be observed that the progressively diminishing preva- lence of more severe PGSI categories is offset by the increasing incidence of harms per person within categories.
This leads to an approximately uniform number of harms arising in the population from individuals in each of the PGSI categories. Since the PG category accounts for less than one-quarter of all reported harms, this result supports the PP–but in a highly limited sense, since it ignores the severity of the harms reported.
Figure2provides a mosaic plot of the number of people indicating 1+harms, within each of the PGSI categories– including non-gamblers, all of whom are assumed to
experience zero harms from their own gambling. The area of each rectangle in Figure2is proportional to the probability that a randomly selected member of the population falls into both the harm and the PGSI risk category. It can be seen that a randomly chosen gambler indicating 1+harms is more likely to belong to a lower risk category than a higher risk category, and that PGs account for a small fraction of individuals reporting 1+harms. However, this analysis does not account for the severity, kind, or number of harms reported.
Table 1. Descriptives and Spearman’s rank-order correlations between harm counts within domains, PGSI score, and demographics
Min Max Median Mean (SD) [1] [2] [3] [4] [5] [6] [7] [8] [9]
Age [1] 18 101 44 44.99 (15.57) –
Female [2] 0 1 2 0.51 (0.50) −0.25 –
Educationa [3] 1 8 4 3.99 (1.98) −0.12 −0.11 –
PGSI score [4] 0 27 1 3.77 (5.43) −0.22 −0.02 0.13 –
Domain harm count
Financial [5] 0 10 0 0.97 (1.67) −0.19 −0.01 0.08 0.65 –
Relationship [6] 0 10 0 0.59 (1.43) −0.16 −0.01 0.11 0.66 0.71 –
Emotional/
psychological [7]
0 10 0 0.85 (1.82) −0.13 0.01 0.08 0.66 0.70 0.76 –
Health [8] 0 15 0 0.79 (1.75) −0.15 0.01 0.11 0.67 0.72 0.82 0.78 –
Work/study [9] 0 10 0 0.4 (1.04) −0.21 −0.02 0.19 0.62 0.60 0.72 0.62 0.77 –
Social deviance [10] 0 10 0 0.3 (0.96) −0.17 0.01 0.16 0.61 0.58 0.68 0.55 0.71 0.76
Note.aTreated as an eight-level ordinal variable: [1]<high school, [2] diploma or equivalent, [3] college, no degree, [4] non-degree award, [5] associates degree, [6] bachelor’s degree, [7] masters degree, and [8] doctoral degree. SD: standard deviation; PGSI: Problem Gambling Severity Index.
Figure 1.(a) Prevalence of PGSI categories, (b) average number of harms per person within PGSI categories, and (c) number of harms per 1,000 people arising from each PGSI category
Figure 2.Mosaic plot of the estimated number of individuals in the population with at least one harm, by PGSI category
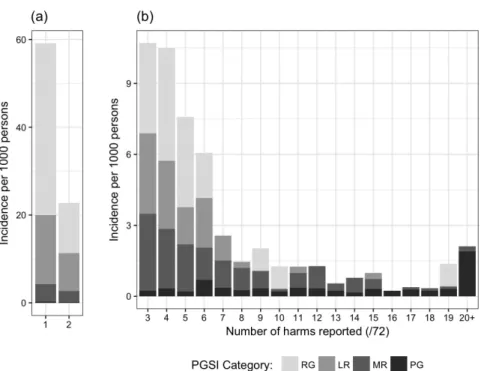
Figure 3 summarizes the prevalence, per 1,000 indivi- duals, of gamblers reporting varying numbers of harms. As indicated by the separate scale employed in panel (a), persons reporting fewer harms are much more prevalent than those reporting many harms. The majority of persons reporting just one harm are RGs. PGs comprise a relatively small minority of harmed individuals, until the number of harms reported exceeds 15. RGs and LR gamblers comprise the majority of harmed individuals until the number of harms reported per person exceeds 6. Most people are reporting relatively few harms, and among those reporting few harms–most of these people are recreational and LR gamblers.
Figure 4 describes the relative proportion of harms reported by harm domain and PGSI category. The most prevalent single category was that offinancial harms occur- ring to RGs. Only 10% offinancial harms occurring in the population are associated with PGs. The pattern is opposite for harms in the social deviance category, which is the least prevalent. More than 50% of social deviance harms are attributable to PGs. Harms within other domains are roughly evenly distributed between PGSI categories. Thus, the PP is supported for most domains of harm–although once again harm severity is not considered.
Figures 5–10 provide mosaic plots for specific harms within thefinancial, health, relationship, work/study, Figure 3.Stacked bar chart of the estimated prevalence of individuals reporting differing numbers of harm by PGSI category
Figure 4.Mosaic plot of the proportion of harms arising from PGSI categories, by harm domain
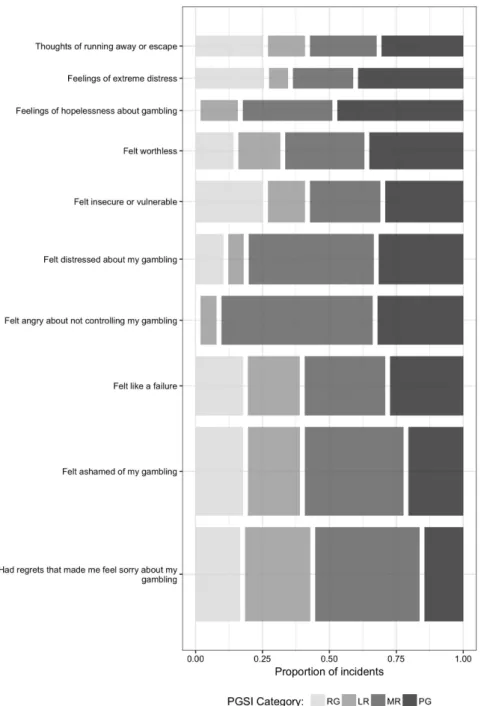
emotional, and social deviance domains. The ordering of harms on theyaxis is with respect to statistical item severity (Li et al. 2016).
From Figure5, it can be seen that almost allfinancial harms, including relatively common and moderately se- vere consequences, such as increased credit card debt, and less spending on medications and food, are more likely to occur to gamblers in lower risk categories. For example, more than 50% of individuals who sold personal items due to gambling are estimated to be in the RG category. Severe consequences, such as loss of supply of utilities and loss of significant assets, are more likely to be reported by MR and PG gamblers. However, these events represent a very small proportion of finan- cial harms. Thus, the PP holds formostspecificfinancial harms, with the exception of these two rare and severe harms.
For health, relationship, work/study, and emotional harms (Figures6–9), negative consequences are more even- ly distributed among the PGSI risk categories. However, similar to financial harms, only the most severe and rare harms (e.g., unhygienic living conditions) tend to arise more frequently from PGs. The PP is supported in the case of more prevalent, yet also severe, consequences such as neglecting hygiene and increased incidence of depression.
For work/study harms, the PP was not supported in the case of being absent from work to gamble, using work and/or study time to gamble, and being excluded from study due to gambling provided more cases from PGs. The PP was supported for every specific relationship and emotional harm without exception.
The social deviance harms (Figure10) tended to present a markedly different prevalence profile with respect to risk category, with the PPnotbeing supported for most instances Figure 5.Mosaic plot of the proportion of specificfinancial harms arising from PGSI categories
of social deviance, such as stealing money, deception with respect to money and crime. Experience with domestic violence was a notable exception to this pattern, being a severe instance of social deviance that is most commonly reported among RGs. In two other exceptions, the PP was supported for the most common and least severe social deviance-related harms, including not fully attending to the needs of children and feeling less connected to religious or cultural communities.
DISCUSSION
This is thefirst study to describe the population prevalence of gambling-related harm, employing a novel methodology that combines information from a cross-sectional, non- representative survey, and population data on prevalence
of gambling problems. As discussed in the “Introduction” and by Delfabbro and King (2017), prior population studies of gambling harm (Canale et al., 2016, Raisamo et al., 2015), although providing suggestive evidence regarding the PP, are subjected to limitations of scope or methodology that limit interpretation. This study aimed to resolve this question by employing a methodology designed to directly address the PP hypothesis.
Excessive or problematic gambling can lead to increased risk of many and varied negative consequences, which often co-occur in individuals. If one ignores the severity of the consequence, we found that the PP is confirmed to apply to gambling for all types of harm, except for social deviance harms. Furthermore, the PP is confirmed in the case of persons experiencing 6 or fewer harms, which represent the large majority of harmed individuals. Considering the se- verity of the specific consequence, a more complex but still Figure 6.Mosaic plot of the proportion of specific health harms arising from PGSI categories
relatively consistent picture emerges. The PP is generally confirmed, except for a small minority of low prevalence, very severe harms.
As articulated by Delfabbro and King (2017), ignoring the type and severity of the harm can be misleading.
Furthermore, less severe harms tend to be characteristic of the more prevalent lower risk categories, who will also tend to experience fewer harms per person. For example, in the case of “reduced savings,”about 70% of cases arise from RG or LR categories. Delfabbro and King (2017) make a strong case for excluding minor harms from the PP question, as these may distort the result so as to place undue emphasis on minor impacts–which may well be outweighed by the recreational benefits derived from gambling. According- ly, it is perhaps most relevant to focus on consequences that are most prevalent overall but cannot be dismissed as being inconsequential. In the case of the financial
domain (Figure5)–which itself the most common category of reported harm–non-trivial but prevalent harms include increased credit card debt, late payments on bills, and selling personal items to fund gambling. The PP is un- equivocally supported in the case of these harms. For financial harms, PP is typically rejected only for the least prevalent, but most severe, consequences, such as bank- ruptcy, loss of significant assets, and the loss of connected utilities. Thus, the present analysis suggests that the PP is not only supported in the case of arguably “trivial” and very prevalent harms, but also in the case of financial harms that are both prevalent and relatively severe. There- fore, it cannot be credibly argued that support for the PP is only a consequence of considering subjectively inconse- quential harms in our analyses.
Although generally supported, the PP phenomenon is less extreme in the case of harms in other domains. In the Figure 7.Mosaic plot of the proportion of specific relationship harms arising from PGSI categories
health domain, the PP is rejected in the case of the sixleast prevalent, but most severe harms including attempted sui- cide or acts of self-harm. The PP is supported in the case of moderately severe health harms, including increased inci- dence of depression and stress-related health problems.
However, 30–40% of these moderately severe health harms do arise from the much smaller PG subpop- ulation. A similar pattern is evident in the remaining domains, except for social deviance. In this domain, the PP is only supported in the case of domestic violence, not attending to the needs of children, and feeling less connected to a religious or cultural community–of which thefirst two would unambiguously qualify as being at least reasonably severe. The remaining nine specific harms are concentrated in the PG population.
The PP is supported for all domains with the exception of social deviance harms, and is especially characteristic of
financial harms. This pattern accords well with an accepted understanding of the progression of gambling problems (Langham et al., 2016). Because risky gambling primarily involves excessive monetary expenditure, the immediate and primary consequence is varying degrees of financial deprivation. Therefore, of all the domains, financial harms would be expected to be relatively more prevalent in the broader population. If problems worsen, then impacts on work, health, relationships, and psychological well-being are likely to ensue–many of which can be attributed to increasingfinancial stress. As social and personal resources diminish, then these can in turn contribute to departures from normative or socially condoned behavior. The occur- rence of these would tend to reflect not only the direct impact of gambling but also the cumulative impact of other domains of harm. Thus, social deviance harms would be expected to be concentrated at the most severe Figure 8.Mosaic plot of the proportion of specific work/study harms arising from PGSI categories
end of the spectrum–reflecting a“snowballing”of cumu- lative impacts.
Limitations
Direct population-representative measurement of harms via computer-aided telephone interviewing is prohibitively ex- pensive, due to both the length of such a comprehensive harms checklist and the low prevalence of higher risk categories–especially PGs–in the general population. To illustrate, a recent population representative survey in Australia of 5,000 individuals, which included only the short-form harm checklist (Browne, Goodwin, et al., 2017), rather than all 72 items, was conducted at a cost of AUD
$894k, but yielded just 23 PG responses. Thus, the orthodox
“one-step”population-representative sampling provides insuf- ficient resolution at the severe end of the PG spectrum.
Accordingly, the present method employed a methodologi- cally novel“two-step”method to infer population prevalence of gambling-related harms. The sample from an Internet panel provider yielded good resolution across all PGSI categories.
The prevalence for problems within this sample was then projected to the larger population of Victorian residents using population prevalence of PGSI categories. The validity of this method is supported by the relatively close demographic match of the sample to the Australian population. Neverthe- less, there is an assumption that the harms experienced by people in the sample, within each PGSI category, are repre- sentative of harms experienced by gamblers in corresponding PGSI categories in the population.
Common to self-report methods, there is also an assump- tion that respondents are able to recognize the instrumental role of gambling in producing the harmful outcomes that they have experienced. In some case, this may be true.
Figure 9.Mosaic plot of the proportion of specific emotional/psychological harms arising from PGSI categories
For example, participants who are experiencing both de- pression and gambling problems may overattribute the instrumental role of gambling in causing depression–thus inflating the apparent impact of gambling problems. Given that experimental studies are not ethical or feasible in this context, we recommend further research undertake matched-case sampling methods, in which participants nominate their experience of potential harmful conse- quences from gambling, without being asked to attribute gambling as the causal factor. Matched-case comparisons can then be used to impute the instrumental role of gambling in driving these negative life events/conditions.
There was no consideration of offsetting benefits that might accrue from gambling considered in this study, and this could affect an interpretation of the results. If recrea- tional gamblers at lesser risk are experiencing compensating
benefits, their consumption of gambling products may still have a net benefit–whereas PGs can be safely presumed to be experiencing relatively more harm than benefits. Furthermore, the study did not consider the harms accruing to concerned- significant-others (CSOs; e.g., the gambler’s spouse). The PP could be true of a harm related to the gambler and potentially not true for a harm occurring to a CSO.
Finally, binary scoring only allows for assessing whether a harm occurred or not in the 12 months prior to the administration of the survey. As Delfabbro and King (2017) rightly point out, this ignores frequency and duration of the incident and therefore represents a bias toward the lower end of the spectrum. Future work might consider reducing the breadth of harms surveyed, thus making room for measurement of the frequency and duration of the experienced harm.
Figure 10.Mosaic plot of the proportion of specific social deviance harms arising from PGSI categories
CONCLUSIONS
The results of this study show that the PP is a suitable description for the majority of gambling-related harms.
Absolute counts of harm are roughly uniformly distributed among gambling risk categories, whereas a somewhat higher number are nominated by recreational gamblers. The count of harms in broad categories of financial, health, relationship, work/study, and emotional/psychological also show greater numbers for non-PGs. Looking at specific harms within each domain reveals that the PP is supported for virtually all financial, health, and emotional/psychological harms– including those who are both prevalent and severe. Only a few very severe and rare harms, such as attempting suicide, are more commonly a result of PG. Consequently, the PP is a good descriptor for most but not all harm resulting from gambling, and this result emphasizes the importance of a PH approach to reducing harm.
Research and interventions for gambling should recog- nize that adverse impacts from gambling are distributed more broadly than 1% of the population in the highest risk category. That is, harms are incurred by a significantly larger group of gamblers who are incurring damaging financial losses. A consequence of this observation is that gambling harm-reduction should have a decreased focus on the pathology of “addicted”individuals, in favor of measures that address product safety, environmental, and structural characteristics (Livingston & Adams, 2011;Livingstone &
Woolley, 2007; Sharpe, Walker, Coughlan, Enersen, &
Blaszczynski, 2005). It must be acknowledged that in Australia, this perspective is currently subjected to consid- erable industry-led resistance, due to a conflicting interest in maximizing player losses. Our view, informed by this and similar results (e.g., Browne, Greer, et al., 2017;Li et al., 2016), is that significant gambling-harm reduction can only be achieved through broad-scale measures that act to limit long-term player losses–with the consequence of also reducing industry revenue in the short term. While these observations are largely limited to the Australian context, they would also likely apply to similar cultural and regula- tory contexts–including New Zealand, North America, and Europe.
Future directions
The PGSI presumes to measure risk of developing a gam- bling disorder and the presence of a “possible”gambling disorder. However, the PGSI contains some items that measure harmful consequences from gambling rather than indicators of behavioral addiction. Consequently, our at- tempt to examine the prevalence harms within each risk category necessarily includes some confusion in the measurement paradigm. It will be highly useful in future research to have a measure of risk for developing gambling- related harm that is wholly independent of harmful con- sequences. Use of this proposed risk measure instead of the PGSI would provide a clearer picture of the concentra- tion of harm among higher- and lower-risk segments of the community. Case–control survey methods, which avoid requiring participants to judge the instrumental role of gambling in reported harms, appear to have great potential.
The use of these would address concerns regarding potential overreporting bias, thus yielding more robust estimates of the true impact of gambling in the population.
Funding sources:Data collection for this study was funded by the Victorian Responsible Gambling Foundation (VRGF). MB has received funding from the NZ Ministry of Health, VRGF, the Queensland Department of Health, the Tasmanian Department of Treasury and Finance, the Alberta Gambling Research Institute, the First Nations Foundation and Gambling Research Australia. MJR has additionally received funding from the Department of Social Services (Federal), the Queensland Treasury, and the Victorian Department of Justice.
Authors’ contribution: MB designed the original survey, conducted statistical analyses, and drafted the manuscript.
MJR advised on the methodology, edited, and contributed to the manuscript.
Conflict of interest: The authors declare no conflict of interest in relation to this work.
REFERENCES
Browne, M., Goodwin, B. C., & Rockloff, M. J. (2017). Validation of the Short Gambling Harm Screen (SGHS): A tool for assess- ment of harms from gambling. Journal of Gambling Studies.
Advance online publication. doi:10.1007/s10899-017-9698-y Browne, M., Greer, N., Rawat, V., & Rockloff, M. (2017).
A population-level metric for gambling-related harm.
International Gambling Studies, 17(2), 163–175. doi:10.1080/
14459795.2017.1304973
Browne, M., Rawat, V., Greer, N., Langham, E., Rockloff, M., &
Hanley, C. (2017). What is the harm? Applying a public health methodology to measure the impact of gambling problems and harm on quality of life.Journal of Gambling Issues, 36,28–50.
doi:10.4309/jgi.2017.36.2
Browne, M., & Rockloff, M. J. (2017). The dangers of conflating gambling-related harm with disordered gambling.Journal of Behavioral Addictions, 6(3), 317–320. doi:10.1556/2006.6.
2017.059
Currie, S. R., Hodgins, D. C., & Casey, D. M. (2013). Validity of the Problem Gambling Severity Index interpretive categories.
Journal of Gambling Studies, 29(2), 311–327. doi:10.1007/
s10899-012-9300-6
Canale, N., Vieno, A., & Griffiths, M. D. (2016). The extent and distribution of gambling-related harms and the prevention paradox in a British population survey.Journal of Behavioral Addictions, 5(2), 204–212. doi:10.1556/2006.5.2016.023 Delfabbro, P., & King, D. (2017). Prevention paradox logic and
problem gambling: Does low-risk gambling impose a greater burden of harm than high-risk gambling?Journal of Behavioral Addictions, 6(2), 163–167. doi:10.1556/2006.6.2017.022 Ferris, J., & Wynne, H. (2001).The Canadian Problem Gambling
Index. Ottawa, ON: Canadian Centre on Substance Abuse.
Retrieved from http://ccgr.ca/sites/default/files/CPGI-Final- Report-English.pdf
Hare, S. (2015). Study of Gambling and Health in Victoria.
Findings from the Victorian Prevalence Study 2014.
North Melbourne, Australia: Victorian Responsible Gambling Foundation/Victorian Department of Justice and Regulation.
Korn, D. A., & Shaffer, H. J. (1999). Gambling and the health of the public: Adopting a public health perspective. Journal of Gambling Studies, 15(4), 289–365. doi:10.1023/A:1023005 115932
Langham, E., Thorne, H., Browne, M., Donaldson, P., Rose, J., &
Rockloff, M. (2016). Understanding gambling related harm:
A proposed definition, conceptual framework, and taxonomy of harms.BMC Public Health, 16(1), 80. doi:10.1186/s12889- 016-2747-0
Li, E., Browne, M., Rawat, V., Langham, E., & Rockloff, M.
(2016). Breaking bad: Comparing gambling harms among gamblers and affected others. Journal of Gambling Studies, 33(1), 223–248. doi:10.1007/s10899-016-9632-8
Livingstone, C., & Adams, P. J. (2011). Harm promotion: Obser- vations on the symbiosis between government and private industries in Australasia for the development of highly acces- sible gambling markets.Addiction, 106(1), 3–8. doi:10.1111/
j.1360-0443.2010.03137.x
Livingstone, C., & Woolley, R. (2007). Risky business: A few provocations on the regulation of electronic gaming machines.
International Gambling Studies, 7(3), 361–376. doi:10.1080/
14459790701601810
Neal, P. N., Delfabbro, P. H., & O’Neil, M. G. (2005).Problem gambling and harm: Towards a national definition.
Melbourne, VIC: Office of Gaming and Racing, Victorian Government Department of Justice.
Raisamo, S. U., Mäkelä, P., Salonen, A. H., & Lintonen, T. P.
(2015). The extent and distribution of gambling harm in Finland as assessed by the Problem Gambling Severity Index.
European Journal of Public Health, 25(4), 716–722. doi:10.
1093/eurpub/cku210
Rose, G. (1981). Strategy of prevention: Lessons from cardiovas- cular disease.British Medical Journal, 282(6279), 1847–1851.
doi:10.1136/bmj.282.6279.1847
Rossow, I., & Romelsjö, A. (2006). The extent of the“prevention paradox” in alcohol problems as a function of population drinking patterns. Addiction, 101(1), 84–90. doi:10.1111/
j.1360-0443.2005.01294.x
Shaffer, H. J., & Korn, D. A. (2002). Gambling and related mental disorders: A public health analysis.Annual Review of Public Health, 23(1), 171–212. Retrieved from http://www.annual reviews.org/doi/abs/10.1146/annurev.publhealth.23.100901.
140532
Sharpe, L., Walker, M., Coughlan, M. J., Enersen, K., &
Blaszczynski, A. (2005). Structural changes to electronic gaming machines as effective harm minimization strategies for non-problem and problem gamblers. Journal of Gam- bling Studies, 21(4), 503–520. doi:10.1007/s10899-005- 5560-8
Williams, R. J., & Volberg, R. A. (2010). Best practices in the population assessment of problem gambling. Alberta, Canada:
Alberta Gaming Research Institute.