Multiple Sclerosis and Related Disorders 57 (2022) 103442
Available online 5 December 2021
2211-0348/© 2021 The Authors. Published by Elsevier B.V. This is an open access article under the CC BY license (http://creativecommons.org/licenses/by/4.0/).
Connection between microstructural alterations detected by diffusion MRI and cognitive dysfunction in MS: A model-free analysis approach
P ´ eter Farag o ´
a, Eszter T oth ´
a,b, Nikoletta Szab ´ o N
a, Kriszti ´ an Kocsis
a,b, B ´ alint Kincses
a,c, Bence Bozsik
a, D ´ aniel Ver ´ eb
b, Tam ´ as Istv ´ an Biernacki
a, Andr ´ as Kir aly ´
a,b, D ´ aniel Sandi
a, Krisztina Bencsik
a, P ´ eter Kliv ´ enyi
a, L ´ aszl ´ o V ´ ecsei
a,d, Zsigmond Tam ´ as Kincses
a,b,*aDepartment of Neurology, Albert Szent-Gy¨orgyi Clinical Center, University of Szeged, Szeged, Hungary
bDepartment of Radiology, Albert Szent-Gy¨orgyi Clinical Center, University of Szeged, Szeged, Hungary
cDepartment of Psychiatry, Albert Szent-Gy¨orgyi Clinical Center, University of Szeged, Szeged, Hungary
dMTA-SZTE Neuroscience Research Group and Intersdiscplinary Excellence Centre
A R T I C L E I N F O Keywords:
PLS DTI TBSS BICAMS
A B S T R A C T
Background: Cognitive decline is a prominent symptom of MS. Clear connection between cognitive status and white matter microstructural changes has not been unequivocally observed to date.
Objective: To characterise the relationship between white matter microstructure and cognitive performance a partial least squares (PLS) approach was used.
Methods: 53 RR MS patients’ T1 and DTI images and BICAMS subtests were used in our analysis. Standard FSL pipeline was used to obtain diffusion parameters. A PLS approach was applied to reveal the diffusion parameter patterns responsible for the cognitive dysfunction.
Results: The first latent variable (LV) was mainly associated with demyelination, while the second and third explained axonal damage. While the first two LV represented mainly Brief Visuospatial Memory Test (BVMT) and Single Digit Modality Test (SDMT), the third LV depicted diffusion alterations mainly the verbal subtest. The first LVs spatial map showed demyelination in the corpus callosum. The second LVs spatial map showed the diffusion alterations in the thalamus. The third LV depicted diffusion alterations in the putative left superior longitudinal fascicle.
Conclusion: Visual memory demanding tasks versus language functions depend on distinct patterns of diffusion parameters and the spatial organisation. Axial diffusivity alterations, a putative marker of irreversible axonal loss explained around 20% of variability in the cognitive functions.
1. Introduction
Multiple sclerosis (MS) is a chronic demyelinating disease of the central nervous system. Its most frequent radiological manifestation is the appearance of the well-known T2-hyperintense white matter lesions (Montalban et al., 2018), however grey matter atrophy (Kincses et al., 2014; De Stefano et al., 2016; Toth et al., 2017) and microstructural disintegration of the normal appearing white matter (NAWM) (Roo- sendaal et al., 2009) are also observable.
Clinically, functional disability is prevalent and monitored using the Expanded Disability Status Scale (EDSS) (Kurtzke, 1983). Cognitive decline is also observed in MS (Strober et al., 2018), which can be revealed by neuropsychological assessment. The Brief International
Cognitive Assessment for MS (BICAMS) is a collection of cognitive tasks (Walker et al., 2016) containing three subtests: (I) the Symbol Digit Modality Test (SDMT) is a simple substitution task for measuring in- formation processing efficiency, (II) the Brief Visuospatial Memory Test (BVMT) is used for visuospatial memory evaluation, and (III) the Cali- fornia Verbal Learning Test (CVLT) measures verbal learning and memory. BICAMS has been validated and is being used for evaluation of cognitive performance in several languages (Sousa et al., 2018; Sandi et al., 2015).
Previous reports revealed associations between cognitive impair- ment and MRI parameters. Lesion burden and localisation is a weak predictor of cognitive functions (ZT Kincses et al., 2011). Several studies showed that various measures of global and focal brain atrophy
* Corresponding author.
E-mail address: kincses.zsigmond.tamas@med.u-szeged.hu (Z.T. Kincses).
Contents lists available at ScienceDirect
Multiple Sclerosis and Related Disorders
journal homepage: www.elsevier.com/locate/msard
https://doi.org/10.1016/j.msard.2021.103442
Received 12 April 2021; Received in revised form 26 November 2021; Accepted 1 December 2021
correlate with cognitive dysfunction in MS (Frau et al., 2018; Sormani et al., 2018; Damjanovic et al., 2017), but grey matter atrophy cannot explain the full scale of physical and cognitive decline on its own. The demyelination process in MS is extensive, appears in the lesions as well as in the NAWM (Toth et al., 2017; Kincses et al., 2020). Despite the concurrent cognitive decline and white matter pathology, the relation- ship between microstructural disintegration and cognitive function was only sparsely investigated (T´oth et al., 2019).
In our study, we aimed to find connection between BICAMS, the most frequently used cognitive test package and the pattern of DTI parameter alterations in MS. We aimed to identify patterns of the various diffusion parameters that is behind the cognitive dysfunction with a model-free approach of partial least squares (PLS). This method is also able to provide insight into the common pathology driving various cognitive functions.
2. Materials and methods 2.1. Subjects
Fifty-three relapsing-remitting multiple sclerosis patients were included in our study. All the patients were recruited from the MS Outpatient Clinic of the Department of Neurology, University of Szeged.
The diagnoses were set up by MS specialists, based on the revised McDonald criteria (Polman et al., 2005). All the patients received disease-modifying therapy and were in a clinically stable condition with no relapses recorded within 6 months before and after scanning. The detailed demographic data is depicted in Table 1.
The local ethics committee of the Medical University of Szeged approved the study (No. 56/2011). All participants gave their written informed consent in accordance with the Declaration of Helsinki.
2.2. Cognitive testing
All subtests (SDMT, CVLT, BVMT) of the BICAMS were acquired from all the patients.
The SDMT measures information processing speed. Pseudorandom- ized lines contain nine different symbols, which represent different digits. The correspondence between symbols and digits is attached to the
the further analysis steps.
2.3. Image acquisition
MR imaging was carried out on a 1.5 T GE Signa Excite HDxt scanner.
High resolution T1-weighted (FSPGR: TE: 4.1 ms, TR: 10.276 ms, ma- trix: 256 ×256, FOV: 25 ×25 cm, Flip angle: 15◦, in-plane resolution: 1
×1 mm, slice thickness: 1 mm), FLAIR (TE: 133 ms, TR: 6000 ms, TI:
1848 ms, matrix: 256 ×256, FOV: 25 ×25 cm, Flip angle: 90◦, in-plane resolution: 1 ×1 mm, slice thickness: 1 mm) and 60 direction diffusion- weighted images with 6 non-diffusion-weighted reference volumes (TE:
93.8 ms, TR: 16,000 ms, matrix: 96 ×96, FOV: 23 ×23 cm, Flip angle:
90◦, in-plane resolution: 2.4 ×2.4 mm slice thickness: 2.4 mm, b: 1000s/
mm2, NEX: 2, ASSET) were acquired for each patient. During the scanning noise was attenuated by earplugs and the head of the patients was restricted by foam pads.
2.4. DTI pre-processing
All pre-processing steps were performed using FSL (FMRIB software library, http://www.fmrib.ox.ac.uk/fsl). DTI data were corrected for eddy currents and movement artifacts by twelve degrees-of-freedom linear registration to the first non-diffusion weighted image for each image. Then, the non-brain part of the images was extracted by FSL’s brain extraction tool. The parameters (mean diffusivity - MD, axial diffusivity - AD, radial diffusivity - RD and fractional anisotropy - FA) were estimated using the FDT tool (Behrens et al., 2003).
Tract-based spatial statistics (TBSS) was used to reduce the misalignment errors and register all the images into common space (Smith et al., 2006). All subjects’ FA images were aligned to the 1 mm isovoxel FMRIB58_FA standard space template with non-linear regis- tration using a b-spline representation of the registration warp field. The standardized FA images were skeletonized, then thresholded to 0.2 probability. The resulting FA skeleton represents the group-wise central part of the white matter tracts. All subjects’ FA image was projected onto this skeleton, resulting in a 4D skeletonized image. The remaining diffusion data (radial diffusivity, axial diffusivity and mean diffusivity) was also projected onto this skeleton using the previously generated warp fields.
2.5. Partial least squares (PLS) analysis
The multivariate partial least squares (PLS) analysis was carried out by the Baycrest’s lab PLS software (McIntosh and Lobaugh, 2004). PLS is a statistical method that computes the optimal least-square fit to a part of the covariance matrix. It fits a linear regression model between the variables by decomposing them into new latent variables (LVs), which are conversely independent. The analysis can also compute the cross-block covariance between the design matrix containing the con- ditions (scores on the cognitive tests) and the “intensity” (diffusion pa- Table 1
Demographic data of the participants and the cognitive tests.
Demographic data of the patients (mean ±STD)
n (male) 53 (Behrens et al., 2003)
age (years) 41.69 ±10.96
disease duration (years) 11.87 ±9.85
EDSS 1.7 ±1.65
SDMT value 43.5 ±11.4
BVMT value 21.8 ±7.9
CLVT value 53.5 ±9.5
randomly, and the singular value decomposition was computed again for all cross-block covariance matrix (2000 times). In order to test for the stability of the results we used bootstrapping. Random sample with replacement was used and PLS was recalculated repetitively (500 bootstrapping steps). Significant clusters on the spatial maps were identified by FSL’s cluster command (Z>2.3).
3. Results
The three subtests of the BICAMS test were used as separate cova- riates in our analysis. The PLS analysis found twelve LVs. After the permutation and bootstrap testing, the first three LVs were identified as significant (p<0.05) and showed at least 5 percentage cross-block cor- relation. In the following sections we will only consider these.
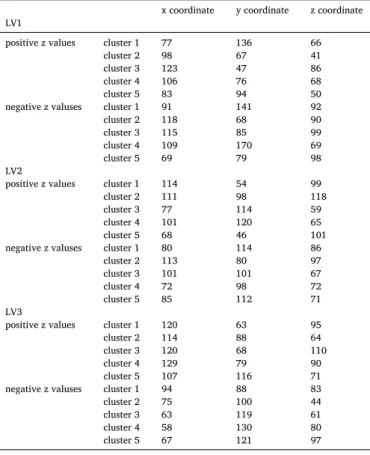
The voxel saliences were set to a significance level of p<0.05 value as determined by the bootstrapping analysis. After cluster analysis, arbi- trarily, only the five clusters greatest in intensity and size were repre- sented in each LV for voxel salience representation. The bootstrapping ratio resulted positive and negative z-scores, representing positive or negative effect to the correlations, both positive and negative thresh- olding was applied. The coordinates of peak intensity of each cluster was depicted to Table 2.
3.1. Latent variable #1
The first latent variable explained 63% cross-block correlation. The latent variable was represented by the following diffusion parameter correlations: FA: SDMT: r=− 0.57; BVMT: r= − 0.49; CVLT: r=− 0.38;
AD: SDMT: r =0.35; BVMT: r =0.63; CVLT: r =0.42; MD: SDMT: r = 0.49; BVMT: r =0.49; CVLT:r =0.42; RD: SDMT: r =0.53; BVMT: r = 0.5; CVLT: 0.41.
The corresponding voxel saliences represented the negative z-scores, Table 2
Localisation of maxima voxels of the latent variable’s cluster in MNI152 space.
x coordinate y coordinate z coordinate LV1
positive z values cluster 1 77 136 66
cluster 2 98 67 41
cluster 3 123 47 86
cluster 4 106 76 68
cluster 5 83 94 50
negative z valuses cluster 1 91 141 92
cluster 2 118 68 90
cluster 3 115 85 99
cluster 4 109 170 69
cluster 5 69 79 98
LV2 positive z values cluster 1 114 54 99
cluster 2 111 98 118
cluster 3 77 114 59
cluster 4 101 120 65
cluster 5 68 46 101
negative z valuses cluster 1 80 114 86
cluster 2 113 80 97
cluster 3 101 101 67
cluster 4 72 98 72
cluster 5 85 112 71
LV3 positive z values cluster 1 120 63 95
cluster 2 114 88 64
cluster 3 120 68 110
cluster 4 129 79 90
cluster 5 107 116 71
negative z valuses cluster 1 94 88 83
cluster 2 75 100 44
cluster 3 63 119 61
cluster 4 58 130 80
cluster 5 67 121 97
Fig. 1. The correlation values and the spatial distribution of the first latent variable. The effect of the cognitive tests and their connection to the diffusion parameters are shown in Figure1a. The Y axis and represents the correlation values (r values) between diffusion parameters (upper row X axis) and cognitive scores (lower row X axis). The voxel saliences (e.g.
spatial distribution) of the significant area shown in Figure 1b.
The threshold of the spatial maps was set to 2, depicted red to yellow and −2 to negative scores depicted in blue-lightblue..
wich were localised in the anterior corpus callosum, right frontal white matter next to the premotor area, left frontobasal white matter and both side in the deep parietal white matter. Positive z-scores were revealed in the right and anterior internal capsule, left occipital white matter and left cerebellar white matter.
The detailed area of correlation and r values depicted at Fig. 1.
3.2. Latent variable #2
The second latent variable explained 20,5% cross-block correlation.
The latent variable revealed highest correlation coefficients between FA:
SDMT: r =0.64; BVMT: r =0.55; CVLT: r =0.44; AD: SDMT: r =0.73;
BVMT: r =0.66; CVLT: r =0.47; MD: SDMT: r =0.63; BVMT: r =0.59;
CVLT:r =0.39; RD: SDMT: r =0.23; BVMT:r =0.26; CVLT: 0.11.
The voxel saliences represented negative z-scores, which were localised in the posterior corpus callosum and parietal white matter,
internal capsule and posterior corpus callosum. Positive z-scores were found in the left motor pathway in the internal capsule, left temporal white matter, left arcuate fasciculus and in the left occipito-parietal white matter. The results showed in Fig. 3.
4. Discussion
Our model-free analysis provides evidence for connection between MRI diffusion parameters and cognitive performance in multiple scle- rosis. The results pointed out that (i) diffusion parameters predicting performance on SDMT and BVMT tests could be well separated from those related to CVLT and (ii) patterns of diffusion parameters repre- senting demyelination and axonal damage in certain spatial arrange- ments corresponds to cognitive dysfunctions.
White matter microstructural disintegration is a well-known phe- nomenon in MS (Aliotta et al., 2014; Giorgio et al., 2010). As reported in Fig. 2. The correlation values and the spatial distribution of the second latent variable. The effect of cognitive tests and their connection to the diffusion parameters are shown in Figure1a. The Y axis represents the correlation values (r values) between diffusion parameters (upper row X axis) and cognitive scores (lower row X axis). The voxel saliences (e.g.
spatial distribution) of the significant area shown in Figure 2b.
The lower threshold of the spatial maps was set to 2, depicted red to yellow and −2 to negative scores depicted in blue- lightblue..
changes in all diffusion parameters (FA, MD, AD and RD), but slightly lower for AD. If AD and RD changed with the same magnitude, FA would have not been altered. Hence, spatial pattern reflected by the constel- lation of diffusion parameters is more likely driven by demyelination represented by higher correlation values for RD. Contrary, LV2 depicted changes in FA, AD and MD, a putative signature of axonal loss. LV3 showed slightly similar pattern as LV2, higher correlation values for AD most probably depict predominantly axon loss.
Importantly, LV2 accounted for approximately 20% of variability of the cross-block correlation matrix, meaning one quarter of the cognitive impairment’s variance may be explained by putative axonal damage, which has presumably little potential for regeneration.
Another aspect of our findings is the pattern of cognitive dysfunc- tions. LV1 and LV2 represented diffusion parameter pattern for all three cognitive functions but least importantly for CVLT. On the contrary LV3 depicted the microstructural alterations for the language function.
The relationship of white matter diffusion parameters and cognitive dysfunction have been investigated, however, reports are controversial.
Some studies found connection to clinical disability (Filippi et al., 2001;
Onu et al., 2012; Ciccarelli et al., 2001), whereas others did not (Griffin et al., 2001; Hasan et al., 2005). It is important to note that these studies used the EDSS, a widely used clinical scale measuring multiple domains as a descriptive measure of clinical condition. EDSS includes a summa- rized assessment of cognitive function, but it does not measure different aspects of it in detail, even though cognitive impairment is similarly, if not more important than physical disability in the progression of MS (Fricska-Nagy et al., 2016). Impaired cognitive performance in various domains such as verbal fluency (Blecher et al., 2019), information processing speed (Abel et al., 2019; Johnen et al., 2019) or multiple cognitive tests (Baumeister et al., 2019) was also associated with white matter pathology, although these studies mostly used ROI based approaches.
In our multivariate analysis, correlation with MS patients’ diffusion parameters showed distinct patterns in the case of BVMT and SDMT, and CVLT. The diffusion changes associated with CVLT amongst others showed a pattern involving the left parietal white matter corresponding to the putative superior longitudinal fascicle. This pattern is similar to what we have found in our earlier study describing correlation between language functions (verbal fluency) and lesions appearing in the left parietal white matter (ZT Kincses et al., 2011). If we incorporated other structural measures CVLT was also related to the volume of the right hippocampus (Toth et al., 2019).
A distributed pattern of diffusion alterations in case of SDMT and BVMT for LV1 and LV2 might be related to the distributed network of brain regions behind these complex cognitive tasks. The corpus cal- losum, the major white matter interconnecting structure emphasize the importance of these distributed networks. Similarly the thalamus is the major subcortical structure orchestrating brain functions in distributed cortical regions.
It is important to point out that the current analysis concentrated only on the diffusion parameters of the white matter. In a previous publication of our lab, using a similar PLS analysis, we investigated the connection between various structural MRI markers behind the BICAMS subtests (Toth et al., 2019). It has to be pointed out that white matter ´ diffusion parameters explain only part of the cognitive dysfunction in MS and the individual MRI markers might not even be independent (Toth et al., 2017).
The primary usage of PLS is the analysis of signal from functional imaging and evoked potential data (McIntosh et al., 1996; Ge et al., 2017; Vytvarova et al., 2017). A modified implementation of PLS is also suitable for analysis of structural MRI alterations connected to behav- ioural data, such as cognitive test results (Konukoglu et al., 2016; Park et al., 2015). More importantly, the approach has its major advantage in structural data such as DTI, in which multiple, not entirely independent Fig. 3. The correlation values and he spatial distribution of the third latent variable. The effect of cognitive tests and their connection to the diffusion parameters are shown in Figure1a.
The Y axis and represents the correlation values (r values) between diffusion parameters (upper row X axis) and cognitive scores (lower row X axis). The voxel saliences (e.g. spatial distribution) of the significant area shown in Figure 3b. The lower threshold of the spatial maps was set to 2, depicted red to red and − 2 to negative scores depicted in blue-lightblue.
parameters are describing tissue microstructure. Hence the pattern of diffusion parameters defining the cognitive dysfunction over multiple tests can be depicted and related to spatial distributions.
5. Conclusion
Microstructural damage of the white matter, not detectable on con- ventional imaging plays a crucial role in the cognitive dysfunction appearing in MS. The DTI approach has the advantage to differentiate between two major pathological processes in the white matter. With further research into the field, the in depth evaluation of contribution of the axon loss and demyelination may be used to help to stratify the therapy of MS patients.
CRediT authorship contribution statement
P´eter Farago: ´ Conceptualization, Formal analysis, Methodology, Writing – original draft, Funding acquisition. Eszter T´oth: Data cura- tion, Project administration, Writing – review & editing. Nikoletta Szabo N: Conceptualization, Data curation, Formal analysis. Kriszti´ ´an Kocsis: Data curation, Methodology. Balint Kincses: ´ Data curation, Investigation, Conceptualization. Bence Bozsik: Conceptualization, Data curation. Daniel Ver´ ´eb: Conceptualization, Data curation, Formal analysis, Writing – original draft, Visualization. Tam´as Istvan Bier-´ nacki: Conceptualization, Data curation, Writing – review & editing.
Andr´as Kiraly: ´ Conceptualization, Data curation, Formal analysis.
D´aniel Sandi: . Krisztina Bencsik: Conceptualization, Data curation, Validation. P´eter Kliv´enyi: Conceptualization, Funding acquisition, Supervision. L´aszl´o V´ecsei: Conceptualization, Data curation, Writing – review & editing. Zsigmond Tam´as Kincses: Conceptualization, Writing – review & editing, Supervision, Funding acquisition.
Declaration of Competing Interests
The author(s) declared no potential conflict of interest with respect to the research, authorship and/or publication to this article.
Acknowledgement
We thank MRI operators J´anos Laczi and Zolt´an T´oth for their invaluable help with the measurements.
Role of Funding Source
The study was supported by: Neuroscience Research Group of the Hungarian Academy of Sciences and the University of Szeged, GINOP- 2.3.2–15–2016–00034 grant, EFOP-3.6.1–16–2016–00008, NAP 2.0 (2017–1.2.1-NKP-2017–00002), National Brain Research Program (KTIA_13_NAP-A-II/20), UNKP-17–3 New National Excellence Program
De Stefano, N., Stromillo, M.L., Giorgio, A., Bartolozzi, M.L., Battaglini, M., Baldini, M., 2016. Establishing pathological cut-offs of brain atrophy rates in multiple sclerosis.
J Neurol Neurosur Ps 87 (1), 93–99.
Toth, E., Szabo, N., Csete, G., Kiraly, A., Farago, P., Spisak, T., 2017. Gray Matter Atrophy Is Primarily Related to Demyelination of Lesions in Multiple Sclerosis: a Diffusion Tensor Imaging MRI Study. Front Neuroanat 11, 23.
Roosendaal, S.D., Geurts, J.J., Vrenken, H., Hulst, H.E., Cover, K.S., Castelijns, J.A., 2009. Regional DTI differences in multiple sclerosis patients. Neuroimage 44 (4), 1397–1403.
Kurtzke, J.F., 1983. Rating neurologic impairment in multiple sclerosis: an expanded disability status scale (EDSS). Neurology 33 (11), 1444–1452.
Strober, L., DeLuca, J., Benedict, R.H., Jacobs, A., Cohen, J.A., Chiaravalloti, N., 2018.
Symbol Digit Modalities Test: a valid clinical trial endpoint for measuring cognition in multiple sclerosis. Mult. Scler. 1352458518808204.
Walker, L.A., Osman, L., Berard, J.A., Rees, L.M., Freedman, M.S., MacLean, H., 2016.
Brief International Cognitive Assessment for Multiple Sclerosis (BICAMS): canadian contribution to the international validation project. J. Neurol. Sci. 362, 147–152.
Sousa, C., Rigueiro-Neves, M., Miranda, T., Alegria, P., Vale, J., Passos, A.M., 2018.
Validation of the brief international cognitive assessment for multiple sclerosis (BICAMS) in the Portuguese population with multiple sclerosis. BMC Neurol. 18 (1), 172.
Sandi, D., Rudisch, T., Fuvesi, J., Fricska-Nagy, Z., Huszka, H., Biernacki, T., 2015. The Hungarian validation of the Brief International Cognitive Assessment for Multiple Sclerosis (BICAMS) battery and the correlation of cognitive impairment with fatigue and quality of life. Mult Scler Relat Disord 4 (6), 499–504.
Kincses, Z.T., Ropele, S., Jenkinson, M., Khalil, M., Petrovic, K., Loitfelder, M., 2011a.
Lesion probability mapping to explain clinical deficits and cognitive performance in multiple sclerosis. Mult. Scler. 17 (6), 681–689.
Frau, J., Fenu, G., Signori, A., Coghe, G., Lorefice, L., Barracciu, M.A., 2018. A cross- sectional and longitudinal study evaluating brain volumes, RNFL, and cognitive functions in MS patients and healthy controls. BMC Neurol. 18 (1), 67.
Sormani, M.P., De Stefano, N., Giovannoni, G., Langdon, D., Piani-Meier, D., Haering, D.
A., 2018. Learning ability correlates with brain atrophy and disability progression in RRMS. J. Neurol. Neurosurg. Psychiatry.
Damjanovic, D., Valsasina, P., Rocca, M.A., Stromillo, M.L., Gallo, A., Enzinger, C., 2017.
Hippocampal and Deep Gray Matter Nuclei Atrophy Is Relevant for Explaining Cognitive Impairment in MS: a Multicenter Study. Am. J. Neuroradiol. 38 (1), 18–24.
Kincses, B., Spis´ak, T., Farag´o, P., Kir´aly, A., Szab´o, N., Ver´eb, D., 2020. Brain MRI Diffusion Encoding Direction Number Affects Tract-Based Spatial Statistics Results in Multiple Sclerosis. J. Neuroimaging 30 (4), 512–522.
T´oth, E., Farag´o, P., Kir´aly, A., Szabo, N., Ver´ ´eb, D., Kocsis, K., 2019. The Contribution of Various MRI Parameters to Clinical and Cognitive Disability in Multiple Sclerosis.
Front Neurol 9, 1172.
Polman, C.H., Reingold, S.C., Edan, G., Filippi, M., Hartung, H.P., Kappos, L., 2005.
Diagnostic criteria for multiple sclerosis: 2005 revisions to the “McDonald Criteria”.
Ann. Neurol. 58 (6), 840–846.
Behrens, T.E., Woolrich, M.W., Jenkinson, M., Johansen-Berg, H., Nunes, R.G., Clare, S., 2003. Characterization and propagation of uncertainty in diffusion-weighted MR imaging. Magn. Reson. Med. 50 (5), 1077–1088.
Smith, S.M., Jenkinson, M., Johansen-Berg, H., Rueckert, D., Nichols, T.E., Mackay, C.E., 2006. Tract-based spatial statistics: voxelwise analysis of multi-subject diffusion data. Neuroimage 31 (4), 1487–1505.
McIntosh, A.R., Lobaugh, N.J., 2004. Partial least squares analysis of neuroimaging data:
applications and advances. Neuroimage 23, S250–S263. Suppl 1.
Aliotta, R., Cox, J.L., Donohue, K., Weinstock-Guttman, B., Yeh, E.A., Polak, P., 2014.
Tract-based spatial statistics analysis of diffusion-tensor imaging data in pediatric- and adult-onset multiple sclerosis. Hum. Brain Mapp. 35 (1), 53–60.
Giorgio, A., Palace, J., Johansen-Berg, H., Smith, S.M., Ropele, S., Fuchs, S., 2010.
Relationships of brain white matter microstructure with clinical and MR measures in relapsing-remitting multiple sclerosis. J. Magn. Reson. Imaging 31 (2), 309–316.
Velicu, I.L., Neagu, M., Dobromir, M., Luca, D., Lupu, N., Chiriac, H., 2012. Structural, Magnetic and Magnetoelastic Behaviour of FeCuNbSiB Thin Films. Sensor Lett. 10 (3–4), 902–905.
Song, S.K., Yoshino, J., Le, T.Q., Lin, S.J., Sun, S.W., Cross, A.H., 2005. Demyelination increases radial diffusivity in corpus callosum of mouse brain. Neuroimage 26 (1),
Ciccarelli, O., Werring, D.J., Wheeler-Kingshott, C.A.M., Barker, G.J., Parker, G.J.M., Thompson, A.J., 2001. Investigation of MS normal-appearing brain using diffusion tenser MRI with clinical correlations. Neurology 56 (7), 926–933.
Griffin, C.M., Chard, D.T., Ciccarelli, O., Kapoor, B., Barker, G.J., Thompson, A.I., 2001.
Diffusion tensor imaging in early relapsing-remitting multiple sclerosis. Mult. Scler.
7 (5), 290–297.
Hasan, K.M., Gupta, R.K., Santos, R.M., Wolinsky, J.S., Narayana, P.A., 2005. Diffusion tensor fractional anisotropy of the normal-appearing seven segments of the corpus callosum in healthy adults and relapsing-remitting multiple sclerosis patients.
J. Magn. Reson. Imaging 21 (6), 735–743.
Fricska-Nagy, Z., Fuvesi, J., Rozsa, C., Komoly, S., Jakab, G., Csepany, T., 2016. The effects of fatigue, depression and the level of disability on the health-related quality of life of glatiramer acetate-treated relapsing-remitting patients with multiple sclerosis in Hungary. Mult Scler Relat Dis 7, 26–32.
Blecher, T., Miron, S., Schneider, G.G., Achiron, A., Ben-Shachar, M, 2019. Association Between White Matter Microstructure and Verbal Fluency in Patients With Multiple Sclerosis. Front Psychol 10.
Abel, S., Vavasour, I., Lee, L.E., Johnson, P., Ackermans, N., Chan, J., 2019. Myelin Damage in Normal Appearing White Matter Contributes to Impaired Cognitive Processing Speed in Multiple Sclerosis. J. Neuroimaging.
Johnen, A., Schiffler, P., Landmeyer, N.C., Tenberge, J.G., Riepl, E., Wiendl, H., 2019.
Resolving the cognitive clinico-radiological paradox - Microstructural degeneration of fronto-striatal-thalamic loops in early active multiple sclerosis. Cortex 121, 239–252.
Baumeister, T.R., Lin, S.J., Vavasour, I., Kolind, S., Kosaka, B., Li, D.K.B., 2019. Data fusion detects consistent relations between non-lesional white matter myelin, executive function, and clinical characteristics in multiple sclerosis. Neuroimage Clin 24, 101926.
Kincses, Z.T., Ropele, S., Jenkinson, M., Khalil, M., Petrovic, K., Loitfelder, M., 2011b.
Lesion probability mapping to explain clinical deficits and cognitive performance in multiple sclerosis. Mult Scler J 17 (6), 681–689.
Toth, E., Farago, P., Kiraly, A., Szabo, N., Vereb, D., Kocsis, K., 2019. The Contribution of Various MRI Parameters to Clinical and Cognitive Disability in Multiple Sclerosis.
Front Neurol 9.
McIntosh, A.R., Bookstein, F.L., Haxby, J.V., Grady, C.L., 1996. Spatial pattern analysis of functional brain images using partial least squares. Neuroimage 3, 143–157, 3 Pt Ge, S., Wang, R., Leng, Y., Wang, H., Lin, P., Iramina, K, 2017. A Double-Partial Least- 1.
Squares Model for the Detection of Steady-State Visual Evoked Potentials. IEEE J Biomed Health Inform 21 (4), 897–903.
Vytvarova, E., Marecek, R., Fousek, J., Strycek, O., Rektor, I., 2017. Large-scale cortico- subcortical functional networks in focal epilepsies: the role of the basal ganglia.
Neuroimage Clin 14, 28–36.
Konukoglu, E., Coutu, J.P., Salat, D.H., Fischl, B., 2016. Adni. Multivariate statistical analysis of diffusion imaging parameters using partial least squares: application to white matter variations in Alzheimer’s disease. Neuroimage 134, 573–586.
Park, B.Y., Seo, J., Yi, J., Park, H, 2015. Structural and Functional Brain Connectivity of People with Obesity and Prediction of Body Mass Index Using Connectivity. PLoS One 10 (11).