Research Article
New Prognostic Score for the Prediction of 30-Day Outcome in Spontaneous Supratentorial Cerebral Haemorrhage
Rita Szepesi,
1Ibolya Katalin Széll,
1Tibor Hortobágyi,
1,2László Kardos,
3Katalin Nagy,
1Levente István Lánczi,
4Ervin Berényi,
4Dániel Bereczki,
5and László Csiba
11Department of Neurology, University of Debrecen, Clinical Center, Debrecen 4032, Hungary
2Division of Neuropathology, Institute of Pathology, University of Debrecen, Clinical Center, Debrecen 4032, Hungary
3Hygiene and Infection Control Services, Ken´ezy Hospital, Debrecen 4031, Hungary
4Department of Biomedical Laboratory and Imaging Science, University of Debrecen, Clinical Center, Debrecen 4032, Hungary
5Department of Neurology, Semmelweis University, Budapest 1083, Hungary
Correspondence should be addressed to Tibor Hortob´agyi; hortobagyi@med.unideb.hu Received 17 October 2014; Revised 23 December 2014; Accepted 24 December 2014 Academic Editor: Alfredo Conti
Copyright © 2015 Rita Szepesi et al. This is an open access article distributed under the Creative Commons Attribution License, which permits unrestricted use, distribution, and reproduction in any medium, provided the original work is properly cited.
Aims. The purpose of the present study was to evaluate predictors of outcome in primary supratentorial cerebral haemorrhage.
Furthermore, we aimed to develop a prognostic model to predict 30-day fatality.Methods. We retrospectively analyzed a database of 156 patients with spontaneous supratentorial haemorrhage to explore the relationship between clinical and CT characteristics and fatal outcome within 30 days using multiple logistic regression analysis. The analyzed factors included volumetric data assessed by neuropathological and CT volumetry. A second CT scan in survivors or neuropathological ABC/2 volumetry in nonsurvivors was used along with the baseline CT to assess the growth index of haematoma.Results. Systolic blood pressure, serum potassium and glucose levels, platelet count, absolute and relative haematoma volumes, and presence and size of intraventricular haemorrhage statistically significantly predicted the fatal outcome within 30 days. Based on our results we formulated a six-factor scoring algorithm named SUSPEKT to predict outcome.Conclusions. After validation the SUSPEKT score may be applicable in general clinical practice for early patient selection to optimize individual management or for assessment of eligibility for treatment trials.
1. Introduction
Spontaneous intracerebral haemorrhage (ICH) accounts for 8% to 14% of all strokes and carries the highest mortality rate of major stroke subtypes [1]. The pharmacological and surgi- cal interventions are less efficient than in case of ischaemic stroke [2]. Half of the mortality occurs within the first 2 days as a result of brain herniation [3]. Thirty-five to 52% of patients are dead by 1 month and only 20% of patients live independently at 6 months [4].
Predictors of mortality and functional outcome have been studied widely [5–7], but no treatment has shown a proven benefit so far. Accordingly, comprehensive analysis of the potential predictive factors of short term fatal outcome is of great importance. Reviewing the data of ICH patients admit- ted to the Neurology Department, University of Debrecen
(UD), we retrospectively analyzed the relationship between clinical and CT characteristics and case fatality at 30 days.
The autopsy rate of our department is more than 90%;
therefore we could incorporate also the results of brain autop- sies into our analysis. This is a unique opportunity (compared with similar studies) in the era of declining brain autopsy rates [8]. Although all of our patients were immediately investigated by CT or MRI at acute admission (and repeated if required by the patient’s deteriorating condition), we also had opportunity to analyze the results of their brain autopsies, agreeing with the Agency for Healthcare Research and Quality U.S. Department of Health and Human Services:
“clinical diagnoses, whether obtained from death certificates or hospital discharge data, contain major inaccuracies com- pared with autopsy diagnoses” [9].
Volume 2015, Article ID 961085, 8 pages http://dx.doi.org/10.1155/2015/961085
Numerous pathological events might occur in the brain of ICH patients (e.g., enlargement of haemorrhage, secondary brainstem bleeding) between the first and second imaging [10] or between the last CT and death. On the other hand, there are ethical and financial limitations of daily CT/MRI during the agony phase for estimating the “final” pathological findings of our patients. So, in our study we combined the classicalin vivo (image-based) volumetric evaluations with the measurements performed on the same formalin-fixed brain slices after the death of patients. Taking advantage of this opportunity, the ABC/2 method was also applied, using the initial CT as a point of reference, to assess the growth index of the haematoma in the nonsurvivor group as a novel approach. To the best of our knowledge, no remarkable previous attempts have been made to use this method on cadaver brains with ICH.
Furthermore, we developed a new scoring system to predict the risk of death within 30 days after primary supra- tentorial ICH using variables found to be independently and significantly associated with outcome by multiple logistic regression analysis. All of these variables can practically be reported within the first few hours after admission. After validation, this scoring system has the potential to be useful for early classification of patients.
2. Subjects and Methods
2.1. Patient Population. Ethical permission for these investi- gations was granted by the Regional and Institutional Ethics Committee, University of Debrecen, Medical and Health Science Center. We retrospectively reviewed the data of 156 Caucasian patients (71 nonsurvivors and 85 survivors) with primary supratentorial ICH admitted to our Intensive Care Unit (ICU) in a 53-month period. The outcome was defined as 30-day fatality for any reason. All patients were older than 18 years of age and were transported to our ICU within 24 hours of stroke onset. If this point of time could not be ascertained, we used the last time when the patient was known to be well.
All patients routinely underwent a baseline nonenhanced CT within 30 minutes of arrival, and the CT confirmed the ICH.
A second CT was obtained on average on the 10th day after admission or when symptoms deteriorated. Exclusion criteria were traumatic ICH, subarachnoid haemorrhage (SAH), vas- cular malformation, tumour, haemorrhagic transformation of ischaemic stroke (on admission or any CT performed later), postthrombolytic haemorrhage in ischaemic stroke, infratentorial ICH, and primary intraventricular bleeding.
We did not include subjects who had undergone neurosur- gical evacuation or drainage. All patients were treated on specialized stroke units with multiparametric monitoring.
2.2. Data Collection. The following data were collected ret- rospectively from patients’ clinical notes partly based on the Debrecen Stroke Database [11, 12]: sex, age, current smok- ing, excessive alcohol consumption, systolic and diastolic arterial blood pressure, and pulse rate at arrival. Laboratory parameters were collected from the initial blood sampling:
serum sodium, potassium, glucose levels, sedimentation rate,
haemoglobin, white blood cell (WBC) and platelet counts, liver and kidney function tests, and coagulation parameters.
2.3. CT Analysis. Image analysis was carried out retrospec- tively by two consultant neuroradiologists of our Department of Biomedical Laboratory and Imaging Science, who were blinded to the outcome. CT scans were performed on two 16- slice MDCT (multidetector computed tomography) scanners (GE CT/e Dual, GE Lightspeed 16; GE Medical Systems).
Slice thickness was 5 to 10 mms for supratentorial and 2.5 to 4 mms for infratentorial regions. Images were transferred to an offline image processing workstation as DICOM (Digital Imaging and Communications in Medicine) files.
Haemorrhage segmentation was carried out using the 3D Slicer software package developed by Brigham and Women’s Hospital Surgical Planning Laboratory and MIT (Boston, Massachusetts, USA) [13]. This procedure allowed separa- tion of the intracranial space from the skull and nonbrain structures; however, this method required verification and manual detachment of incorrectly labelled areas before per- forming volumetry with the built-in “Measurevol” module.
The following variables were constructed: total intracra- nial volume; total haematoma volume; intraparenchymal haematoma volume; and intraventricular haematoma vol- ume, each expressed as cm3. Additionally, relative volumes were defined as the ratio of total, intraparenchymal, and intraventricular haematoma volumes to intracranial volume yielding variables (without unit).
2.4. Neuropathological Analysis. Autopsies were performed within 48 hours after death. In our Neuropathology Labora- tory, brains fixed in 10% formalin were cut into coronal slices.
During the examination we verified the clinical diagnosis.
Similarly to the in vivodiagnostic the ABC/2 method was used to estimate haematoma volumes [14, 15] based on the assumption that the volume of an intracranial haematoma can be approximated by an ellipsoid unless the haematoma is very irregular in shape. Ellipsoids can be described in terms of Cartesian coordinates using their three largest perpendicular axes [16]. Consecutive coronal slices were laid down with the posterior surface up, and maximal diameters of the haematoma on every slice were measured in mms: one in the horizontal direction and another perpendicular to that.
These two largest diameters were used as A and B in the ABC/2 formula and were not necessarily on the same brain slice; each slice has been photo documented. Although slices were originally 10 mms thick, we measured the thickness of each slice at four different locations assuming that the brains may have shrunk during fixation. The precise thickness of a slice was obtained as the average of these measurements.
The resulting numerical data were then summed to obtain the maximum diameter of the haematoma perpendicular to the previous ones, which was used as C in the ABC/2 formula.
In cases when the haematoma did not fully penetrate a slice, that is, the first and last brain slice containing the bleeding, we measured the depth of the portion of haematoma by sticking a probe into it. Due to fixation in formalin and brain slicing in cases of ventricular extension it was not always
Table 1: Summary of epidemiological and clinical data.
Characteristic Survivors Nonsurvivors 𝑃
Age∗ 65.3 (11.83) 69.2 (13.48) 0.054
Male (%) 57.6 52.5 0.593
Alcohol (%) 34.8 23.7 0.462
Smoking (%) 25.8 18.7 0.303
Systolic blood pressure (mm Hg) 168.6 (32.93) 181.6 (34.86) 0.036
Diastolic blood pressure (mm Hg) 93.8 (17.85) 95.3 (18.53) 0.627
Haemoglobin (g/L) 140.0 (16.55) 137.5 (17.61) 0.408
WBCs (109/L)∗ 9.5 (3.39) 9.3 (4.07) 0.292
Platelets (109/L) 236.1 (87.34) 205.9 (77.31) 0.049
Glucose (mmol/L) 7.4 (2.86) 8.9 (4.64) 0.043
Potassium (mmol/L)∗ 4.1 (0.35) 4.0 (0.57) <0.0001
The relationship between fatal outcome within 30 days and some selected discrete or continuous clinical variables. Age, sex, alcohol consumption, smoking, and pulse rate at admission were not significantly associated with mortality. High systolic blood pressure, abnormal serum potassium concentration, high serum glucose concentration, and lower platelet count at admission were predictors of lethal outcome. Serum potassium differences between survivors and deceased subjects did not manifest as different group mean levels because the latter group was a mixture of many hypo- and hyperkalaemic subjects whose values averaged out at a near normokalaemic level. WBC: white blood cell. Values are expressed as mean (SD) or percentages.∗𝑃value is from logistic regression including quadratic term.
exactly discernible which part of the haematoma was in the parenchyma and in the ventricles, respectively. Therefore the haematoma volume calculated by the ABC/2 method was equal to the sum of the intraparenchymal and intraventricular parts. Volumes of haemorrhages were converted from mm3 to cm3. In these cases the relative haematoma volume was calculated using the initial CT intracranial volumetry data (for methods see above).
2.5. Statistical Analysis. The growth index of haematomas was calculated in two steps according to the following logistic formulas (log indicates natural logarithm):𝐿 =log(hpb2/(1−
hpb2)) − log(hpb1/(1 − hpb1)), and growth index = exp(𝐿)/(1 + exp(𝐿)) − 0.5, where hpb is haematoma per brain; hpb2 is ratio of total haematoma volume obtained by the second volumetry (follow-up CT scan in survivors, neu- ropathological ABC/2 method in nonsurvivors) to intracra- nial volume based on the follow-up CT (survivors) or the first CT (nonsurvivors); hpb1 is ratio of total haematoma volume to intracranial volume based on the first CT volumetry (sur- vivors and nonsurvivors). Negative growth indices denote reduction of haematoma; positive growth indices denote haematoma expansion.
Variables were described using mean and SD (contin- uous variables) or category percentages (categorical vari- ables) stratified for survivors and nonsurvivors. Associations between explanatory factors and the outcome of death within 30 days were evaluated using logistic regression. Curvatures in relationships were assessed and allowed for by transfor- mation or by adding a squared term if this substantially improved model fit. Variables showing remarkable asso- ciations in unadjusted models were selected for multiple regression modeling unless they are collinear with each other, in which case elimination was carried out on grounds of clinical practicability. Left-out variables were assessed for their potential contribution by adding to the prefinal multiple
model one by one and left in if found clinically remarkable or statistically significant. The final multiple logistic regression model was checked for goodness of fit using the Hosmer- Lemeshow test. The level of significance was set at𝑃 = 0.05.
To create the scoring system, model-predicted probabilities of outcome were generated for all subjects, and statistics for the minimum, the 10th, 20th,. . ., 90th percentage points, and the maximum were derived from the resulting set of values. The coefficients of the final model were built into a spreadsheet- based calculation interface which places any patient, with given input data, in terms of probability-of-death percentage range, given the percentage points observed on our sample of patients. All analyses were performed using Stata Statistical Software (StataCorp. 2009).
3. Results
Of the 81 survivor patients, eight were excluded because they did not have a second CT. Of the 75 nonsurvivor patients we excluded two based on brain autopsy results: ruptured aneurysm of the middle cerebral artery and a metastatic tumour, respectively, had been confirmed. Twelve brains were unsuitable for volumetry due to fragmented, multilobar haematomas or having been damaged during removal from the skull, cases in which the ABC/2 method fails to accurately estimate haemorrhage volumes [17]. In addition, medical records were not sufficiently detailed in a total of nine cases.
Thus, we analyzed the complete dataset of 59 nonsurvivor and 66 survivor patients.
The relationship between fatal outcome within 30 days and some selected discrete or continuous clinical variables is presented inTable 1. The relationship between age and greater odds of death was of borderline significance. Other variables, including sex, alcohol consumption, smoking, and pulse rate at admission, were not significantly associated with mortality.
Higher systolic blood pressure at admission was a predictor of lethal outcome.
Table 2: Baseline CT data.
Characteristic Survivors Nonsurvivors P
Time from ictus to initial CT, hours 6.6 (7.3) 2.8 (2.6) 0.004
Total haematoma volume, cm3 16.3 (17.6) 57.8 (41.8) <0.0001
Intraparenchymal haematoma volume, cm3 12.8 (14.2) 38.6 (30.6) <0.0001
Intraventricular haematoma volume, cm3 3.6 (11.1) 19.2 (27.9) 0.002
Presence of intraventricular blood (%) 24.2 61.0 <0.0001
Relative total haematoma volume 0.012 (0.013) 0.043 (0.032) <0.0001
Relative intraparenchymal haematoma volume 0.009 (0.010) 0.029 (0.023) <0.0001
Haematoma growth index −0.2 (0.16) 0.1 (0.18) <0.0001
Differences in CT characteristics of survivors and nonsurvivors. The mean time from symptom onset to initial CT, growth index of haematoma volumes of total and intraparenchymal haematoma on baseline CT, and the early presence of intraventricular haemorrhage and its volume were strongly associated with fatal outcome. Values are expressed as mean (SD) or percentages.
Table 3: Total and relative haematoma volumes.
Characteristic Survivors Nonsurvivors
Baseline CT Follow-up CT Baseline CT Pathology
Total haematoma volume, cm3 16.3 (17.6) 9.3 (11.2) 57.8 (41.8) 89.0 (56.45)
Relative total haematoma volume 0.012 (0.013) 0.007 (0.008) 0.043 (0.032) 0.067 (0.042)
Presence of intraventricular blood (%) 24.2 9.1 61.0 88.1
Differences in volumetric findings of survivors and nonsurvivors. Intraventricular extension of the haematoma was more frequent in the nonsurvivor group both on initial CT and on follow-up examinations. Relative volumes were defined as the ratio of total (intraparenchymal and intraventricular) haematoma volume to intracranial volume yielding unitless variables. Values are mean (SD).
There was no statistical significance regarding sex, cur- rent smoking, excessive alcohol consumption, diastolic arte- rial blood pressure, and pulse rate at arrival. Laboratory parameters were collected from the initial blood sampling:
serum sodium, potassium, glucose levels, sedimentation rate, haemoglobin, white blood cell (WBC) and platelet counts, liver and kidney function tests, and coagulation parameters.
Of these, serum potassium concentration was significantly associated with fatal outcome: high and low levels outside the normal range both represented elevated odds of death.
We identified higher serum glucose concentration and lower platelet count as further predictors of fatal outcome.
Tables2and3summarize the differences in CT charac- teristics and volumetric findings between survivors and non- survivors. The mean time from symptom onset to initial CT was strongly and inversely related to occurrence of death within 30 days. In the survivor group, the mean time between baseline and second CT was 10.7 (SD 5.05) days; in the nonsurvivor group, the mean time between symptom onset and death was 7.7 (SD 6.4) days. Differences between the two groups in absolute volumes of total and intraparenchymal haematoma on baseline CT were strongly significant, similarly to relative haematoma volumes. The growth index of haematoma was found to be a very strong predictor of the outcome. The early presence of intraventric- ular haemorrhage and its volume was also strongly associated with fatal outcome. There was an approximate 43% decrease in the mean volume of total haemorrhage from baseline to follow-up CT in survivors and a 54% increase from initial CT to death in the other group and, consistently, there was a 42%
decrease in survivors and a 56% increase in nonsurvivors in relative total haematoma volume. Intraventricular extension
of the haematoma was more frequent in the nonsurvivor group both on initial CT and on follow-up examinations.
3.1. The SUSPEKT Scoring System. The final multiple logistic regression model showed statistically significant associations between 30-day case fatality and a number of variables: serum glucose (Sugar); total haematoma volume (Size); systolic blood Pressure; presence of intraventricular haemorrhage (Extension to the ventricular system); and serum potassium level (Kalium). Using these and adding age (lifeTime) which was of borderline significance we developed the six-factor scoring systemSUSPEKT. The SUSPEKT scoring system in use to make predictions after primary supratentorial ICH is demonstrated in Tables4and5. Values of𝑥represent means observed in the present study, hence the decimal fraction for intraventricular haemorrhage;𝑒denotes Euler’s number.
4. Discussion
Predictors of fatal outcome in primary ICH have been widely studied [6, 18–24]. However no reliable and widely used scoring system has been established as yet. Our aim was to assess a relatively simple, reproducible, cost-effective predic- tive scoring system by analysis of a wide range of clinical and epidemiological data. Our results show that systolic blood pressure, serum potassium and glucose levels, and platelet count independently and statistically significantly predict the 30-day fatal outcome in primary supratentorial ICH. Therefore, we propose a predictive scoring system for clinical outcome in ICH using six parameters (serum glucose;
total haematoma volume; systolic blood pressure; presence of intraventricular haemorrhage; serum potassium level; and
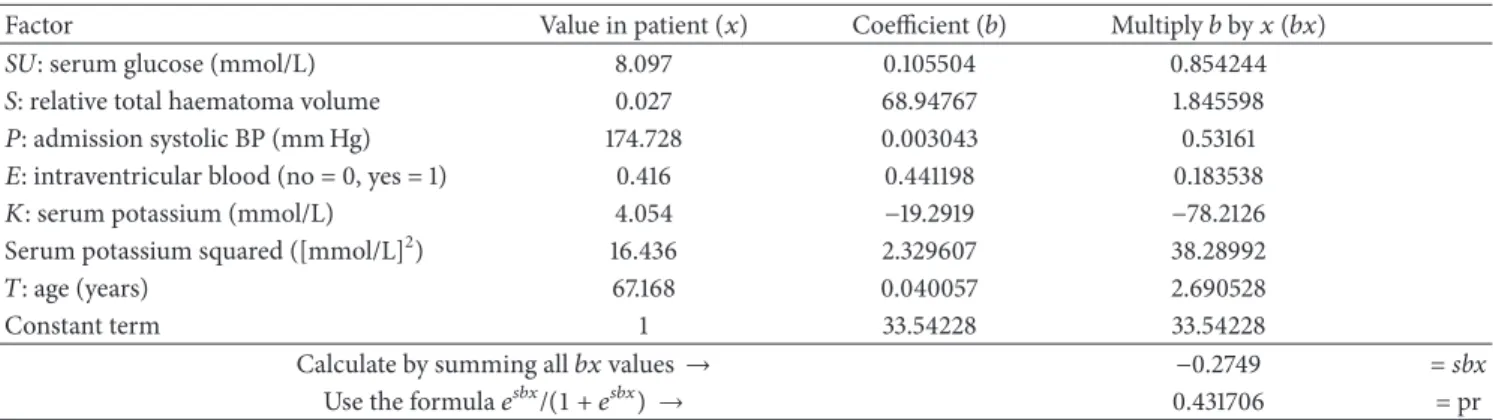
Table 4: Example 1 for the use of SUSPEKT score.
Factor Value in patient (𝑥) Coefficient (𝑏) Multiply𝑏by𝑥(𝑏𝑥)
SU: serum glucose (mmol/L) 8.097 0.105504 0.854244
𝑆: relative total haematoma volume 0.027 68.94767 1.845598
𝑃: admission systolic BP (mm Hg) 174.728 0.003043 0.53161
𝐸: intraventricular blood (no = 0, yes = 1) 0.416 0.441198 0.183538
𝐾: serum potassium (mmol/L) 4.054 −19.2919 −78.2126
Serum potassium squared ([mmol/L]2) 16.436 2.329607 38.28992
𝑇: age (years) 67.168 0.040057 2.690528
Constant term 1 33.54228 33.54228
Calculate by summing all𝑏𝑥values→ −0.2749 =sbx
Use the formula𝑒𝑠𝑏𝑥/(1 + 𝑒𝑠𝑏𝑥) → 0.431706 = pr
The final multiple logistic regression model showed statistically significant associations with 30-day case fatality for a number of variables. An example of the SUSPEKT scoring system is presented. Values of𝑥represent means observed in the present study, hence the decimal fraction for intraventricular haemorrhage;
𝑒denotes Euler’s number. Enter patient’s values and derive probability (pr) using the coefficients and follow the instructions.
Table 5: Example 1 for the use of SUSPEKT score.
0.036732 Minimum
0.095083 10th percentile
0.133933 20th percentile
0.190302 30th percentile
0.263309 40th percentile
0.376832 50th percentile
0.516875 60th percentile
0.769061 70th percentile
0.918411 80th percentile
0.975373 90th percentile
0.999965 Maximum
Table 5illustrates a working example of the SUSPEKT scoring system.
Refer pr (probability) (0.432, seeTable 4) to the table: patient is between the 50th and 60th percentiles of the SUSPEKT learning dataset for probability of death.
age) with the acronym SUSPEKT. In the subsequent para- graphs we discuss the individual components of SUSPEKT score and some of the other analyzed candidate parameters which did not show significant correlation with outcome prediction.
Of the laboratory parameters, we found serum glucose (SU) level on admission to be significantly associated with lethal outcome and this result is also supported by previ- ous studies [25, 26], while others reported that, in ICH, hyperglycaemia is not a significant and independent outcome predictor [6,18,27]. Recently Lee et al. confirmed in stroke patients by magnetic resonance imaging and spectroscopy study that acute hyperglycaemia adversely affects stroke outcome [28].
We also found that absolute and relative haematoma vol- umes (“S” for size), haematoma growth index, and presence and size of intraventricular haemorrhage are predictors of death within 30 days after ICH. We recommend the use of absolute haematoma volume since it is easier to calculate and its predictive value is similar to relative volume. Haematoma
volume is a well-known essential predictor of outcome in patients with ICH [5,6,18–20,29–33].
According to previous findings, high systolic [34] and mean arterial [27] blood pressure (P) on admission are asso- ciated with outcome, and admission diastolic blood pressure is associated with larger ICH volume [35]. We found only sys- tolic blood pressure to strongly predict 30-day fatal outcome.
Presence and size of intraventricular haemorrhage (“E”
for expansion) are also strongly associated with outcome in both overall and supratentorial cerebral haemorrhages [18, 20, 21, 26, 36, 37]. Haematoma expansion is a strong determinant of both mortality and poor functional outcome after ICH [7]. Brott et al. found a trend toward higher mortality at 4 weeks in patients with haemorrhage growth [38].
We observed a previously unreported, very strongly sig- nificant association between serum potassium (“K”) level and 30-day lethal outcome, which was related to both high and low levels outside the normal range, although others found that higher dietary potassium intake is associated with lower rates of stroke [39]. Similar (clinicopathological) observation has been published earlier by our group on patients with haemorrhagic transformation [40].
Our result could be explained by the fact that high and low potassium levels are associated with morbidity and mortality also through cardiac effects: ventricular fibrillation and cardiac arrest. At extreme serum potassium levels death probably occurred because of cardiac dysfunction and not directly due to intracranial mass effect.
Age (“T” for lifetime) had a borderline predictive𝑃value of 0.054 consistent with previous observations that the role of age in outcome after ICH is controversial. Some prior studies reported that age was significantly and independently correlated with fatal outcome, while others did not find this association [5–7,18–20,29–31,41] or only for patients aged
≥80 years [6]. We found that the relationship between age and death within 30 days is of borderline significance.
We identified low platelet count as a predictor of fatal outcome and it is also reported that low platelet count and
platelet dysfunction significantly correlate with haematoma growth [42]. Low haemoglobin showed no association with lethal outcome within 30 days. Although Kumar et al. [35]
reported that anaemia and WBC count were associated with larger haematomas, none of these variables were predictors of 30-day mortality in concert with our results.
Time from symptom onset to initial CT was inversely and strongly associated with fatal outcome. This paradoxical relationship could be explained by cases of rapidly worsening complaints or severe signs caused by massive haemorrhages having presented to hospital sooner and, in contrast, slower response by patients experiencing mild impairment due to small haemorrhages.
There was no correlation between smoking and 30-day mortality. In a Japanese study smoking was an independent risk factor for death in both the ischaemic and haemorrhagic stroke [36], while other reports found no association [31,37, 43]. Ikehara et al. reported that heavy alcohol consumption is significantly associated with increased mortality from haemorrhagic stroke for men [44]; however, in the present study we found no association between alcohol consumption and fatal outcome in ICH, which is in accordance with the results of Hansagi et al. [45].
Several prognostic models have been developed to predict fatal outcome after ICH, the most reliable and simplest being the ICH score by Hemphill et al. [6,19,22–24]. Prognostic scores limited to supratentorial haemorrhages are also known [18, 20, 21]. These studies focused on several factors: age [6,19,20,22], sex [20], level of consciousness (GCS, NIHSS consciousness score) [6, 18, 19, 22], volume or location of haemorrhage [6, 18–20, 23], presence of intraventricu- lar haemorrhage [6, 18–21, 24], presence of hydrocephalus on initial computed tomography scan [23], subarachnoid extension of haemorrhage [24], high NIHSS total score [22, 24], focal neurological deficit on admission [23], and pulse pressure [6, 24] were predictors of poor clinical prognosis;
low temperature at admission and low NIHSS total score were predictors of good clinical outcome (modified Rankin score≤ 2) [24]. Compared with the previously used prognostic score, undoubtable forcefulness of SUSPEKT score is that it includes serum potassium level which is a novelty and hyperglycaemia which can be corrected [2]. Another advantage of our scoring system is that it consists of only 6 parameters and except haematoma volume these can be managed and influenced by conservative (i.e., nonsurgical) therapeutic interventions.
Early prognostication after ICH is riddled with uncer- tainties. Given this and the self-fulfilling pessimistic general opinion of poor outcome, reliable early prognostication after ICH can help to avoid a fatalistic approach by the wider care team including family members and enables evidence based DNR (do not resuscitate) orders. Thus, deliberated guideline- concordant therapy is essential for all ICH patients [2]. Early prognostication helps clinicians to reach an objective opinion of predictable outcome.
Our findings are limited by some shortcomings. Prehos- pital deaths, exclusion of large, multilobar haematomas, and missing second CT in the survivor group may have led to possible selection bias.
5. Conclusion
We have demonstrated that systolic blood pressure, serum potassium and glucose levels, platelet count, absolute and relative haematoma volumes, haematoma growth index, and presence and size of intraventricular haemorrhage indepen- dently predict 30-day fatal outcome in primary supratentorial ICH. We developed the SUSPEKT score which after vali- dation on large independent datasets may be applicable in clinical practice for patient selection to optimize individual management and for assessment of eligibility for clinical trials.
Conflict of Interests
The authors declare that there is no conflict of interests regarding the publication of this paper.
Authors’ Contribution
Rita Szepesi, Ibolya Katalin Sz´ell, and Tibor Hortob´agyi made equal contributions to this work and are equally considered to be first authors.
Acknowledgments
This work has been supported by the National Brain Research Program, Hungary (KTIA 13 NAP-A-II/7 and KTIA-NAP- 13-1-2013-0001), and by the Nonprofit Foundation of the Neurology Department, University of Debrecen.
References
[1] W. Rosamond, K. Flegal, G. Friday et al., “Heart disease and stroke statistics—2007 Update: a report from the American Heart Association Statistics Committee and Stroke Statistics Subcommittee,”Circulation, vol. 115, no. 5, pp. e69–e171, 2007.
[2] T. Steiner, R. Al-Shahi Salman, R. Beer et al., “European Stroke Organisation (ESO) guidelines for the management of spontaneous intracerebral hemorrhage,”International Journal of Stroke, vol. 9, no. 7, pp. 840–855, 2014.
[3] J. P. Broderick, H. P. Adams Jr., W. Barsan et al., “Guidelines for the management of spontaneous intracerebral hemorrhage:
a statement for Health Professionals from a Special Writing Group of the Stroke Council, American Heart Association,”
Stroke, vol. 30, no. 4, pp. 905–915, 1999.
[4] S. Kazui, H. Naritomi, H. Yamamoto, T. Sawada, and T. Yama- guchi, “Enlargement of spontaneous intracerebral hemorrhage:
incidence and time course,”Stroke, vol. 27, no. 10, pp. 1783–1787, 1996.
[5] J. P. Broderick, T. G. Brott, J. E. Duldner, T. Tomsick, and G.
Huster, “Volume of intracerebral hemorrhage: a powerful and easy-to-use predictor of 30-day mortality,”Stroke, vol. 24, no. 7, pp. 987–993, 1993.
[6] J. C. Hemphill III, D. C. Bonovich, L. Besmertis, G. T. Manley, and S. C. Johnston, “The ICH score: a simple, reliable grading scale for intracerebral hemorrhage,”Stroke, vol. 32, no. 4, pp.
891–897, 2001.
[7] S. M. Davis, J. Broderick, M. Hennerici et al., “Hematoma growth is a determinant of mortality and poor outcome after
intracerebral hemorrhage,”Neurology, vol. 66, no. 8, pp. 1175–
1181, 2006.
[8] K. Petros and C. Wittekind, “Autopsy—a procedure of med- ical history?”Medizinische Klinik—Intensivmedizin und Not- fallmedizin, vol. 109, no. 2, pp. 115–120, 2014 (German).
[9] K. G. Shojania, E. C. Burton, K. M. McDonald, and L. Gold- man, “The autopsy as an outcome and performance measure,”
Evidence Report/Technology Assessment (Summary), no. 58, pp.
1–5, 2002.
[10] B. F¨ulesdi, K. R. Kov´acs, D. Bereczki, P. B´agyi, I. Fekete, and L.
Csiba, “Computed tomography and transcranial doppler find- ings in acute and subacute phases of intracerebral hemorrhagic stroke,”Journal of Neuroimaging, vol. 24, no. 2, pp. 124–130, 2014.
[11] D. Bereczki, L. Mih´alka, I. Fekete et al., “The Debrecen Stroke Database: demographic characteristics, risk factors, stroke severity and outcome in 8088 consecutive hospitalised patients with acute cerebrovascular disease,” International Journal of Stroke, vol. 4, no. 5, pp. 335–339, 2009.
[12] L. Mih´alka, I. Fekete, T. Cs´ep´any, L. Csiba, and D. Bereczki,
“Basic characteristics of hospital stroke services in Eastern Hungary,”European Journal of Epidemiology, vol. 15, no. 5, pp.
461–466, 1999.
[13] S. Pieper, B. Lorensen, W. Schroeder, and R. Kikinis, “The NA- MIC Kit: ITK, VTK, pipelines, grids and 3D slicer as an open platform for the medical image computing community,” inPro- ceedings of the 3rd IEEE International Symposium on Biomedical Imaging: Nano to Macro, pp. 698–701, IEEE, Arlington, Va, USA, April 2006.
[14] R. U. Kothari, T. Brott, J. P. Broderick et al., “The ABCs of measuring intracerebral hemorrhage volumes,”Stroke, vol. 27, no. 8, pp. 1304–1305, 1996.
[15] J. M. Gebel, C. A. Sila, M. A. Sloan et al., “Comparison of the ABC/2 estimation technique to computer-assisted volumetric analysis of intraparenchymal and subdural hematomas compli- cating the GUSTO-1 trial,”Stroke, vol. 29, no. 9, pp. 1799–1801, 1998.
[16] G. C. Newman, “Clarification ofabc/2 rule for ICH volume,”
Stroke, vol. 38, no. 3, p. 862, 2007.
[17] H. B. Huttner, T. Steiner, M. Hartmann et al., “Comparison of ABC/2 estimation technique to computer-assisted planimetric analysis in warfarin-related intracerebral parenchymal hemor- rhage,”Stroke, vol. 37, no. 2, pp. 404–408, 2006.
[18] S. Tuhrim, J. M. Dambrosia, T. R. Price et al., “Intracerebral hemorrhage: external validation and extension of a model for prediction of 30-day survival,”Annals of Neurology, vol. 29, no.
6, pp. 658–663, 1991.
[19] J. L. Ruiz-Sandoval, E. Chiquete, S. Romero-Vargas, J. J. Padilla- Mart´ınez, and S. Gonz´alez-Cornejo, “Grading scale for predic- tion of outcome in primary intracerebral hemorrhages,”Stroke, vol. 38, no. 5, pp. 1641–1644, 2007.
[20] D. R. Lisk, W. Pasteur, H. Rhoades, R. D. Putnam, and J. C.
Grotta, “Early presentation of hemispheric intracerebral hem- orrhage: prediction of outcome and guidelines for treatment allocation,”Neurology, vol. 44, no. 1, pp. 133–139, 1994.
[21] S. Tuhrim, D. R. Horowitz, M. Sacher, and J. H. Godbold,
“Volume of ventricular blood is an important determinant of outcome in supratentorial intracerebral hemorrhage,”Critical Care Medicine, vol. 27, no. 3, pp. 617–621, 1999.
[22] C. Weimar, J. Benemann, and H. C. Diener, “German stroke study collaborations. Development and validation of the essen intracerebral hemorrhage score,”Journal of Neurology, Neuro- surgery & Psychiatry, vol. 77, no. 5, pp. 601–605, 2006.
[23] M. Shaya, A. Dubey, C. Berk et al., “Factors influencing outcome in intracerebral hematoma: a simple, reliable, and accurate method to grade intracerebral hemorrhage,”Surgical Neurology, vol. 63, no. 4, pp. 343–348, 2005.
[24] R. T. F. Cheung and L.-Y. Zou, “Use of the original, modified, or new intracerebral hemorrhage score to predict mortality and morbidity after intracerebral hemorrhage,”Stroke, vol. 34, no. 7, pp. 1717–1722, 2003.
[25] R. Fogelholm, K. Murros, A. Rissanen, and S. Avikainen,
“Admission blood glucose and short term survival in primary intracerebral haemorrhage: a population based study,”Journal of Neurology, Neurosurgery and Psychiatry, vol. 76, no. 3, pp.
349–353, 2005.
[26] L. G. Stead, A. Jain, M. F. Bellolio et al., “Emergency department hyperglycemia as a predictor of early mortality and worse func- tional outcome after intracerebral hemorrhage,”Neurocritical Care, vol. 13, no. 1, pp. 67–74, 2010.
[27] S. Tetri, S. Juvela, P. Saloheimo, J. Pyhtinen, and M. Hillbom,
“Hypertension and diabetes as predictors of early death after spontaneous intracerebral hemorrhage: clinical article,”Journal of Neurosurgery, vol. 110, no. 3, pp. 411–417, 2009.
[28] S.-H. Lee, B. J. Kim, H.-J. Bae, J. S. Lee, B.-J. Park, and B.-W.
Yoon, “Effects of glucose level on early and long-term mortality after intracerebral haemorrhage: the Acute Brain Bleeding Analysis Study,”Diabetologia, vol. 53, no. 3, pp. 429–434, 2010.
[29] O. G. Nilsson, A. Lindgren, L. Brandt, and H. S¨aveland,
“Prediction of death in patients with primary intracerebral hemorrhage: a prospective study of a defined population,”
Journal of Neurosurgery, vol. 97, no. 3, pp. 531–536, 2002.
[30] M. Gomis, A. Ois, A. Rodr´ıguez-Campello et al., “Outcome of intracerebral haemorrhage patients pre-treated with statins,”
European Journal of Neurology, vol. 17, no. 3, pp. 443–448, 2010.
[31] S. Juvela, “Risk factors for impaired outcome after spontaneous intracerebral hemorrhage,”Archives of Neurology, vol. 52, no. 12, pp. 1193–1200, 1995.
[32] M. Reinhard, F. Neunhoeffer, T. A. Gerds et al., “Secondary decline of cerebral autoregulation is associated with worse out- come after intracerebral hemorrhage,”Intensive Care Medicine, vol. 36, no. 2, pp. 264–271, 2010.
[33] J. M. Gebel Jr., E. C. Jauch, T. G. Brott et al., “Relative edema volume is a predictor of outcome in patients with hyperacute spontaneous intracerebral hemorrhage,”Stroke, vol. 33, no. 11, pp. 2636–2641, 2002.
[34] S. Tuhrim, J. M. Dambrosia, T. R. Price et al., “Prediction of intracerebral hemorrhage survival,”Annals of Neurology, vol.
24, no. 2, pp. 258–263, 1988.
[35] M. A. Kumar, N. S. Rost, R. W. Snider et al., “Anemia and hematoma volume in acute intracerebral hemorrhage,”Critical Care Medicine, vol. 37, no. 4, pp. 1442–1447, 2009.
[36] K. S. Wong, “Risk factors for early death in acute ischemic stroke and intracerebral hemorrhage: a prospective hospital- based study in Asia. Asian Acute Stroke Advisory Panel,”Stroke, vol. 30, no. 11, pp. 2326–2330, 1999.
[37] H. Ueshima, S. R. Choudhury, A. Okayama et al., “Cigarette smoking as a risk factor for stroke death in Japan NIPPON DATA80,”Stroke, vol. 35, no. 8, pp. 1836–1841, 2004.
[38] T. Brott, J. Broderick, R. Kothari et al., “Early hemorrhage growth in patients with intracerebral hemorrhage,”Stroke, vol.
28, no. 1, pp. 1–5, 1997.
[39] L. D’Elia, G. Barba, F. P. Cappuccio, and P. Strazzullo, “Potas- sium intake, stroke, and cardiovascular disease: a meta-analysis
of prospective studies,” Journal of the American College of Cardiology, vol. 57, no. 10, pp. 1210–1219, 2011.
[40] L. Kerenyi, L. Kardos, J. Sz´asz et al., “Factors influencing hemor- rhagic transformation in ischemic stroke: a clinicopathological comparison,”European Journal of Neurology, vol. 13, no. 11, pp.
1251–1255, 2006.
[41] J. Garibi, G. Bilbao, I. Pomposo, and C. Hostalot, “Prognostic factors in a series of 185 consecutive spontaneous supratentorial intracerebral haematomas,”British Journal of Neurosurgery, vol.
16, no. 4, pp. 355–361, 2002.
[42] W. C. Ziai, M. T. Torbey, T. S. Kickler, S. Oh, A. Bhardwaj, and R. J. Wityk, “Platelet count and function in spontaneous intracerebral hemorrhage,”Journal of Stroke and Cerebrovascu- lar Diseases, vol. 12, no. 4, pp. 201–206, 2003.
[43] A. G. Thrift, J. J. McNeil, and G. A. Donnan, “The risk of intracerebral haemorrhage with smoking. The melbourne risk factor study group,”Cerebrovascular Diseases, vol. 9, no. 1, pp.
34–39, 1999.
[44] S. Ikehara, H. Iso, H. Toyoshima et al., “Alcohol consumption and mortality from stroke and coronary heart disease among Japanese men and women: the Japan Collaborative Cohort Study,”Stroke, vol. 39, no. 11, pp. 2936–2942, 2008.
[45] H. Hansagi, A. Romelsjo, M. G. De Verdier, S. Andreasson, and A. Leifman, “Alcohol consumption and stroke mortality: 20- year follow-up of 15,077 men and women,”Stroke, vol. 26, no.
10, pp. 1768–1773, 1995.
Submit your manuscripts at http://www.hindawi.com
Stem Cells International
Hindawi Publishing Corporation
http://www.hindawi.com Volume 2014
Hindawi Publishing Corporation
http://www.hindawi.com Volume 2014
INFLAMMATION
Hindawi Publishing Corporation
http://www.hindawi.com Volume 2014
Behavioural Neurology
Endocrinology
International Journal ofHindawi Publishing Corporation
http://www.hindawi.com Volume 2014
Hindawi Publishing Corporation
http://www.hindawi.com Volume 2014
Disease Markers
Hindawi Publishing Corporation
http://www.hindawi.com Volume 2014
BioMed
Research International
Oncology
Journal ofHindawi Publishing Corporation
http://www.hindawi.com Volume 2014
Hindawi Publishing Corporation
http://www.hindawi.com Volume 2014
Oxidative Medicine and Cellular Longevity
Hindawi Publishing Corporation
http://www.hindawi.com Volume 2014
PPAR Research The Scientific World Journal
Hindawi Publishing Corporation
http://www.hindawi.com Volume 2014
Immunology Research
Hindawi Publishing Corporation
http://www.hindawi.com Volume 2014
Journal of
Obesity
Journal ofHindawi Publishing Corporation
http://www.hindawi.com Volume 2014
Hindawi Publishing Corporation
http://www.hindawi.com Volume 2014
Computational and Mathematical Methods in Medicine
Ophthalmology
Journal ofHindawi Publishing Corporation
http://www.hindawi.com Volume 2014
Diabetes Research
Journal ofHindawi Publishing Corporation
http://www.hindawi.com Volume 2014
Hindawi Publishing Corporation
http://www.hindawi.com Volume 2014
Research and Treatment
AIDS
Hindawi Publishing Corporation
http://www.hindawi.com Volume 2014
Gastroenterology Research and Practice
Hindawi Publishing Corporation
http://www.hindawi.com Volume 2014
Parkinson’s Disease
Evidence-Based Complementary and Alternative Medicine
Volume 2014 Hindawi Publishing Corporation
http://www.hindawi.com