Progress in Agricultural Engineering Sciences 14(2017)S1, 121–131 DOI: 10.1556/446.14.2018.S1.12
1786-335X @ 2018 Akadémiai Kiadó, Budapest
Enhancing Main Fermentation Velocities in Beer by the Use of a Membrane Bioreactor –
Approach and Preliminary Results (Membrane Bioreactor Beer)
LISA STUMPF AND STEFAN SCHILDBACH*
Abstract. The potential of the most recent membrane technology is still unaccounted for in many respects. Combining fermentation with up-to-date membrane technology building a membrane bioreactor allows the adjustment of the cell count on a high level, increasing yield per volume and time. Applied to beer manufacturing, main fermentation times of less than 20 h seem possible, avoiding the disadvantages of already known accelerated fermentation processes operated on a continuous basis.
Although module design was adapted and backwash procedure altered to gas-jet, maintaining a sufficient membrane flux over time still poses a major problem.
Nevertheless, preliminary results in respect of beer quality look promising.
Keywords: membrane bioreactor (MBR), beer, main fermentation
Introduction
Following wort production in the brewhouse, the main and second fermentation of beer takes place in the so called cold block. As the cold block is of a considerable size, high investment costs are required. Hence any shortening in fermentation time leads to proportional downsizing of the fermentation volume and hence to smaller investments, but also cooling capacities and therefore operation costs.
Until now in the brewing industry the state of the art production method is batchwise fermentation. Numerous attempts were made to shorten fermentation times, requiring up-to-date big size tank technology.
As a consequence, the overall production time has been cut down from between 20 to 31 days (6 to 10 days for main fermentation and 14 to 21 days for second fermentation) to 12 to 19 days nowadays (7 to 12 days combined main and second fermentation and 5 to 7 days cold storage before filtration). Main fermentation takes place within 3 to 4 days.
* Corresponding author. E-mail: stefan.schildbach@lt.hs-fulda.de Hochschule Fulda University of Applied Sciences, Germany
Further improvements were studied by testing continuously operated fermentations (e.g. Baker et al. 1973, Van de Winkel et al. 1993, Fitzner 1998, Ludwig 2003, Verbelen et al. 2006). In these tests wort from the brewhouse passed a fermenter equipped with immobilised yeast. An overview is given by Branyik et al. (2008). Times for the main fermentation are depending on the type of reactor and reach from 19 h to 55 h (Ludwig 2003). Nevertheless, sensory properties are different from beers fermented batchwise and hence do not fully meet consumer’s expectations.
Besides ethanol as the major component derived from fermentation, higher alcohols as well as esters are formed. These contribute significantly to the aroma of the final product. Furthermore, the pH is lowered by one unit during the main fermentation, which results from the yeast releasing organic acids and which is beneficial for beer quality, e.g. in respect to better bitter taste and improvement of the non-biological stability of the beer. These and other changes are directly related to the yeast growth during the first phases of the main fermentation process as they result from the anabolic metabolism. Hence Ludwig (2003) pointed out the relevance of a well-dosed aeration and therefore a controlled yeast growth during continuously operated beer fermentation processes. In his research he was able to significantly improve process stability of a continuous fermentation with immobilised yeast by applying a pH-controlled aeration scheme.
Nevertheless, long-term stability was still an issue, which presumably is caused by a non-defined yeast age and cell count in immobilised yeast fermenters. Due to the expected advantages, continuously operated main fermentations are back in the focus and part of recent research (Müller- Auffermann et al. 2013, Meyer 2017), giving the approach new momentum.
To take maximum advantage of the approach means to implement the main fermentation into an overall continuously operated brewery, including brewhouse steps like mashing, lautering and wort boiling as well as maturation.
Combining a fermenter with a membrane filtration allows the retention of biomass independently from any carrier material. Therefore, the concentration of the yeast can be adjusted independently from the throughput. Corresponding approaches are well known from aerobic waste water treatment with so called membrane bioreactors (MBR), in which membranes are submerged into the reactor.
Consequently, the main questions for the present project can be summarized as follows:
Enhancing Main Fermentation Velocities in Beer by the Use of a Membrane Bioreactor 123
• What means are necessary to achieve high flux of the submerged membranes on a permanent base in order to make the process economically attractive?
• Is it possible to decrease main fermentation time from the current 3 to 4 days to < 20 h, or rather to 10–12 h, in a continuously operated, membrane based system by increasing the yeast cell count?
• Is it possible to achieve a beer quality comparable to beers from batchwise fermentations in order to meeting consumer’s expectations?
Materials and Methods Membranes and modules
The membrane capillaries (homogeneous, asymmetrical) used for the modules had microfiltration size and were made out of polyethersulfone PES, Type 130403-05-D1 (sourced from MAHLE InnoWa GmbH, Schwaikheim, Germany). Average pore size according to the manufacturer is 0.4 µm. The bubble point of the wetted membranes was measured using Sartocheck 4 Plus Filter Tester (Sartorius Stedim Biotech, Göttingen, Germany). Based on the bubble point the nominal pore size was calculated according to Formula 1, resulting in 0.24 µm pore size.
4
Formula 1. D = pore size; σ = surface tension (water); θ = contact angle;
pBP = bubble point
The size of the capillaries was checked using a digital microscope (VHX-600 from Keyence International NV/SA, Osaka, Japan). Evaluation of the cross section of the capillaries yielded an average of 2.23 mm outer diameter, an inner diameter of 1.44 mm and a resulting membrane thickness of 0.40 mm.
Potting of the capillaries was done on-site using epoxy resin Brandopox EPL 101 (Marquardt, Potsdam, Germany) (see Figs 1 and 2). Modules 1st generation showed a higher packing density of 470 m2/m3. Later the packing density was lowered to 125 m2/m3 (modules 2nd generation).
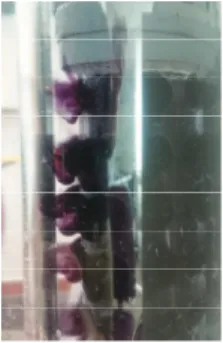
Visualization of the mixing was done using ink Brilliant Schwarz 4001 (Pelikan, Berlin, Germany).
Fig. 1. Test modules 1st generation (high packing density, 470 m2/m3)
Fig. 2. Potting of the capillaries using epoxy resin, modules 2nd generation with decreased packing density (125 m2/m3)
Operation mode
At the beginning the procedure consisted of alternating phases of removing green beer from and adding wort in small amounts into the reactor through the membrane. The idea behind this procedure was to keep the membrane free in both directions by reverse liquid streams. Later the operating scheme was changed in such manner, that only green beer was taken from the reactor passing the membrane, whereas the wort was dosed directly into the reactor. Green beer was withdrawn from the reactor using a flexible-hose pump (Heidolph Pumpdrive 5201, Schwabach, Germany).
Wort was obtained from a commercial brewery in Hesse (Germany), commonly used for Pils or Export beer type. Trials were done in a stirred tank reactor (STR) with a maximum size of 8 L, but usually filled with 5 L only to leave some headspace for foaming. Depending on the trials the reactor was equipped with different types of modules as shown exemplarily in Fig. 3.
The low flocculating yeast strain SMA-S (VLB - Versuchs- und Lehranstalt für Brauerei e.V., Berlin, Germany) from the strain collection from Research and Teaching Institute for Brewing (VLB, Berlin, Germany) was used. The yeasts were stored under cryogenic conditions at –70°C and
Enha prop the was
Orig usin Alco (este Labo Germ Germ dilu
Fig. 3 yeast Brau cryos relea scale
High Fig.
ancing Main Ferme pagated on dem
amount of yea set to 15 °C.
ginal gravity, r ng a beer analy
olyzer Beer ME ers and higher
oratory of Res many). Redox many) and ye uting the sampl
3. STR equipped t harvest by flex un, Melsungen, G stat for temperat ase); 7: submerge e for measuring th
her packing d 1) led to pro
entation Velocities mand using sev ast to inoculate
eal extract and yser Anton Pa E (Anton Paar, r alcohols) pres search and Tea potential was east cell count le with 0.1 n Na
with membrane m xible-hose pump Germany); 4: mea ture control; 6: c ed filtration mod
he amount of gree
Results Module de
density of 470 oblems during
in Beer by the Use veral propagat e the fermente
Analytics
d ethanol conce aar DMA 4500 Graz, Austria sented in Table aching Institut s measured inl t was done us aOH for better
modules; 1: wort p; 3: measuring p
asuring loop with cross splitter (filt
ule; 8: green bee en beer; scales for
and Discu esign and op
m2/m3 (mod g operation. T
e of a Membrane Bi tion steps in or er. Fermentatio
entration were density meter ). Volatile arom e 1 were analy te for Brewing line (SenTix O sing a Thoma dispersion of t
t feeding by flexib pH by control u h electrode for re trate withdrawal er drain by flexib r wort and yeast
ussion peration
dules 1st gener The capillaries
ioreactor 125 rder to increase on temperature
determined by r coupled with ma compounds ysed by Centra
g (VLB, Berlin ORP, Weilheim chamber after the cells.
ble-hose pump; 2 unit Biostat B (B edox potential; 5 l, air-jet, pressure ble-hose pump; 9
not shown
ration, refer to were flushed 5 e e
y h s al n, m, r
2:
B.
5:
e 9:
o d
insufficiently by the surrounding fermentation broth, leading to inhomogeneities of substrate concentration. This was especially problematic when following the first approach of alternating operation routine with wort and green beer being transferred to and from the reactor via the membranes. The whole module acted like a sponge, resulting in huge volumes of mixed phases of wort and green beer, and even thorough purging regimes did not show satisfactory results. As a consequence, the module design was changed, decreasing the packing density to 125 m2/m3 (modules 2nd generation, refer to Fig. 2). Primary focus was on the equal distribution of the flux over the capillary surface, which was shown in tests using ink (Fig. 4). As the distance between the capillaries was increased, backmixing in dead zones of the modules was minimized.
Nevertheless, accumulation of wort particles within the capillaries and consequently blocking of the inner surface of the membrane capillaries was still an issue. Wort contains a number of particles which is referred to as cold break, consisting mainly of proteins precipitating during wort cooling.
Smaller particles of below 1 µm interfere with the membrane pores (diameter 0.24 µm). Hence, the alternating operation was substituted by only the green beer being transferred through the membrane, but the wort was added directly into the fermenter.
Fig. 4. Flux over membrane surface using black ink for visualisation As a consequence a different backwash procedure had to be set up.
Backwashing with gas – air or carbon dioxide – showed promising results, as can be seen in Fig. 5. One filtration cycle consists of several phases, with phase 1 filtration of green beer, phase 2 interrupting filtration and backwashing with air (air-jet) and phase 3 pausing (neither filtration nor backwashing). Filtration takes place from the outside of the capillaries to the inside (out-in), whereas the backwashing by air is in in-out direction, using air pressure above the bubble point of the membranes (10 s at 4.0 bar). The
Enha pau air-j para for b
Fig. 5 in; b beer to se techn filtra trans by fle
25 L mod back
ancing Main Ferme sing phase is r et. Furthermo ameter for the backwashing, s
5. Flux of green b elow: excerpt sho out-in stops and ettle within the nological require ation cycle first sferred to the rec
exible-tube pump Flux rates du L/(m2*h). Neve
dule failed me kwash procedu
entation Velocities required for let re the length overall green b so the flux show
beer with regular owing backwash d an air-jet in-out e reactor and a ements (reaching
residues of gre eiving bottle, wh p)
uring the filtrat ertheless, after echanically, ob ure by air-jet (F
in Beer by the Use tting the foam of the pausin beer withdraw wn is already t
r backwashing by h procedure in m
is applied, follow adapting the ov
g final attenuati een beer from c hich is positioned
tion phases w r 20 h of ope bviously being Fig. 6).
e of a Membrane Bi settle, which is ng phase prov wal. No green b
the net flux.
y air-jet; above: f more detail (filtrat wed by a pause a verall green beer
ion); after the s connecting tubes d on a scale to me
were kept const eration, one ca g too weak fo
ioreactor 127 s caused by the vides a setting beer is required
filtration flux out tion step of green allowing the foam r withdrawal to start of the nex
s and hoses are easure the filtrate
tant at approx apillary in the or the applied 7 e g d
t- n m o xt e e,
x.
e d
After co uniform capi expected that
In a first set done batchw Compared t fermentation was increase results are sh
Fig. 7. Fermen appr. 40 to 15
In Fig. 8 reveal a line
onsultation wit illaries are ava
t they will show
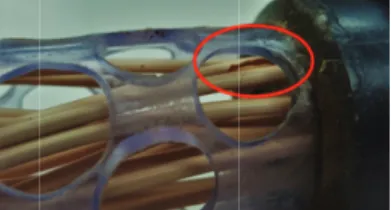
Fig. 6
T
of trials yeast c wise in order to to typical yea n in beer of app
ed quite signifi hown in Fig. 7.
ntations at differe 50 * 106 cells/mL;
106 cells/mL, res 8 all trials with ear relationshi
th the membra ilable now and w better mecha
6. Broken capillar
Technological
cell count was o evaluate the ast cell conce prox. 60 * 106 icantly up to m
ent yeast cell coun right: yeast cell c sulting in much s h different yea ip between ye
ane manufactu d will be used
anical durabilit
ry after air-jet
l results
increased and e impact on fe entrations dur cells/ml the n more than 300
nts; left: yeast cell count increasing f shorter fermentat ast cell count a east cell coun
urer, new and in further trial ty.
d fermentations rmentation ve ring common number of yeas
0 * 106 cells/m
l count increasing from appr. 240 to tion time are summarize nt and fermen
more ls. It is
s were elocity.
main st cells ml. The
g from o 370 *
ed and ntation
Enha velo drop
Fig
ancing Main Ferme ocity. At a yeas ps below 20 h.
g. 8. Fermentation
Table
N = norm Acetaldehy Ethyl aceta 1-Propano Isobutanol Isoamyl ace 2-Methyl-1 3-Methyl-1 2-Phenylet 2-Phenylet
entation Velocities st cell count of
n velocity depend
e 1. Analytical dat
mal values, L = lim Ana
(m
yde 3
ate 1
l 3
3 etate < 0
1-butanol 2
1-butanol 7
thanol 3
thyl acetate < 0
in Beer by the Use
> 300 * 106 cell
ding on yeast cell
ta green beer con
mit values; FT = F
alysis Re
g/L) (Krüge 33 N: 2 – 10 / 16 N: 10 – 40 33 N: 7 – 16 / 31 N: 5 – 20 /
0,3 FT: 1 – 2 28 N: 8 – 30 / 70 N: 30 – 70 33 N: 8 – 35 /
0,3 N: < 1
e of a Membrane Bi ls/ml main ferm
l count (batchwise
tinuous operation
Flavour threshold eference values
er and Anger 199 (mg/L) / green beer > 30 0 / L: 4 – 87
/ L: 3 – 48 / L: 1,5 – 84 / L: 7 – 41 0 / L: 44 – 123
/ L: 0,1 – 102
ioreactor 129 mentation time
e fermentation)
n
d 90) 0
9 e
Transferring the results to continuous operation using membranes, a similar fermentation speed was achieved (results not shown). The corresponding green beer quality concerning esters and higher alcohols are comparable to typical values for green beers produced batchwise (see Table 1). Sensory evaluation did not show any abnormalities. But it has to be pointed that this is only a snap-shot. Due to the short overall operation time, no conclusion regarding the long-term stability of the process is possible at the moment.
Conclusions
Lowering the packing density helped to avoid concentration gradient forming of wort and green beer within the fermenter. By adapting the backwash regime, especially by using an air-jet as backwash, a filtrate flux of 25 L/(m2*h) was maintained. Nevertheless, after 20 h of operation time one of the capillaries failed as it could not stand the stress applied by the air-jet. A new generation of membrane capillaries is expected to show better mechanical stress resistance.
From the technological point of view final attenuation can be reached within less than 20 h of main fermentation time by increasing the yeast cell count to approx. 300 * 106 cells/mL. This was shown by batchwise fermentations performed at different yeast cell counts. Beer quality in respect of the main aroma compounds look comparable, although no long- term data are available at the moment, emphasizing the need for further investigation. To further assess the technological consequences, the MBR has to be operated over a longer period of time. In order to run the process overnight and on weekends, automation is currently underway and will be the basis for further investigations.
Acknowledgement
Many thanks to Nicolas Werner, Rainer Schmitt and Sebastian Kaiser, who were working on the project in connection with their referring master thesis.
We owe gratitude to Wissenschaftsförderung der Deutschen Brauwirtschaft for financial support.
Enhancing Main Fermentation Velocities in Beer by the Use of a Membrane Bioreactor 131
References
Baker, D. A., Kirsop, B. H. (1973) Rapid Beer Production and Conditioning Using a Plug Fermentor. Journal of the Institute of Brewing, 79(6): 487–494
Branyik, T., Vicente, A. A., Dostalek, P., Teixeira, J. A. (2008) A Review of Flavour Formation in Continuous Beer Fermentations. Journal of the Institute of Brewing, 114:
3–13
Fitzner, M. (1998) Der Einsatz immobilisierter Hefen in der Brauerei unter besonderer Berücksichtigung der Angärphase und ausgewählter Reaktortypen und Trägermaterialien (Application of Immobilized Yeast in the Brewery with Special Focus on the Initial Fermentation Phase and Selected Reactor Types and Carrier Materials). Dissertation, Technische Universität Berlin, Fachbereich 15 – Lebensmitteltechnologie
Krüger, E., Anger, H.-M. (1990) Kennzahlen zur Betriebskontrolle und Qualitätsbeschreibung in der Brauwirtschaft (Key Figures for Manufacturing Control and Quality in Brewing Industry). Hamburg, Behr‘s Verlag
Ludwig, A. (2003) Zur Verbesserung der Langzeitstabilität von Verfahren mit immobilisierter Hefe bei der Hauptgärung (Improvement of Long-term Stability of Main Fermentations with Immobilized Yeasts). Dissertation, Technische Universität Berlin, Fakultät III – Prozesswissenschaften
Meyer, B. (2017) Neue Entwicklungen bei der Hefeimmobilisierung (New Developments in Yeast Immobilisation). Brauerei Forum, 8–11
Müller-Auffermann, K., Hutzler, M., Riedl, F., Osnabrügge, M., Caro, M., Jacob, F. (2013) Alternative, Biological Methods in the Flow Profile: Characterization of Bioreactors.
BrewingScience, 66
Van de Winkel, L., Van Beveren, P. C., Borremans, E., Goossens, E., Masschelein, C. A.
(1993) High Performance Immobilized Yeast Reactor Design for Continuous Beer Fermentation. Oslo: Proceedings of the 24th EBC-Congress: 307–314
Verbelen, P. J., De Schutter, D. P., Delvaux, F., Verstrepen, K. J., Delvaux, F. R. (2006) Immobilized Yeast Cell Systems for Continuous Fermentation Applications.
Biotechnology Letters, 28: 1515–1525