D. AMBRÓZY
KFKI“1980-25
NETSY: NETWORK SYSTEM SIMULATOR
(FROM NETSY TO NESSY - A CASE-STUDY)
CENTRAL
RESEARCH
INSTITUTE FOR PHYSICS
BUDAPEST
2017
4
4
*
D. Ambrózy
Central Research Institute for Physics H-1525 Budapest 114, P.O.B. 49, Hungary
HU ISSN 036ß 5330 ISBN 963 371 65S 1
ABSTRACT
In order to investigate the monitoring problems of computer networks, in the KFKI Research Institute for Measurement and Computing Techniques a simu
lator has been construed. The simulator is modular and interactive; the para
meters of the simulation as well as of the traffic to be simulated is modifi
able while running the program. The report deals with the system and the more important events of its history. On basis of experience the further develop
ment of the simulator is under way.
АННОТАЦИЯ
Для изучения проблем сетей ЭВМ в ИИВТ ЦИФИ ВАН разработана программа м оде
лирования. Система моделирования имеет модульное построение, является интерак
тивной, а параметры прогона и моделирования могут быть изменены. В отчете опи
сывается система и важнейшие этапы ее создания. На основе полученного опыта проводится дальнейшее усовершенствование программы.
KIVONAT
Számitógépes hálózatok monitorozási problémáinak szimulációs vizsgálatá
ra a KFKI MSzKI-ban szimulátorprogram készült. A szimulátor moduláris, in
teraktiv, futtatási paraméterei, valamint a szimulált forgalom paraméterei menet közben változtathatók. A beszámoló ismerteti a rendszert és történeté
nek fontosabb mozzanatait. A tapasztalatok alapján a program továbbfejlesz
tése folyamatban van.
CONTENTS
INTRODUCTION 01
THE SHORT HISTORY OE NETSY 02
THE CHOICE OF LANGUAGE Об
THE STRUCTURE OF NETSY 08
SOME FUNDAMENTALS 10
THE SIMULATED SYSTEM 12
THE PROCESS OF SIMULATION 15
THE MESSAGE-SIZE 22
NETSY WITH MONITOR 23
SIMULATION RESULTS 28
EVALUATION OF EXPERIENCE 31
WHAT TO DO IN THE NEAR FUTURE ? 34
FINAL REMARKS 36
ACKNOWLEDGEMENT 36
LITERATURE 37
Introduction
Early in 1977 our Institute became interested in the problems of monitoring and measuring computer networks.
Since at these times no networks of the needed dimen
sions were available at working order, we had to choose an appropriate way of modeling. However,- the established models known at that time turned out to be of general nature and they failed to give account of the parti
cular problems involved in the design and installation of monitoring and measuring systems.
Therefore we had to fall back upon the "last resort"
of the researcher: the simulation. After the decision had been made, we saw that if a suitable method were
found, a simulator would have several uses other than the mere understanding of the measurement-problems being its scope a function of the proper goal-setting.
By the fall of 1977 the following objectives were agreed upon:
a. design of a simulator, the performance of which cor
responds to the observed statistics /1, 2, 3/ of the behaviour of packet -switched computer network
b. the simulator should be modular with respect to the configuration of the simulated network as well as with respect to the applied strategies /routing, forwarding, etc., technics/
- 2 -
c. the parameters of the simulation as well as those of the traffic should he adjustable from outside in the course of the simulation process
d. the system should qualify as
part of the measuring device /as a source of messages, outside disturbances, etc., for the equipment to be measured or tuned/
part of the system to be measured /in cases of the tuning of prospective gateways
hosts, or monitors/ (Pig. 1.')
e. the system should work on a minicomputer with a possi
bility of its later realisation on a ^uP parallel- processor system.
These objectives hold good up till now.
The short history of NETSY
NETSY*s name is an acronym for network simulation system.
Its development started in November 1977. In the spring
of 1978 NETSY was in working order although only as a basic realisation.
After a series of pilot-runnings and evalutations, in the fall of 1978 it was furnished with additional, in
terchangeable modules and in 1979 -it obtained a pro
visory monitor.
Meanwhile, quite unexpectedly, NETSY became employable as a research-tool in the investigation concerning a game-theoretical approach to computer network measure
ment technics Connected to these investigations, in 1978 an attempt was made to shape NETSY*s parlour- game version based on the conflict-situations inherent in the workings of a network, where the messages are competing for the resources of the system. This effort was bound to fail, since parlour-games are exciting
only when they are of the zero-sum type, while the functioning of a computer network can not be modeled in this way.
The game-version was abandoned, but early 1979 several hundred simulations were performed on the standard-NETSY for a better under standing and demonstration of the con
flicts revealed when treating the working of a network with monitor as a non-zero-sun-game. These investigations
are going on.
In 1979 other experiments were conducted, too. One series of simulations concerned the problems of a single-server system with selfadjusted service-time. A few dozen runs, however, proved NETSY to be too slow for the hundred- thousands of sample-messages necessary for obtaining a meaningful result.
Based on experience, an outline of the system’s modifi
cation emerged. Now the gathering of material /this of own and of others/ and their consideration is under way
SOFTWARE HARDWARE
ADVANTAGES:
DISADVANTAGES:
SCOPE:
EXAMPLES:
HIGH LEVEL LOW LEVEL
(SIMULA»67, GPSS,etc.) (FORTRAN, ASSEMBLY L.) INBUILT MECHANISM OF
SIMULATION (TIME-AND FILEHANDLING,LISTPROC- ESSING) ERRORFREE
REPRESENTATION OF COMP
LEX SYSTEMS
EASY ELABORATION OF DETAILS
HIGH AMOUNT OF EXPERIENCE
LACK OF MODULARITY, CLUMSY INTERACTIVITY COMPLEXITY (NEED FOR LARGE COMPUTER)
GENERALITY
PROCESS ORTIME-CONSUMING
SIMULATION OF LARGE SYSTEMS WITH ANY LEVEL OF DETAILING
ASZH-SIMULA»67 C53 ARPANET, C6:
CÉDRUS,GPSS C 7]
FLEXIBILITY (MODULARITY, INTERACTIVITY)
SIMPLICITY(POSSIBILITY OF MINICOMPUTER REALI
SATION)
POSSIBILITY OF REALI
SATION OF SPECIAL FEATURES
EASY ATTACHEMENT TO OTHER SYSTEMS(DECKET, ETC)
MANPOWER-C ONSUMING (ERROR-PRONE)
DIFFICULT REPRESEN
TATION OF VERY COMPLEX SYSTEMS
VALIDATION-PROBLEMS SMALL AMOUNT OF EXPERIENCE
SIMPLE OR SIMPLIFIED SYSTEMS OR UNITS
PROTOCOLS - FORTRAN C83 NPL - ALGOL 60 C93
SOME TOOLS OF DISCRETE SIMULATION
PORTABLE IMPLEMENT
ATION/ FIELD-VERSION POSSIBILITY OF REAL-TIME OPERATION ECONOMICAL USE COMPATIBILITY WITH OTHER SYSTEMS
(HARD- OR SOFTWARE)
RIGID
REALISATION ECON
OMICAL ONLY IN LARGE SERIES
DETAILS, HIGHLY SIMPLIFIED SYSTEMS
UNIDATA C103 MICRONET Н П З
TABLE I
for preparing the construction of NETSY’s second version, which obviates the shortcomings of the first-, while
maintaining its favourable features.
• The choice of the, language
Developing a simulator-, the first question to be answered
* is that of the language. As Table I shows, quite satisfy
ing results are obtained by realisations with ligh-level, as well as with low-level languages, but also dedicated hardware-systems are applicable. / 5 . , 6., 7., 8., 9., 10«, 11. / With respect to system’s simulation, FORTRAN, ALGOL, PL1 etc. are regarded as low-level languages
/assemply languages, too, of course/. By high-level languages we mean SIMULA*67, SIMSCRIPT, GPSS and others designed primarily for simulation-purposes, the compilers of which yield automatically the necessary tools of
system’s simulation /time-handling, list-processing, etc./.
In accordance with the considerations of the Table II, FORTRAN was chosen. Fortunately, the TPA-i minicomputer was reasonably well accessible during the time of the
development, and its FORTRAN II proved suitable. The FORTRAN II of the TPA-i is upward compatible with the FORTRAN of the somewhat larger TPA 1140 under RSX-11, therefore there exists a possibility to couple NETSY with the DECNET configuration which is under preparation
at present in the Institute.
Our future plans include the realisation of the parallel /UP version of the modified NETSY. This will be prepared on a language of the development system of the most
suitable type obtainable at the realisation-time. To this time the Z80 supported by the MOSTEK development- system is considered.
GPSS
IMPLEMENTED ON THE R40 OP OUR INSTITUTE
SIMULA*67 ON THE CDC 3300 OP THE INST. FOR AUTOMATION OP SA.H
FORTRAN II ON TPA-i
ASSEMBLY LANGUAGE
ACCESIBILITY: MEDIUM BAD GOOD GOOD
EFFICIENCY: GOOD EXCELLENT MEDIUM BAD
PORTABILITY: BAD NONEXISTENT EXCELLENT NONE
FLEXIBILITY: MEDIUM MEDIUM EXCELLENT BAD
INTERACTIVITY: NONE MEDIUM GOOD GOOD
COMPATIBILITY:
(WITH OTHER SYSTEMS) NONE NONE GOOD EXCELLENT
DOCUMENTABILITY: GOOD GOOD GOOD BAD
GOING INTO DETAILS : GOOD EXCELLENT BAD BAD
VALIDITY: GOOD GOOD MEDIUM MEDIUM
TABLE II
THE POSSIBILITY OP REALISATION OP BETSY* S REQUIREMENTS WITH THE TOOLS ACCESSIBLE IN OUR INSTITUTE
The structure of NETSY
The structure of the modular simulator is depicted in Fig. 2. It runs on the hardware configuration to he seen in Pig• 3«
FIG. 2.
FIG. 3. TPA-i WITH NETSY CONFIGURATION
8
The framework of the whole system is the main-segment of the PORTRAIT II program. The chief duties of the main segment are
- to ensure the communication between the system and the experimenter
- to generate the objects to be transported by the simu
lated system /these objects could be anything that may travel on a traffic-network; in our special case these are messages/
- t o time the internal events which occur in the simula
ted system; to activate the subroutines which are responsible for the execution of these events
- to deliver the reports9 one part of which contains the periodic report of the traffic, the other contains the event-driven snapshot of the actual status of the simulated system and the optional tracing of the indi
vidual messages
- to terminate the simulation at some predetermined time or occurrence.
The main segment is thus the driver and the executive of the whole model; it may conduct any kind of traffic- simulation, depending on the performing subroutines.
The hitherto realized subroutines may be divided in two groups.
To the first group belong the segments that perform the system’s communication with the experimenter and in the future with DECNET.
The second group contains the programs that execute the traffic of the objects generated by the main segment and
those performing some special events /e.g. "break-down of some unit of the simulated system, etc./
Since the subroutines may be changed one-by-one, with NETSY we have practically as many simulators as there are workable combinations of the subroutines of the second group. This fact presents some difficulty in giving a coherent report on 1ÍETSY - therefore some fundamentals should be mentioned first.
g.oag. £шйшрйа1р
The simulation of a system may be defined as moving it from- state to state under well defined rules /12/ and performing experiments on this model, /13 /
The transitions may follow each other as a continuous flow of changes or may happen stepwise - in any case, we call their chain a simulation only in the case when
these transitions take place along the time-axis.
For NETSY, these transitions are caused always by events.
The events follow each other separated by determined finite- time-intervals - time for 1TETSY is represented by the events.
The intervals are integer quantities divisible by an abstract time unit: the tact. The relation between the tact and any physical time-unit is not firmly established as yet /this will become necessary only when real-time operation begins/.
The events are considered to take place instantaneously;
the direct consequences of any event come into force immediately after the occurrence of the event.
10
The complex of direct consequences of event i is the transition of the system from state^ into state^+-^.
The transition, too, is considered as instantaneous, thus state^ is separated from state^+^ by the same time-interval wich separates event i from event i+1.
The events, however, can differ in a decisive property.
Henceforward we call regular events those which are uniquely determined by the properties of the objects taking part in them and by the state which the system is in at the time of their occurrence. This holds even in the case when the properties are ordered to the par
taking objects by Monte Carlo methods at the point of the origination of these objects. The change of the properties is not forbidden, but it must be caused de
terministically by regular events.
Simulators, however complex, dealing only with regular events are deterministic models.
The states of real systems may be influenced also by happenings which originate outside of the simulated realm /i.e. which are derivatives neither of the pro
perties of the objects nor of the state of the system/.
Random events, too, may happen which originate in the modeled system, only we do not know enough about their
casual development. If the model keeps up also with these effects in a consistent way, then the simulation is called stochastic.
Here another crucial difference must be stated.
In the case of a well explored Markoff-process we know all the probabilities of all the possible transitions - in real systems we may gain this knowledge with appropri ate confidence from a sufficiently long series of
measurementse However, we have no certainty of any single transition, although in real systems they always have their casual background.
It is a marked difference between the investigating of the whole outcome of a process the transition-matrix of which we already possess- and the experiment of
developing a string of single deterministic events which will show the proper transition matrix.
When the transitions follow each other exclusively by the tossing of coins with the appropriate distribution, then we simulate Markoff-mat rices with the Monte Carlo method. However, when we calculate the causes of the transitions step-by-step for any of them, then the
pattern of the events may follow a supposed distribution /if it was supposed any at all/ and the whole outcome may justify a hypothetized Markoff-matrix /if there
exists any/ - but the simulation itself may be either deterministic or stochastic; in either case it is the simulation of the real system itself, and not that of its Markoff-model.
NETSY realizes a stochastic discrete simulation of the real system itself.
The simulated system
At present HETSY simulates computer networks.
The simulated network is an arrangement of stations:
hosts, nodes, possibly a monitor, too, in which messages originate, stay for some time and reach their destination.
The propagation of the messages from station to station forms the traffic of the network.
12
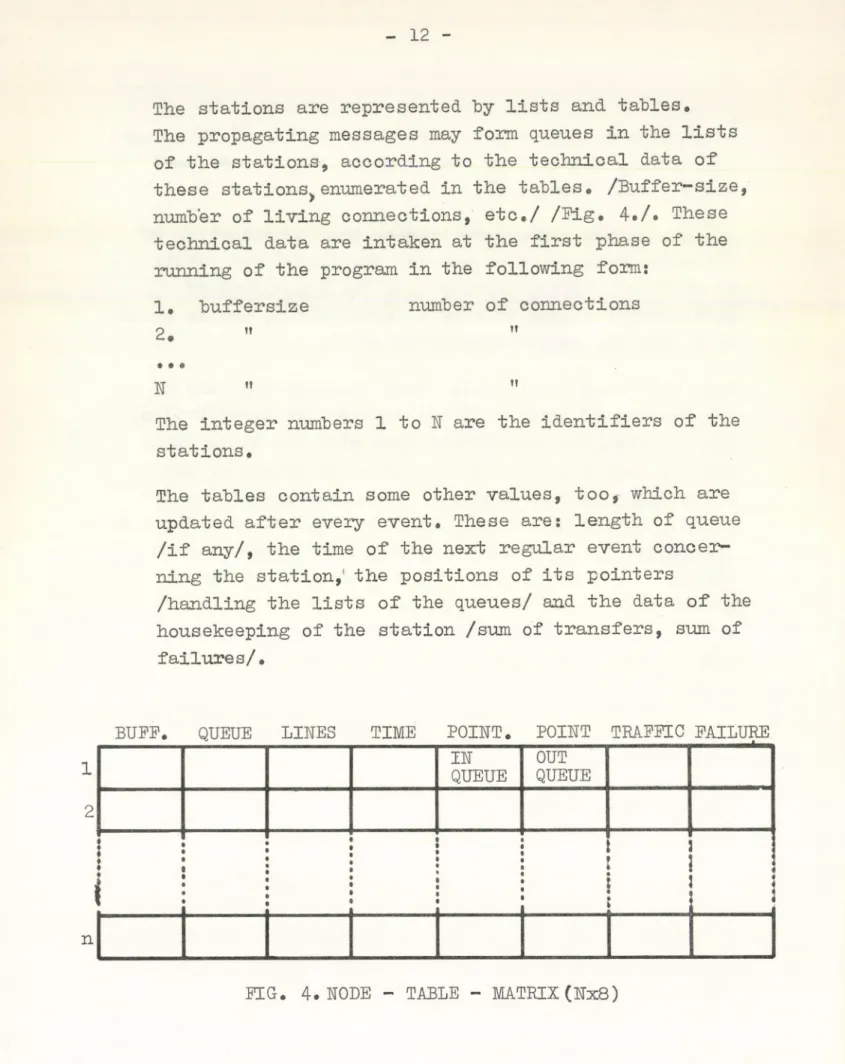
The stations are represented by lists and tables.
The propagating messages may form queues in the lists of the stations, according to the technical data of these stationSjenumerated in the tables. /Buffer-size, number of living connections, etc./ /Pig. 4./. These technical data are intaken at the first phase of the running of the program in the following form:
1. buffersize number of connections
2. " "
• • •
N " "
The integer numbers 1 to Ж are the identifiers of the stations.
The tables contain some other values, too, which are updated after every event. These are: length of queue
/if any/, the time of the next regular event concer
ning the station,1 the positions of its pointers
/handling the lists of the queues/ and the data of the housekeeping of the station /sum of transfers, sum of
failures/.
BUFF. QUEUE H U E S TIME Р О Ш Т . Р01ЖТ TRAFFIC FAILURE nr
QUEUE
OUT QUEUE
,1 1
_______ __ i_______
FIG. 4. ЖОБЕ - TABLE - MATRIX (Жх8)
The interoornieotions between the stations /i.e. the topology of the arrangement/ is contained in other table /tables/ input after the technical data. The description-format of the topology depends on the adopted routing strategy. At present three of them do work: a fixed one /where a single and only a single sequence of stations leads from m y source to any des
tination/, a split-routing /where before every skip from one station to the next one the more favourable is chosen out of two possibilities/ and a fully random one /where the next station is chosen by the Monte Carlo method out of the existing connections/.
In the case of fix routing, the topology-table defines always the unique next station from the actual source to the final destination,’ as /Pig. 5./ shows.
Let the source of origination be 1 and the final desti
nation 3. /The integers stand for the identifiers of the stations/.
Let the topology be:
Pig. 5.
and the fixed routes between the negihbours always the direct connection, but between those which have no direct connection, always the second shortest one, either through station 2, or through station 1. The route from 1 to 3 is:
1, 2, 3
14
This may he looked up before every subsequent skip from the following table:
1 2 3 4 5
1 - 2 2 4 2
2 1 - 3 1 5
3 2 2 - 4 2
4 1 1 3 - 5
5 2 2 2 4 -
So the topology is given in this way in the case of fixed routing; split routing needs two of such tables, but for random routing only the enumeration of existing connections for every station is needed /in the simplest case. /
With these two kinds of tables - that of the data of the stations and the topology-table/s/ - the initial description of the modeled system is already given.
The intake of these data is the first action of NETSY.
The process of simulation
After obtaining the initial description, the network is in its initial state - i.e. it is totally empty.
The first event wich happens after the beginning of the simulation proper is an irregular one: the generation of the first message by the main segment.
Messages are represented by vectors, with their serial number as identifier for them. Their fixed properties are stochastically ordered to them as components, but once decided on, they prevail until the arrival
of the message at its final destination, or until it
reaches its age-limit and is discarded. The properties are:
identifier of source of origination identifier of final destination value of size.
The messages have variable properties, too, which obtain their values in consequence of regular events:
their actual age /elapsed time since their generation/
identifier of their actual residence.
Messages are generated by stochastic, uniformly distri
buted time intervals, the duration of which may range from 1 to 200 tacts. The expected value of the inter
vals is defined by the experimenter in the following way. Hundred tacts make a simulation-period. (The period is a purely technical time-unit for the benefit of the user, who may set the time-span of the whole simulation as an arbitrary number of periods.) Among other, hitherto unmentioned uses of this measure, one is the facility of setting simulation- and traffic-parameters with its help, as in the case of defining the intensity of the message flow:
After the input of the technical and topology-description, the experimenter answers the question:
Message/period?
The answer may be a real number fixing the expected value of messages per period,/which is the parameter of the resulting Poisson-process of the entering of messages into the system./
- 1 6 -
The new message is enlisted as first in the waiting queue of the first station of its route. The message- vector now is /taken the example from the previous chapter/
№ source dest size residence age /in tacts/
1 1 3 ?* 1 1 (1)
The table of the 1. station is like this:
buffer lines queue time pointer pointer traffic failures
n n 1 ?* 1 2 0 0 (2)
representing indeed a departure from the initial state of the system, in which the message-vector was non
existent, while the table of the 1. station looked like this:
buffer lines queue time pointer pointer traffic failures
n n O O l 1 О 0 ( з )
The duration of the residence of message 1 in station 1 depends on the forwarding strategy in use. At present, two different strategies are working /both of them may be used with any of the routing strategies/.
In the simpler one, the message’s stay in any station depends on the queue waiting before it /on POT'S basis/
and on its size. Since the service time of the messages prior to serving depends also on their respective sizes, the waiting time for any of them in station n is
m
T V ' t.-t , n / у г el
i=l
* discussed on page 22
where m-1 denotes the number of messages waiting for
service prior to messagem under consideration, t^ is their individual service-time, T^ the sum of these times in
cluding the service-time of messagem while t 0^ means the time elapsed between the beginning of servicing t^ and the arrival of message , which is to be subtracted from the sum. In our case
the service time of message^ in station^; so the next event is due after t^ tacts (this ? in (2) is t^).
When during this interval the second message2 starts from station 2, it may happen that it still resides there
when the skipping of message is due. Then message en-
* J-
rolls in the queue - and the following messages under
go the same processes of skipping from queue into queue either empty or containing already waiting messages.
The skip of a message is represented by enlisting its identifier /i.e, serial numer/ into the appropriate queue /list/ and by the updating of the concerned tables: that of the stations/length of the queue, pointer— handling, counting of the traffic, decision on its next event
time/ and of the message-vector /marking the actual residence/. After every period the ages of the messages are incremented accordingly.
When a message reaches its final destination, it is counted, its delay is recorded /which is identical with its age/, eventually other statistics are performed.
After this the system destroys the message, and its serial number becomes free. This latter measure makes possible a traffic of practically any number of messages provided that the number of the simultaheously traveling messages does not exceed a constant. The value
* being its route: 1, 2, 3.
18
of this constant is 200 at present.
When the congestion of the station-queues impede the propagation of a message, it is possible that its age reaches an upper limit, after which NETSY annihilates it - doing first the necessary book-keepings, - and announces this event to the experimenter.
All the happenings after the generation of a message discussed hitherto were of regular nature. The pro
perties governing them were all fixed from the be
ginning of the process, either stochastically by the main segment, but following well-defined distributions with parameters set by the experimenter, or given
directly by him /e.g. the technical description of the system/. All the events and states could have been calculated - which in fact the computer did - but for the starting of new messages. In the parlour-game
version even this degree of uncertainty had been elimi
nated, since there also the sending of messages was at the players’ discretion.
how we have to discuss the three remaining topics: the irregular events, the problems inherent in the message- size and the question of the monitor.
The irregular, or random events have impact either on the topology of the system, or on the traveling of the individual messages.
Temporary break-downs can be caused of communication
lines. These may happen, according to the experimenters request, either stochastically, with exponential dis
tribution /the parameter of which is given by the
experimenter just after defining the parameter of the message-flow/ or between any two chosen neighbouring
stations. When a line is broken, TTETSY decrements the number of living lines in the tables of the concerned
stations. When a station loses its last line, it is closed down. NETSY has no means of restoration as yet.
As change event the faulty delivery of individual mes
sages is introduced. After such failure the sending station has to repeat the attempt of forwarding the message /the simpler forwarding strategy simply enrolls it at the end of the queue/.
The failure-rate is determined by the experimenter, as the main number of succesful deliveries for one
failure. The sparsing of the repetitions among the trans
fers is uniformly distributed. This variable was intro
duced at the end of 1978.
Rejection of a message may occur in a network for deter
ministic reasons, too, /when the destination node is not at receiving order, e.g./; these rejections are not in
cluded in the stochastic failure-rate because their repetitions happen but seldom /to an unvisible node or on a broken line a source does not send more than one message, until notified of the faulty entity’s recovery/.
The process of simulation is flow-charted on Eig. 7,
with the simpler forwarding strategy. The complex one has a more elaborate pattern of priorities and prevents the
looping of routes.
Deadlocks with NETSY did occur as yet only as consequences of system congestion.
20
SNAPSHOT ---
INPUT OP KONSTANTS
INITIAL
DIALOGUE -ESCAPE:END OP SESSION SETTING OP
INIT. VALUES
START OP MESSAGE ENLISTING
INTO n
a 1
1 - N SERVICING
YES
PIG. 7. PLOW-CHART OP SIMULATION
The message-size
To every message an integer numhert is ordered Ъу the main segment, wich is characteristic of its size. It may be regarded either as its length in bytes, or as the time needed for servicing it, being these two quantities roughly proportional. (Hence the notation t in 1.).
According to present theories these integers should have exponential distribution, and were developed accor
dingly until 1978 fall. However, a deeper investigation made clear that the assumption is not justifiable;
since although packets with about zero netto-length may exist, messages needing about zero buffer and zero
service-time are unimaginable. Therefore HETSY attaches to the exponentially formed message-lengths a constant tag, the value of which is defined by the experimenter at the initial dialogue. This value may range from 0 to 200 (tacts as service-time).
Taking f(t) as the distribution function of the original sizes, the addition of the constant к to the sizes
yields the new distribution function
f(t*) = f(t-k) x l(t-k) 1.
l(t-k) being the unit step-function /giving 0 when (t-k)<0
The procedure shifts the whole function to right on the taxis, with the deterioration of the distribution as
result, but since ^u /the parameter of the original exponential distribution/ is not affected by the mani
pulation, the assumption of the constant tag is justifi
able, (as well as consistent with the hitherto established, models when t « ^ .)
22
f(t) f(t)
t t
EIG. 6/a
density function of f(t)
к
density function of f(t ) It may Ъе shown, the Charakter of the Erlang distribu
tion resulting from the senvicings with time-durations proportional to the sizes of the messages is not affec
ted hy the right-sílift of the distribution of the sizes
•n
The parameter 7 was originally X• ■* . how it becomes
/u
The constant tag accounts for the time- and buffer- requirements of the protocellar processes. The detailed performance of these /especially of their lower levels/
were dispensible up till now; for simulation in order to investigate protocoll-processes special systems are recommended, or simulation on high-level languages suitable for deeper detailing.
NETSY with monitor
In the summer of 1979 NETSY was supplied with a monitor.
Its first realisation was built as a simplified model of the CIGALE failure-protection system. /14./ The monitor is sending probe packets at regular intervals, these are echoed by the destination-stations. The frequency and length of the probes is given by the experimenter in the initial dialogue. The experimenter chooses the monitor-station from among the others.
7 = X ( + к )
/u
The remaining are standard nodes. The monitor-station becomes dedicated to the task of sending and receiving the probes - meanwhile it also forwards the standard messages of other senders when their path happens to lead through it. However, the monitor-station is no gateway to a source- or destination host.
The periodically transmitted probes distort the origi
nal Poisson-process of the message-flow into the system in a way resembling to that observed in connection with the constant tag of the messages. Let again f (m) be the distribution of the incidences of messages, m being the number of incidences in a given time-interval.
The new distribution becomes, after the addition of к periodic messages /constant over time/
f(m*) = f(m-k) x l(m-k) 2.
which is a discrete version of 1.
f(m)
PIG. 6/b
This applies, however, only to the process of the star
ting of messages.
The pilot-runs with monitor showed that the arrival- process in the stationary case is a Poisson-one,
(as it had been expected). /The measurement was sugges
ted by T.L. Török/. The missing of consequences of the
- 24 -
distortion of the starting process is due to the nature of the subsequent delays which the probes, too, undergo.
The distributions of the delays show a wide variety accor
ding to the topology of the simulated network, the traffic conditions, etc. This, too, is well known from litera
ture /15/.
The probes may be sent - when the experimenter gives his order thus - stochastically or event-driven, too.
However, so far we have no wide experience with these cases.
HETSY’s parameters and variables. Some words on the reports
As has been seen, NETSY’s parameters and variables may be divided according to two main aspects.
First; there are some values which are determined by the experimenter, and others, which develop as the result of the simulation process.
Second; there are the ones which are strictly determi
nistic and the others, which are parameters of stochastic processes.
At last, there are '’constants” to account for.
All of them influence either the way of the simulation, regardless of the system to be simulated, or else the simulated systems structure and working. Table 3 shows them.
It must be remarked here, that the technical time-unit of NETSY, the period, has an important role in the
TRACING
DEFINITION OF RUN- LENGTH
SEED OF THE
PSEUDORANDOM N. GEN.
MESSAGE/PERIOD LINEBREAKDOTO/PER.
MINIMAL SIZE OF MESSAGES
REPETITION-FREQUENCY AGE OF MESSAGE LENGTH OF QUEUE
N TRAFFIC..
N FAILURE^
ARRIVAL-MATRIX (NxN) DELAY-MATRIX (NxN) SUM OF DEPARTURES SUM OF ARRIVALS SUM OF DISCARDINGS SUM OF PERI ODES SUM OF RUNS N
TECHNICAL DATA STRATEGIES
NUMBER OF PERIODS B U T . OF RUNS RANDOMGEN. WITH
UNIFORM DISTR.
BASIS OF DEVELOPMENT OF VARIOUS DISTRI— . BUTIONS
INIT, OF RUNS
FOR MESSAGE-FLOW PARAMETER OF POISSON PR.
INIT. OF RUNS FREQUENCY OF LINE-
BREAKDOWN
PARAMETER OF EXPON
ENTIAL DISTRIBUTION
INIT. OF RUNS CONSTANT TAG’S
LENGTH
+ X SHIFT OF EXP. D. INIT. OF RUNS FAILURE BY CHANGE REPETITION OF SENDING. INIT. OF RUNS LIMITING FACTOR BASIS OF STATISTICS END OF PERIODE,
ARRIVAL FORWARDING, ROUTING BASIS OF STATISTICS AFTER SKIP
- BASIS OF STATISTICS AFTER SKIP - BASIS OF STATISTICS AFTER REJECTION - BASIS OF STATISTICS AFTER ARRIVAL - BASIS OF STATISTICS AFTER ARRIVAL - BASIS OF STATISTICS AFTER STARTING - BASIS OF STATISTICS AFTER ARRIVAL
- BASIS OF STATISTICS END OF PERIODE - BASIS OF STATISTICS END OF PERIODE - BASIS OF STATISTICS END OF RUN NUMBER OF NODES NUMBER OF TABLES
AND QUEUE LISTS
INITIATION OF SESSION DEF. OF THE
NETWORK
TO BE SIMULATED INIT. OF SESSION WORKING OF NET
WORK
LOADING OF SUB
ROUTINES
LOAD-TIME
BY THE EXPERIMENTER
О4
w>
aи
UPDATED
*■ BY NETSY
UPDATED
* BY HETSY
^ BY THE OPERATOR
IN PARAMETERS, VARIABLES AND DATA OF STANDARD NETSY TABLE III
- 26 -
conmunicaticn with the experiment er, as well as in the control of the simulation session.
When the experimenter defines the number of periods-, he decides by this the time-span during which all the variables and parameters set by him are to prevail.
The performance of this number of periods is a "run".
After each run KETSY delivers a complete snapshot on the state of the whole system, printing the contents of every list and table, and the calculated statistics of the results. Possessing this snapshot, the experi
menter may decide whether he wants to modify the variables and parameters, or lets them unchanged for the next run, or else he may terminate the session.
Some of the parameters - as seen in Table 3 - once set, are unchangeable during the session; these were called "constants".
After each period a brief status-report is automati
cally given, followed by the optional tracing of the individual messages. In the course of a period only the discarded messages and the closed nodes are re
ported.
Simulation results
As pilot-runs., we simulated the configurations recom
mended as etalons by Kleinrock, Price, and others.
/Pig. 8./,
The Price - network was simulated as a ten-node arrange
ment, the others were run with 5 to 15 nodes. Special attention was paid to the effects of the assignement of the monitor-function to different nodes of a given arrangement.
О
STAR
When both the sources and the destinations are drawn with equal chances, the number к of possible pairs is the sum of the arithmetical series from 1 to N /N being the number of nodes/. The number n of the possible j lengths of routes between any two of them, measured by the skips of the traveling messages,
is IHL.
- 28 -
The probability of any route-length J . /j = 1 < . ..,n/
is
H-l
p. _ Izi # being к = V"' i 3 «
3 к ^ 4
i=l
and the expected value of the route-length
n H-l
J = pi^i = к X I i(M-i) 4
i=l i=l
However, when a node becomes a monitor, its messages are echoed back from every destination, and because of this, the condition of equal chances of drawing is not met; the probes, traveling their routes twice, double the relative frequency of their route-lengths.
Moreover, the monitor sends its probes periodically, while standard messages start stochastically which renders the calculation difficult. Even more compli
cated situation evolves when the distribution of the message-delay is investigated, since the service-time
also of the probe is proportional to its size, which is kept constant, whereas the standard messages are developed according to 1 .
However, the simulation showed d e a r y the difference between the two arrangements shown in Pig. 9» This
difference is especially sharp regarding the respective traffics of the nodes in the different arragements.
MONITOR MONITOR
TRAFFIC: 45 72 93 57 16 34 68 116 75 29
FIG. 9. ALLOCATION OF MONITOR
The evaluation of simulations with monitor compared with simulations without monitor are under way.
Other interesting experiment is the play-hack of the hypothesis, that fixed routing and fully random routing may give the same mean values of delays between node
pairs. /16/ Here several dozen experiments were con
ducted using the more elaborate forwarding strategy under the same initial conditions but for the seed
of the random-number generator - and with the two concerned strategies in either of them. Thus far the hypothesis seems to hold only in the cases when the network is loaded moderately /under 0.6 Erlang /node on the average/ but above this, quite unexpectedly, the fully random routing is superior to the fixed one.
However, the forwarding strategy takes care of preven
ting the loops of the routes. The experiment is not yet closed; correct evaluations will follow.
Evaluation of experience
Up till now a few hundred sessions were performed with NETSY giving the following results:
30 -
a. NETSY fulfills the first requirement stated on
page 1 : its performance corresponds to the hitherto observed behaviour of computer networks. The cor
respondence can be sharpened by the deeper elabo
ration of details of the simulated processes
b. the second requirement is fulfilled, toe: the ex
perience with interchangeable strategies is quite satisfactory as was shown
c. the interactive realisation supports the easy tuning of the simulator as well as of the simulated system d. The real-time operation inherent in the application of PETSY either as a part of the measuring-, or as a part of the measured system, however, is seriously impeded by the high time-consumption of the ne
cessary recording even when running METSY on a faster configuration than TPA-i is with PORTRAIT II
e. which - together with the above mentioned facts - not merely allows, but rather, cells for the reali
sation on a dedicated paral'J el-processing system.
Its present possibilities are summarized in table IV, the scheme of PETSY’s communication with the outside world is shown in Pig.10, page 34.
STAR 5 - 1 5
CHAIN 5 - 1 5
RING 5 - 9
DISTRIBUTED 5 - 1 5
GRID 5 - 1 5
PRICE 10
INTENSITY OF DEPARTURES 0 - 1 5 ME S SAGE/FE RIODE
INTENSITY OF TRAFFIC 0 < у < 1
LENGTH OF MESSAGE: +X SHIFTED (EXPONENTIAL, ~ 1) + к
QUALITY OF NETWORK REPETION-RATE STEPWISE ADJUSTABLE
EOUTING STRATEGY FIX, SPLIT, RANDOM
FORDWARDING FCFS, PRIORITIES AND LOOPCONTROL
OPTIONAL
MONITORING OPTIONAL
CONFIGURATIONS OF THE PILOT-RUNS TABLE IY
- 32 -
INITIAL DIALOGUE
DIG. 10. COMMUNICATION WITH NETSY What to do in the near future with NETSY?
With the many advantages of a modular, flexible simu
lator, some minor shortcomings, toe, emerged.
The reporting system of the present version is not flexible enough.
Important events are not announced immediately after their occurrence but only when the snapshot is due.
/In fact, only the death of a message and the closing of a node is reported promptly -congestion, traffic- deadlock may remain unsuspected until the end of a run/. The tracing of the messages can be switched on only at initiation-time, but once the decision made, the experimenter has no means to alter it during the session. The final account has to be more exhaustive.
Some part of it ought to be optional; some parts must be supressed when not containing new developments since
the last report.
The input of the technical data of the network to he simulated via the tape-reader is very cumbersome in the case of the pilot-runnings, of which a few hundred
should be performed after every essential modification of HETSY or with every newly installed strategy. An automatic network-generator was devised by Z. Papp, research-student under contract with KEKI-MSzKI, which is a subroutine building up the asked etalon-network automatically by computing its routing-tables, and filling in the lists of initial values used by UETSY’s forwarding strategies /buffer-sizes, etc./ The etalon is chcsen by dialogue from the configurations recom
mended by Kleinrock, the number of nodes may range from 5 to 16. The Price-network is computed as tennode ver
sion. At present the program is in working order,
however, the initial dialogue should be obviated, too, by a method for automated pilot-running-control.
The random-numbers are generated with the fed-back shift register method described by Davies, W.D.T., /17/ with a beautiful uniform distribution. However, because of the short registers of TPA-i, their autocorrelation- function is unfavorable in spite of the rather time- consuming manipulations which wrere undertaken for cor
rection’s sake. Here the solution lyes in the longer words of the TPA-1140, which is a faster machine anyway,
and to which we intend to shift over as mentioned be
fore.
The simulation of more elaborate details is feasible with BETSY being it modular. Unfortunately , the time
handling is a limiting factor, since in the case of a detailed real-time simulation, the internal clock of
- 34 -
the simulator has to tick also during the empty inter
vals, while nothing happens, with unadmissihle delay- outcomes as consequence. These problems remain to he solved even having a more flexible timing method.
A H these faults - and some others, which are technical and out of the scope of the present report - point toward the construction of a faster, more flexible
second version: EESSY, with the same basic idea:
simplicity, modularity, protablility.
Final remarks
Computers are considered as the most complex systems of the technic of our days - computer-networks are of an even higher level complexity. Their modeling is quite impossible without a coordinated endeavour in every possible area of the art: from the abstract mathematical descriptions to the concreteness of mea
surement. In the integration of these efforts NETSY - expecially in its future version - can be a usable tool.Its continuous development is a necessary con
dition - and that is made possible by its modular structure.
Acknowledgement
The author is indebted to Ms L. Emmi Kovács /МТА-КЖ1/
for her valuable help, to A. Gáspár /МТА-SZTAKI/ and L. T. Török /МТА-KFKI/ for the englightening discus
sions and especially to Ms Katalin Tarnay /МТА-КЖ1/
for her suggestions broadening the scope of this re
port and of the underlying research.
Literature
1. Kleinrock, L.
& Naylor, W.E.: On measured behaviour of the ARPA network
APIPS Conf. Proo. 1974, Vol. 43, p.s 767-780 2. J.R. Jackson: Job-shop-like queueing systems
Managements Sei. Yol. 10, p p . : 131-142, 1963 3. Tobagi, P.A.
& al. : Modeling and measurement techniques in packet communication networks Proc. IEEE, Yol 66.No 11. pp.: 1423-1447 4. Tarnay, K . : Ein Matxnx-SpieltheoretischesModell
für Rechnemetzwerkmessungen DREZDA,1979.
5. Gáspár, A, & al.*: Simulation of the comp, network of the Sc. A. of Hungary
Computer Communication Rewiev 1978 No. 4.
6. Schneider, G.M.: A model-package for simulation of computer networks
SIMULATION, 1978 12. pp.: 181-192 7 . Arató, A., Telhisz, P.
Sarkadi, N.I.: Izmerenje modelirovanije inter- aktivnoj terminal system Cédrus Z b o m i k a algoritmi i programi dia re sen je njekotorüch zadacs
Dubna - Budapest
- 36 -
9. Price, W.L. A rewiev of flow control aspects of the simulation studies at the npl
Plow control in CNW-s, ed.; Grangé-Gien, North-Holland, 1979
10. Bayer, Unidatas Simulator für Datenübertragung, S26245-K19 74-11-20
11. Wittie, Larry,D. MICRONET: a reconfigurable microcomputer network for distributed systems research SIMULATION, 1978 November, pp. : 145-153 12. Pritsrker, A.A.N.s Compilation of definitions of
simulation
SIMULATION, 1979 August, p p . : 61-63
13. Shannon, R.E.: Systems Simulation: the Art and the Science
Prentice Hall, New Jersey, 1975 p . : 2 14. Pouzin, L . : CIGALE, the packet-switching
machine of the CYCLADES computer network
IFIP Congr. Stockholm, 1974 Aug. pp.:155-159 15. Kleinrock, L . : Queuing systems, II.
Wiley, 1976 New York
16. Schoemaker, L , : Simulation of Computer Networks North Holland, 1979
17. Davies, W.D.T.: Generation and properties of maximum-length sequences Control 10. 1966 no.: 301-304, 364-365,
432-433
a
1
Kiadja a Központi Fizikai Kutató Intézet Felelős kiadó: Sándory Mihály
Szakmai lektor: Dr. Tarnay Katalin Nyelvi lektor: Vörös József
P.éldányszám: 270 Törzsszám: 80-292 Készült a KFKI sokszorosító üzemében Budapest, 1980. május hó