Grading in Hungarian Primary Schools:
Mechanisms of Ethnic Discrimination against Roma Students
Dorottya Kisfalusi
1,*, Be´la Janky
1,2and Ka´roly Taka´cs
1,31
Computational Social Science—Research Center for Educational and Network Studies (CSS—RECENS), Centre for Social Sciences, Eo¨tvo¨s Lora´nd Research Network, Budapest 1097, Hungary,
2Department of Sociology and Communication, Budapest University of Technology and Economics, Budapest 1111, Hungary and
3Institute for Analytical Sociology, Linko¨ping University, Norrko¨ping 601 74, Sweden
*Corresponding author. Email: kisfalusi.dorottya@tk.hu Submitted August 2019; revised May 2021; accepted June 2021
Abstract
The present study aims to shed light on the mechanisms of ethnic discrimination in teacher assess- ments in Hungarian primary schools. For this purpose, we use data collected among Roma minority and non-Roma majority students. First, we identify a considerable ethnic difference in non-blind school grades, which is beyond the ethnic difference in blind standardized test scores. Then, we de- rive and empirically test predictions from different theories of discrimination that might explain the ethnic difference in grades. We find that stereotype-based theories of discrimination do not explain why minority students receive lower grades than majority students. We do not exclude the possibility that taste-based discrimination exists among teachers against Roma students. A considerable part of ethnic discrimination, however, is explained by teachers’ indirectly discriminatory grading practices:
Roma students’ school behaviour is evaluated more negatively by teachers than that of non-Roma students and school behaviour seems to be taken into account in grading without legitimate justifica- tion. This practice does not only disadvantage Roma students, but boys and low status students as well.
Introduction
Results from comparative standardized large-scale as- sessment studies such as the PISA indicate that in many countries, children of some immigrant and ethnic minor- ity groups lag behind majority students considerably with regard to acquired skills, competencies, and abil- ities (Ammermueller, 2007;Rangvid, 2007;Jonsson and Rudolphi, 2011). Studies spanning various countries, including the United States, UK, Brazil, Germany, Italy, and Sweden, found evidence for the existence of ethnic
differences in non-blind teacher assessments as well, even after controlling for standardized blind test scores.
These latter differences were found both in observation- al (Lindahl, 2007;Ouazad, 2008;Rauschenberg, 2014;
Burgess and Greaves, 2013; Kiss, 2013; Botelho, Madeira and Rangel, 2015;Triventi, 2019) and experi- mental studies (Hanna and Linden, 2010; Sprietsma, 2013;Hinnerich, Ho¨glin and Johannesson, 2015; for a review, seeMalouff and Thorsteinsson, 2016). The eth- nic difference in teacher assessments that is above the
VCThe Author(s) 2021. Published by Oxford University Press.
This is an Open Access article distributed under the terms of the Creative Commons Attribution-NonCommercial License (http://creativecommons.org/
licenses/by-nc/4.0/), which permits non-commercial re-use, distribution, and reproduction in any medium, provided the original work is properly cited.
For commercial re-use, please contact journals.permissions@oup.com
doi: 10.1093/esr/jcab023 Original Article
Downloaded from https://academic.oup.com/esr/advance-article/doi/10.1093/esr/jcab023/6355982 by guest on 21 August 2021
test score difference indicates either discrimination in grading or unobserved differences between ethnic groups that affect students’ school grades but not their test scores.
Our definition of discrimination encompasses both differential treatment, which is also called direct dis- crimination, and disparate impact, which is also called indirect discrimination. Differential treatment discrimin- ation is the unequal treatment of students on the basis of a social category, when category membership is irrele- vant to the original scope of assessment (Pager and Shepherd, 2008; Blank, Dabady and Citro, 2004;
Bygren, 2020). Disparate impact discrimination occurs when teachers take into account inadequately justified factors in their evaluations that are not legitimate part of the grading process and, therefore, grading practices favour students from one social group over students from another (Blank, Dabady and Citro, 2004; Pager and Shepherd, 2008). The sociological understanding of discrimination in grading is highly important because of its detrimental consequences on minority students’ self- confidence, educational achievement, and labour market opportunities at the micro level and on reproduction of inequalities at the societal level (Becker and Hecken, 2008; Terrier, 2015; Keller, 2016b; Holm, Hjorth- Trolle and Jæger, 2019). The fairness of grading is par- ticularly important in largely stratified educational sys- tems where grades matter for advancement to different tracks at the next school level and hence determine chances of educational attainment and socio-economic status (SES) (Kiss, 2013;Keller, 2016a).
The present study aims to shed light on the mecha- nisms of ethnic discrimination in grading. Previous stud- ies mainly focused on the extent of ethnic differences in grades. Less attention has been devoted to the systematic analysis of social mechanisms that bring about these dif- ferences. The identification of mechanisms underlying discrimination does not only help us understand why minority students receive lower school grades but it is also crucial for the design of effective policy interven- tions to decrease social inequalities (Reskin, 2003;
Blank, Dabady and Citro, 2004; Keuschnigg and Wolbring, 2016;Bozoyan and Wolbring, 2018; Horr, Hunkler and Kroneberg, 2018).
We analyse ethnic discrimination in grading using data collected among Roma minority and non-Roma majority students in Hungarian primary schools. First, we show that Roma students receive lower grades on average than non-Roma students conditional on blind test scores that measure competences. This association is found using a large stratified random sample of primary schools in towns and cities in Hungary. Then, we
analytically distinguish and empirically test predictions from different theories of discrimination using a smaller but more focused study. We investigate if explanations suggested by stereotype-based and taste-based theories of discrimination or explanations focusing on indirectly discriminatory practices of teacher assessments hold in our empirical context. We use a residual approach to differentiate between analytically distinct theoretical predictions. This enables us to gain insights into the underlying social mechanisms of discrimination in grad- ing. As a consequence, the unexplained part of the eth- nic gap in grades is largely reduced as we provide evidence for different mechanisms of discrimination against Roma minority students in Hungary.
Mechanisms of Discrimination in Teacher Assessments
Theories of Direct Discrimination 1: Stereotype- Based Theories of Discrimination
Stereotype-based theories suggest that prior beliefs or stereotypes about social categories underlie discrimin- ation. These cognitive elements affect judgements and actions when they are consciously or unconsciously acti- vated during a social interaction (Quillian, 2006).
Social psychological theories assume that impression formation takes place in a continuum from category- based to individuating processes (Fiske and Neuberg, 1990). That is, individuals integrate stereotypic categor- ization and individuating information in their person perception (Fiske and Neuberg, 1990; Fiske, 1998).
Similarly, economic theories of statistical discrimination (Phelps, 1972; Arrow, 1973; Aigner and Cain, 1977) emphasize the role of prior beliefs about group charac- teristics in the decision-making process if information about individual characteristics is not sufficiently avail- able for the decision-maker.
Theories of statistical discrimination and models of stereotypic categorization thus suggest that, if teachers hold corresponding prior beliefs or stereotypes, minority students will receive lower grades than they would have received had they been majority studentswhen they first meet a teacher, but, following these approaches, this dif- ference should be expected to decrease over time. This is because teachers first make inferences based on their prior beliefs about the social groups students belong to.
As teachers acquire more information on individual characteristics, they rely less on group characteristics in their assessments. Some observational and experimental studies support these explanations (Hanna and Linden, 2010;Botelho, Madeira and Rangel, 2015;Wenz and Hoenig, 2020).
Downloaded from https://academic.oup.com/esr/advance-article/doi/10.1093/esr/jcab023/6355982 by guest on 21 August 2021
Status characteristics theory (Berger, Cohen and Zelditch, 1972) offers another explication of how prior beliefs about social categories underlie discrimination in grading. The theory suggests that ethnic and gender cat- egories are diffuse characteristics that carry different sta- tus values. Certain states of these categories, e.g. being male or belonging to the majority, are evaluated more positively than others. Due to status generalization, teachers assume that students who belong to higher- valued categories will perform better than students who belong to lower-valued categories (Ridgeway, 1991;
Correll and Ridgeway, 2006; Grow, Taka´cs and Pa´l, 2016). Minority students thus have to provide better performance than majority students to prove the same knowledge and receive the same grades.
Theories of Direct Discrimination 2: Taste-Based Theories of Discrimination
In contrast to theories relying on cognitive factors, taste- based theories of discrimination suggest that individuals inherently prefer to treat certain social groups differen- tially. The most prominent theoretical framework was provided byBecker (1957)who has assumed that indi- viduals with inherent preferences against a social group are willing to pay a cost to avoid interactions with its members. Becker’s theory, however, does not specify where preferences originate from.
Social psychological and sociological theories dig deeper. Social identity theory (Turner, 1975;Tajfel and Turner, 1979;Tajfel, 1982) emphasizes the role of in- group favouritism in discrimination. Individuals aim to identify with positively valued social groups. To achieve this aim, they categorize others along several dimensions and make comparisons between the social categories. To establish a positive distinctiveness from less desired so- cial groups, they evaluate in-group members more posi- tively. Sociological explanations shed light on the factors that foster the formation of out-group prejudice (Blumer, 1958;Blalock, 1967;Quillian, 1995). Theories of perceived group threat emphasize that prejudice underlying discrimination is a response to the perceived threat a dominant social group faces by a subordinate group (Blumer, 1958;Quillian, 1995).
Taste-based theories of discrimination suggest that the cause behind ethnic differences in grades is that teachers who generally belong to the majority ethnic group favour in-group students and disfavour out-group students. In line with this argument, previous empirical studies have shown some evidence that teachers evaluate same-ethnic students more favourably (Ehrenberg, Goldhaber and Brewer, 1995;Ouazad, 2008).
Disparate Impact Discrimination
The above two types of theories assume that teachers treat students with different ethnic background differen- tially; hence, they are able to explain direct discrimin- ation. Discrimination, however, does not necessarily stem from differential treatment based on students’ eth- nicity. The formal or informal rules and procedures of teacher evaluations might disparately impact minority and majority students when inadequately justified fac- tors are taken into account in grading. This is also called indirect discrimination (Blank, Dabady and Citro, 2004). The literature on grading practices identifies a potential source of disparate impact discrimination:
teachers have been found to take into account students’
dispositions, behaviour, and attitudes towards school in academic assessments and this practice negatively affects minority students’ grades (Pedulla, Airasian and Madaus, 1980;Bennett et al., 1993). Minority students might have difficulties with conforming to school norms and expectations because their cultural capital including skills, dispositions, and the form of language they use differ from what is accepted by the dominant social group and what is therefore needed to achieve educa- tional success (Bernstein, 1971;Bourdieu and Passeron, 1990;Jæger and Breen, 2016; Jæger and Møllegaard, 2017). As these characteristics are more easily recogniz- able in everyday school interactions than in a single blind test, minority students are expected to be under- assessed in schools if teachers rely on these characteris- tics in evaluations.
It is important to note, however, that the perception of students’ behaviour and attitudes might be itself sub- ject to cognitive biases and hence, direct discrimination.
Teachers have been found to perceive students’ behav- iour differently depending on whether students belong to the ethnic in-group or an ethnic out-group (Downey and Pribesh, 2004;Dee, 2005). Furthermore, even the same perceived behaviour was sanctioned differently in the case of majority and minority students (Gregory, Skiba and Noguera, 2010).
Identifying Discrimination
In the current paper, we use observational data to study mechanisms of discrimination in grading. We control for standardized blind test scores, which we use as a proxy for students’ competences. Test scores are observed by the researchers but unobserved by the teachers at the time of grading. The ethnic difference in grades that is beyond the ethnic difference in standar- dized blind tests is either the result of discrimination or the result of ethnic differences that influence grades but
Downloaded from https://academic.oup.com/esr/advance-article/doi/10.1093/esr/jcab023/6355982 by guest on 21 August 2021
not blind test scores (Altonji and Blank, 1999;Blank, Dabady and Citro, 2004). The latter kind of ethnic dif- ferences might be present because grades are not assigned based only on competence and acquired know- ledge. Teachers take into account several other factors such as students’ effort, diligence, motivation, class par- ticipation, development, actual performance in assign- ments and tests, or even out-of-school challenges, and family circumstances (Malouff, 2008; Hardre´, 2014).
These confounders are observed by the teachers but un- observed by the researchers. Some of these confounders such as effort, diligence, motivation, development, and class participation rightly appear in grades in case teach- ers use grades to motivate students and to provide feed- back for their actual school performance. Hence, different grades for students with the same competence are not discriminatory, in case grades are used to serve the purpose of motivation and feedback. Therefore, the ethnic difference in grades, after controlling for test scores, cannot fully be attributed to discrimination in grading (Blank, Dabady and Citro, 2004; Elwert and Winship, 2014; Bozoyan, and Wolbring, 2015;Wenz, 2020).
At the same time, differences in these factors might themselves be the result of cumulative discrimination in school or other domains (Blank, Dabady and Citro, 2004). If minority students realize that they receive lower grades than majority students for the same achievement, they might lose motivation and lower their efforts, which negatively affect their grades. In this case, we underestimate the effect of discrimination.
Discrimination is also underestimated if minority stu- dents underperform on standardized tests due to stereo- type threat (Steele and Aronson, 1995;Wenz, 2020: p.
161) or if standardized tests are culturally biased and fa- vour majority students over minority students (Phillips, 2006).
Moreover, it is important to note that grades have two separate functions in the Hungarian educational system: they are used to give feedback to students, but in the last two years of primary and secondary school, they are also used in the admission to the next educational level. Whereas taking into account factors such as dili- gence and effort is justified and therefore does not indi- cate discrimination if grades are used to provide feedback to students, they are unjustified and therefore indicate discrimination if students with the same know- ledge and competences do not receive the same chance to continue their studies in an academic track that is in accordance with their competences.
After identifying the ethnic difference in grades con- ditional on test scores, we control for students’ SES.
Stereotypes, prejudices, and indirectly discriminatory practices of teacher assessments do not only disadvan- tage ethnic minority groups, they have been shown to play a role in how teachers evaluate low-status students (Bourdieu and Passeron, 1990;Westphal et al., 2016).
Since ethnicity and social status are highly correlated, ethnic discrimination in grading is confounded with dis- crimination based on SES (Wenz and Hoenig, 2020). It is thus important to disentangle how much of the ethnic difference in grading can be attributed to ethnic discrim- ination and how much to discrimination based on social status.
The applied residual approach has its limitations be- cause it requires strong assumptions to identify discrim- ination and the exact causal paths between ethnicity and grades (Keuschnigg and Wolbring, 2016;Bozoyan and Wolbring, 2018;Small and Pager, 2020;Wenz, 2020).
Our approach, however, is well suited to explore theso- cialmechanisms of discrimination. We argue that from different theories of discrimination, different analytical predictions can be derived, and they allow us to shed light on the underlying social mechanisms behind dis- crimination in grading. The identification of mecha- nisms helps us in reducing the unexplained part of the ethnic gap in grades.
Identifying the Mechanisms of Discrimination
To reveal the social mechanisms of discrimination in grading, we derive and empirically test predictions from different theories of discrimination. First, theories of statistical discrimination and social psychological mod- els of stereotypic categorization suggest that minority students receive lower grades than majority students conditional on blind competence test scores when they first meet a teacher, but the difference between majority and minority students decreases over time as more infor- mation on individual performance is available. In Hungary, specialized teachers of mathematics and litera- ture meet their students first in the 5th grade.1In our study, the earliest test score data are from 8th grade in study 1 and 6th grade in study 2. In case we find signifi- cant ethnic differences between non-blind teacher assess- ments and blind test scores towards the end of primary school education, it suggests that statistical discrimin- ation or stereotypic categorization models are not the explanation for why Roma students receive lower grades than non-Roma students, controlling for their test results.
Second, we investigate the possibility that teacher assessments are influenced by status generalization
Downloaded from https://academic.oup.com/esr/advance-article/doi/10.1093/esr/jcab023/6355982 by guest on 21 August 2021
processes. Status characteristics theory does not only suggest that minority students receive lower assessments for the same performance. It also suggests that girls have to provide better performance than boys to achieve the same grades, at least in STEM (science, technology, en- gineering, mathematics) subjects, which are considered as stereotypically male domains (Steele, 1997;Spencer, Steele and Quinn, 1999). If status characteristics theory explained the systematic grade differences, we would not only expect Roma students to receive lower grades than non-Roma students, but also that girls receive lower grades than boys conditional on blind test scores, at least in stereotypically male subjects such as mathem- atics. Therefore, we investigate potential gender differ- ences in grades that are beyond test score differences to test whether status generalization processes occur among teachers.
Then, we examine the possibility that teacher assess- ments do not only take into account students’ academic performance but also actual or perceived behaviour, and this practice has a disparate impact on minority and ma- jority students’ grades. In the Hungarian educational system, it is not justified to give lower grades because of students’ inappropriate behaviour since this practice is explicitly prohibited by law.2To test the potential pres- ence of this type of indirect discrimination, we include students’ conduct mark in the analysis, which indicates how teachers perceive and evaluate students’ school behaviour.
We assume that if stereotype-based explanations and disparate impact discrimination do not entirely explain ethnic differences in grading, then minority students are either treated differently because of teachers’ tastes or prejudices, or the difference is caused by other differen- ces between ethnic groups that only impact grades but not test results. The identification of differential treat- ment vs. disparate impact discrimination is helped by our decision to investigate whether teachers’ perceptions of students’ ethnicity are associated with students’
grades over and above students’ ethnic self- identification. Existing empirical studies on ethnic dis- crimination in grading relied on ethnic identification reported by students. In doing so, they implicitly assumed that self-identification represents a consensual classification of ethnicity (Botelho, Madeira and Rangel, 2015). Ethnicity, however, is not an unambiguous con- cept: people’s ethnic self-identification and how their ethnicity is perceived by other people often differ (Telles and Lim, 1998;Saperstein, 2006;Penner and Saperstein, 2015;Saperstein, Kizer and Penner, 2016;Boda, 2019;
Kisfalusi, Janky and Taka´cs, 2019; Kisfalusi, Pa´l and Boda 2020).
The differentiation between self-declared and per- ceived ethnicity can help the identification of social mechanisms underlying discrimination. We agree with those scholars (e.g.Greiner and Rubin, 2011) who argue that immutable characteristics such as ethnicity can have causal effects because in the case of direct—stereo- type-based and taste-based—discrimination, not stu- dents’ actual group belongings matter but the way their ethnicity is perceived by those who discriminate, such as teachers. Hence, teachers’ ethnic perceptions rather than students’ self-identifications are assumed to play a sig- nificant role in discrimination due to differential treat- ment (Angrist and Pischke, 2009) because teachers have to perceive students to belong to the minority group in order to be able to discriminate them based on their ster- eotypes or prejudices. By contrast, ethnic self- identification rather than teachers’ ethnic perceptions are assumed to be more relevant in case ethnic differen- ces in grades are caused by indirectly discriminatory grading practices. If minority students receive lower grades because in the grading process, teachers take into account student characteristics in which minority and majority students differ from each other, e.g. disposi- tions or linguistic style, then actual group belongings are more relevant than teachers’ perceptions of those belongings.
The Situation of the Roma in the Hungarian Educational System
We investigate differences between grades of Roma and non-Roma Hungarian primary school students. The Roma constitute one of the largest ethnic minorities in Europe and the largest one in Hungary (O’Nions, 2016).
In many countries, Roma people experience strong eco- nomic and social exclusion (Kertesi and Ke´zdi, 2011), residential and school segregation (Keme´ny and Janky, 2006;Kertesi and Ke´zdi, 2012), and widespread preju- dice and discrimination (Va´radi, 2014;Bru¨ggemann and D’Arcy, 2017; FRA, 2019; Bruneau et al., 2020).
Negative stereotypes about Roma people’s cognitive abilities and intellectual skills are widely shared, also among teachers (Borda´cs, 2001; Ligeti, 2006). These processes may contribute to the persistent educational inequalities (FRA, 2018): Roma students’ test scores lag behind those of non-Roma students (Kertesi and Ke´zdi, 2011; Hajdu, Kertesi and Ke´zdi, 2019; Keller and Taka´cs, 2019) and they receive lower grades on average in school than majority students (Messing, Neme´nyi and Szalai, 2010;Szalai, 2014; Hajdu, Kertesi and Ke´zdi, 2019).
Downloaded from https://academic.oup.com/esr/advance-article/doi/10.1093/esr/jcab023/6355982 by guest on 21 August 2021
Methods
DataWe use two independent datasets from Hungary that contain information on blind test scores and non-blind teacher assessments. Both studies are linked to data of the National Assessment of Basic Competences (NABC).
The NABC is a blind test similar to the PISA test con- ducted to obtain a standardized measurement of reading comprehension and mathematics for all sixth-, eighth-, and tenth-grade students in the country.
Study 1
Data of study 1 are from the Inter-ethnic Friendship and Hostility survey3conducted in the spring of 2010. The survey used a stratified random sample of 82 primary schools in 75 towns and cities in Hungary (N¼3,430 students). Data were collected among eighth-grade stu- dents in schools with at least 10 per cent and at most 90 per cent Roma students (for details seeHajdu, Kertesi and Ke´zdi, 2019).
Study 2
Data of study 2 are from the third wave of a six-wave panel study conducted among Hungarian primary school students (NT3¼1,054 students, 53 classes in 34 schools in 28 settlements). Third-wave data were col- lected in the autumn of 2014 among sixth-grade stu- dents. The third wave of the research was selected because participating students also took part in the NABC in the same academic year. Students with paren- tal permission (96.9 per cent) filled out a self- administered questionnaire under the supervision of trained research assistants. Schools with a high propor- tion of low-status and Roma students were overrepre- sented in the sample by design (for more details see Kisfalusi, 2018). Five schools were located in the capital city, 9 in small- and mid-size towns, and 20 in rural areas in central Hungary. Most schools in the sample are below the national average concerning output and performance measures.
For the purpose of the present analysis, we selected those classes from the sample for which student and teacher questionnaires, grades, and test scores were all available.4 Based on these selection criteria, our sub- sample consists of 33 classes from 23 schools (N stu- dents¼687, mean age¼12.0, SD age ¼0.7) with a mean class size of 21 students (SD¼5.2). Students with missing data on relevant variables were not included in the regression models.
Measures
Grades (studies 1 and study 2)
In Hungarian schools, students receive summary grades ranging from 1 to 5 (1¼fail, 2¼pass, 3¼satisfactory, 4¼good, 5¼excellent) at the end of each semester. In study 1, grades in mathematics, Hungarian (measured as the mean of literature and grammar grades), and the grade point average (GPA) of all subjects were collected from class records for each student. In study 2, summary grades obtained at the end of the fall semester, after the third wave of data collection, were collected from class records. Moreover, GPA was calculated for every stu- dent based on summary grades in five subjects: mathem- atics, literature, Hungarian grammar, history, and foreign language.5 Students’ grade in mathematics is used as dependent variable in the main regression mod- els, whereas grade in Hungarian literature and students’
GPA is used as dependent variables in robustness checks.
Test scores (studies 1 and 2)
Students’ standardized test scores in reading and math- ematics were obtained from the NABC. Test scores are neither known publicly, nor are they taken into account in grading6or in the process of secondary school admis- sion. Databases of studies 1 and 2 were linked to data of the nearest NABC.7Test scores are nationally standar- dized (mean¼ 0 and SD¼1 in study 1 and mean¼ 1,500, SD¼200 in study 2).
Self-declared ethnicity (studies 1 and 2)
In study 1, students were asked to report their primary and secondary ethnic identification: ‘What is your na- tional or ethnic identity in the first place?’; ‘What is your national or ethnic identity in the second place?’
Students who identified themselves as Roma on any of the two questions are considered as Roma (Hajdu, Kertesi and Ke´zdi, 2019). In study 2, students were asked to classify themselves as ‘Hungarian’, ‘Roma’,
‘both Hungarian and Roma’, or members of ‘another ethnicity’. Students who declared to be Roma or both Roma and Hungarian are coded as Roma, students who declared to be Hungarian or members of another ethni- city8are coded as non-Roma.
Teacher perceptions of ethnicity (study 2)
A dummy variable indicates whether the student was classified as Roma by the homeroom teacher.9Note that in most classes, data on grades reflect the assessment of another teacher. Here, we assume that ethnic
Downloaded from https://academic.oup.com/esr/advance-article/doi/10.1093/esr/jcab023/6355982 by guest on 21 August 2021
perceptions are shared among teachers. Nonetheless, as a robustness check, we repeat the analyses including those classrooms only, in which the homeroom teacher teaches the given subject.
Socio-economic status (study 2)
In study 2, students’ socio-economic background was measured with a dummy variable: it indicates whether caretakers of students are entitled to regular child sup- port allowance. The decision of child support allowance by the notary of the competent local government is based on the education level, employment situation, and living conditions of caretakers.
Conduct mark (study 2)
Students’ school behaviour is graded on a five-point scale with a ‘conduct mark’ by the homeroom teacher.
The conduct mark depends on whether students behave according to the rules of the school, e.g. whether stu- dents have written warnings and reprimands, but does not capture diligence during lessons, for instance.
Conduct marks were collected from class records.
Conduct marks from the fall semester were not available for six classes; these missing data were imputed with self-reported conduct marks for the same semester from the NABC dataset.
Gender (study 2)
Gender is measured based on students’ self-reports.
Girls are coded as 1.
Special educational needs (study 2)
A dummy variable controls for students’ special educa- tional needs.
Analytical Strategy
Study 1 is used to detect the extent of the ethnic differ- ence in grades after controlling for blind test scores, using a large-scale dataset. The underlying mechanisms are analysed in study 2.
In the main analysis, students’ grade obtained in mathematics is the dependent variable, while blind test score in mathematics is controlled for. We use mathem- atics in our main model because unlike the evaluation in literature and grammar classes, grades in mathematics are mostly based on exercises similar to the ones in blind competence tests (Botelho, Madeira and Rangel, 2015).
Since the dependent variable is ordinal, we estimate multilevel random intercept ordered logit models in our main analysis. Parameter estimates and odds ratios of nested ordered logit models are not directly comparable
with each other (Mood, 2010). Therefore, marginal effects, which are not seriously affected by rescaling bias, are calculated and compared in the different model specifications. For testing the statistical significance of the change between marginal effects of interest across different models, we use the newly developed method suggested byMize, Doan and Long (2019), which uses seemingly unrelated estimation to combine estimates from multiple models using the gsem command in Stata.
Several robustness checks using grades in other sub- jects as dependent variable and estimating models with classroom fixed effects are available in Supplementary Tables S2–S15. The replication package containing the dataset of study 2 and the syntax files is attached to the article and is available at https://osf.io/s3u8p/.
Results
DescriptivesTable 1presents the relationship of the dependent and independent variables with students’ self-declared ethni- city. Consistent with previous findings, self-declared Roma students have significantly lower grades and test scores on average than non-Roma students in both stud- ies. Important gender differences were also found with regard to teacher assessments in study 2. Descriptive sta- tistics of these differences is found in Supplementary Table S1.
Ethnic Difference in Grades
Results of study 1 show that Roma students receive lower grades on average in mathematics than non-Roma students, even after controlling for blind test scores (b¼ –1.10,P<0.001; seeTable 2). Average marginal effects (AMEs) show that self-declared Roma students are 4.9 percentage points more likely to receive grade 1 (‘Fail’, P<0.001) and 11.9 percentage points more likely to re- ceive grade 2 (‘Pass’, P<0.001) than non-Roma stu- dents with similar blind test scores. In the meantime, self-declared Roma students are 6.4 percentage points less likely to receive grade 4 (‘Good’,P<0.001) and 9.3 percentage points less likely to receive grade 5 (‘Excellent’, P<0.001) than non-Roma students with similar blind test scores. Although the difference for grade 3 (‘Satisfactory’) is statistically significant, it is not substantial in magnitude (AME¼–0.010,P¼0.023).
The associations are similar in study 2 (model 1 in Table 3), even after controlling for special educational needs and gender (model 2 in Table 3). Model 3 (in Table 3) shows that if students’ SES is also included in the model, the effect of ethnicity on grade decreases
Downloaded from https://academic.oup.com/esr/advance-article/doi/10.1093/esr/jcab023/6355982 by guest on 21 August 2021
Table1.Descriptivestatisticsaboutthevariablesaccordingtoethnicity(self-declaredRomavs.self-declarednon-Roma,perceivedasRomavs.perceivedasnon-Roma) instudy1andstudy2,wave3 Study1Self-declaredRomaSelf-declarednon-RomaTotalN N¼711N¼2,719N¼3,430 MeanSDMeanSDMeanSD GPA2.940.883.790.84***3.610.903,430 Mathematicsgrade2.370.933.311.14***3.111.203,404 Hungariangrade(meanofliteratureandgrammar)2.810.943.71.03***3.521.103,427 Mathematicstestscore(mean¼0,SD¼1)0.810.870.130.96***0.271.003,199 Readingtestscore(mean¼0,SD¼1)0.850.890.180.95***0.311.003,198 Study2Self-declaredRomaSelf-declarednon-RomaPerceivedasRomaPerceivedasnon-RomaTotalN N5191N5426N5235N5452N5687 MeanSDMeanSDMeanSDMeanSDMeanSD GPA2.550.903.630.99***2.490.943.680.93***3.271.10643 Mathematicsgrade2.491.013.531.15***2.471.083.571.12***3.201.20641 Literaturegrade2.521.073.651.15***2.441.073.721.11***3.281.30643 Conductmark3.430.974.260.82***3.340.964.310.78***3.981.00617 Mathematicstestscore(mean¼1,500,SD¼200)1,3581661,484181***1,3681711,482178***1,447184591 Readingtestscore(mean¼1,500,SD¼200)1,2991651,480205***1,3011651,485205***1,429211592 Lowsocio-economicstatus81.7%23.5%***83.4%21.0%***42.4%687 Specialeducationalneed7.9%7.0%8.1%6.6%7.1%687 Notes:Grades,conductmark,andGPArangefrom1(fail)to5(excellent).Study1:181classes.Study2:33classes. P<0.1,P<0.05,P<0.01,***P<0.001. Downloaded from https://academic.oup.com/esr/advance-article/doi/10.1093/esr/jcab023/6355982 by guest on 21 August 2021
significantly (differences between model 2 and model 3 in AMEs for ethnicity: grade 1: –0.018,P¼0.032, grade 2: –0.025,P¼0.025, grade 3: –0.002,P¼0.683, grade 4: 0.020, P¼0.018, grade 5: 0.024, P¼0.018).
However, the ethnic coefficient is still significant (b¼– 0.98,P¼0.004).
Figures 1and2present marginal effects for ethnicity at different values of test scores calculated based on par- ameter estimates in model 3 inTable 3. Roma students are more likely than non-Roma students to receive grade 1 throughout almost the entire range of test scores, ex- cept in the case of very high test scores where probabil- ities are similarly low. They are also more likely to receive grade 2 in almost the entire range of test scores, except in the case of very low test scores where they are more likely to receive even worse grades. Meanwhile, Roma students are less likely than non-Roma students to receive grade 5 throughout the entire range of test scores, and they are also less likely to receive grade 4, expect in the case of high test scores where non-Roma students are more likely to receive grade 5 (Figure 2).
Parameter estimates in model 3 inTable 3also show that conditional on test scores, low status students are less likely than higher status students to receive higher grades (b¼–0.80,P¼0.003). As an additional analysis, interaction effects between ethnicity and gender and
between ethnicity and SES were also investigated but found to be not significant (those models are not shown inTable 3).
Mechanisms of Ethnic Discrimination in Grading Theories of statistical discrimination (Phelps, 1972;
Arrow, 1973; Aigner and Cain, 1977) and category- based models of impression formation (Fiske and Neuberg, 1990;Fiske, 1998) propose that teachers rely on their stereotypes until more accurate information on individual performances becomes available. The fact that the significant ethnic differences reported inTables 2 and 3, model 3, are found among eighth-grade stu- dents (study 1) and sixth-grade students (study 2) sug- gests that these theories are not able to explain the ethnic difference in grades.
As a next step, we investigate whether teacher assess- ments are influenced by status generalization processes as suggested by status characteristics theory (Berger, Cohen and Zelditch, 1972; Ridgeway, 1991; Correll and Ridgeway, 2006). If status generalization processes underlie grade differences, not only minority students should receive lower assessments for the same perform- ance but also girls, especially in stereotypically male domains such as mathematics. Model 3 in Table 3 Table 2.Parameter estimates of multilevel ordered logit regression models predicting grades in mathematics and average marginal effects for self-declared ethnicity (Roma vs. non-Roma) in study 1
Model 1
Estimate SE P
Test score: mathematics 1.671 0.083 <0.001
Roma (self-declared) 1.103 0.126 <0.001
Cutpoint 1 5.020 0.186 <0.001
Cutpoint 2 1.572 0.089 <0.001
Cutpoint 3 0.031 0.077 0.689
Cutpoint 4 1.790 0.101 <0.001
Class-level variance 0.770 0.136
AIC 7,673.122
BIC 7,715.568
Average marginal effects for self-declared ethnicity (Roma vs. non-Roma)
AME SE P
Grade 1 0.049 0.008 <0.001
Grade 2 0.119 0.016 <0.001
Grade 3 0.010 0.005 0.023
Grade 4 0.064 0.009 <0.001
Grade 5 0.093 0.010 <0.001
Notes: Test scores are nationally standardized (mean¼0, SD¼1). Standard errors are clustered around classes.N¼3,177 students, 180 classes.
Downloaded from https://academic.oup.com/esr/advance-article/doi/10.1093/esr/jcab023/6355982 by guest on 21 August 2021
Table3.Parameterestimatesofmultilevelorderedlogitregressionmodelspredictinggradesinmathematicsandaveragemarginaleffectsforself-declaredethnicity (Romavs.non-Roma)instudy2,wave3 Model1Model2Model3Model4 EstimateSEPEstimateSEPEstimateSEPEstimateSEP Testscore:mathematics0.0090.001<0.0010.0090.001<0.0010.0090.001<0.0010.0080.001<0.001 Roma(self-declared)1.1710.307<0.0011.2890.318<0.0010.9820.3400.0040.6330.3500.070 Girl0.7320.204<0.0010.7590.193<0.0010.1940.2000.331 Specialeducationalneed0.4120.4320.3410.4200.4430.3430.4220.3900.279 Lowsocio-economicstatus0.7990.2720.0030.5100.2680.057 Conductmark1.0970.119<0.001 Cutpoint18.2191.036<0.0018.4741.019<0.0017.9060.988<0.00110.9721.109<0.001 Cutpoint210.7531.002<0.00111.0810.985<0.00110.5450.966<0.00113.9571.148<0.001 Cutpoint312.7061.029<0.00113.0861.002<0.00112.5840.984<0.00116.1901.193<0.001 Cutpoint414.8231.100<0.00115.2571.092<0.00114.7751.065<0.00118.5431.269<0.001 Class-levelvariance1.6630.5131.7520.5231.7310.4831.5280.507 AIC1,229.5731,214.5291,206.7561,133.588 BIC1,259.2271,252.6571,249.1201,180.188 Averagemarginaleffectsforself-declaredethnicity(Romavs.non-Roma) AMESEPAMESEPAMESEPAMESEP Grade10.0600.0220.0070.0650.0230.0060.0470.0210.0240.0260.0160.107 Grade20.0900.0270.0010.0970.027<0.0010.0720.0270.0070.0420.0230.070 Grade30.0180.0110.1060.0190.0120.1040.0170.0090.0480.0120.0070.087 Grade40.0630.0210.0030.0680.0210.0010.0480.0200.0170.0250.0160.115 Grade50.1050.026<0.0010.1120.026<0.0010.0880.0290.0020.0550.0290.055 Notes:Testscoresarenationallystandardized(mean¼1,500,SD¼200).Mathematicsgradeandconductmarkrangefrom1(fail)to5(excellent).Differencesbetweenmodel2andmodel3inAMEsforethnicity:grade1:–0.018, P¼0.032,grade2:–0.025,P¼0.025,grade3:–0.002,P¼0.683,grade4:0.020,P¼0.018,grade5:0.024,P¼0.018.Differencesbetweenmodels3and4inAMEsforethnicity:grade1:–0.021,P¼0.029,grade2:–0.029, P¼0.041,grade3:–0.006,P¼0.299,grade4:0.023,P¼0.026,grade5:0.033,P¼0.025.N¼511students,33classes. Downloaded from https://academic.oup.com/esr/advance-article/doi/10.1093/esr/jcab023/6355982 by guest on 21 August 2021
shows that conditional on test scores, girls are more like- ly than boys to receive higher grades in mathematics (b
¼0.76,P<0.001). This contradicts the idea that status generalization processes play a role in teacher assessments.
Then, we investigate a potential source of disparate impact discrimination: we assume that teachers inad- equately take into account students’ actual or perceived school behaviour when assigning grades. To test this as- sumption, we include students’ conduct mark in the ana- lysis, which indicates how teachers perceive and evaluate students’ school behaviour. Model 4 inTable 3 shows that the inclusion of students’ conduct mark
significantly decreases the effect of ethnicity on grades compared to model 3 (differences between models 3 and 4 in AMEs for ethnicity: grade 1: –0.021, P¼0.029, grade 2: –0.029,P¼0.041, grade 3: –0.006,P¼0.299, grade 4: 0.023,P¼0.026, grade 5: 0.033,P¼0.025).
Even in this model, however, Roma students are less likely than non-Roma students to receive higher grades, although this association is only significant at the 0.1 level (b ¼–0.63,P¼0.070). Similarly, low status stu- dents are less likely than higher status students to receive higher grades (b¼–0.51,P¼0.057). In addition, stu- dents having higher conduct marks are more likely to re- ceive higher grades than students having lower conduct marks (b ¼1.10,P<0.001). The gender difference in grading, however, is not significant after the inclusion of conduct marks (b¼0.19,P¼0.331).
Our findings are robust to several different model specifications, which can be found in Supplementary Tables S2–S7. In short, all models demonstrate that a large amount of ethnic difference in grades cannot be explained by an ethnic difference in competence meas- ured with blind test scores. While students’ SES and classroom behaviour evaluated by the homeroom teach- er seem to be important factors behind the ethnic differ- ence in grading, a small ethnic difference still remains in grades in most of our model specifications after account- ing for these factors. In the case of GPA, this difference is significant at the 0.05 level, in the case of grade in mathematics, it is only significant at the 0.1 level, whereas in the case of grade in literature, it is not signifi- cant in our relatively small sample (P¼0.144).
A potential explanation for the remaining ethnic dif- ference in grades can be taste-based discrimination against Roma students. Since we do not have data on teachers’ preferences and prejudices, we cannot directly test whether taste-based discrimination occurs in grad- ing. We can test, however, whether teachers’ perceptions about their students’ ethnicity explain ethnic differences in grades more than students’ ethnic self-identification.
Taste-based discrimination requires that teachers recog- nize minority students’ group membership and evaluate those students more negatively whom they perceive to belong to the minority group. Therefore, in the last step, we include both students’ ethnic self-identification and teachers’ ethnic perceptions in the analysis.
There is a strong association between students’ self- declared and perceived ethnicity: in most cases, teachers’
categorization of students’ ethnicity is consistent with students’ ethnic self-identification. Still, there are 29 stu- dents who declared to be Roma in the third wave but were not perceived as Roma by the teacher, whereas there are 38 students who declared to be non-Roma in
0.2.4.6.8Probability
1000 1200 1400 1600 1800 2000
Mathematics test score
Grade 4 non−Roma Grade 4 Roma Grade 5 non−Roma Grade 5 Roma
Figure 2. Predicted probabilities of self-declared Roma and non-Roma students for receiving grades 4 and 5 in mathematics at different test scores, controlling for gender, low socio-economic status, and special educational needs in study 2 (calculated based onTable 3, model 3,N¼511). Test scores are nationally standardized (mean¼1,500, SD¼200)
0.2.4.6Probability
1000 1200 1400 1600 1800 2000
Mathematics test score
Grade 1 non−Roma Grade 1 Roma Grade 2 non−Roma Grade 2 Roma
Figure 1. Predicted probabilities of self-declared Roma and non-Roma students for receiving grades 1 and 2 in mathematics at different test scores, controlling for gender, low socio-economic status, and special educational needs in study 2 (calculated based onTable 3, model 3,N¼511). Test scores are nationally standardized (mean¼1,500, SD¼200)
Downloaded from https://academic.oup.com/esr/advance-article/doi/10.1093/esr/jcab023/6355982 by guest on 21 August 2021
the third wave but were perceived as Roma by the teach- er. Due to missing data, only 23 and 27 of these students can be included in the analysis, respectively. This small number of inconsistent ethnic categorization does not allow us to detect statistically significant differences be- tween parameter estimates of self-declared and per- ceived ethnicity, but some patterns can be observed based on the magnitude of these parameters.
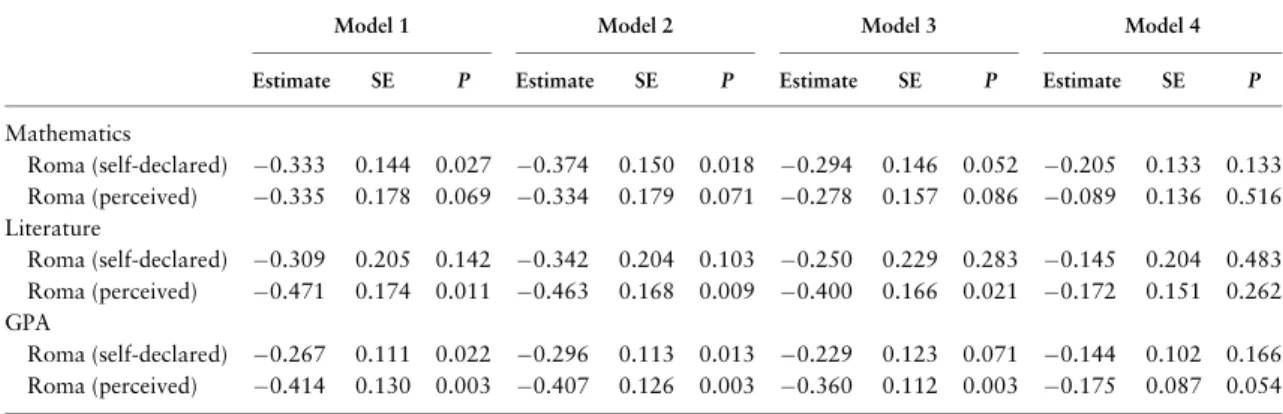
Models including both students’ self-identification and teachers’ ethnic perceptions are found in Supplementary Tables S8–S12. For an easier and clearer comparison,10 Table 4summarizes parameter estimates for self-declared and perceived ethnicity estimated with fixed effects linear models. In the case of mathematics, parameter estimates for self-declared and perceived ethnicity are similar in mag- nitude in model 1, but in models 2–4, self-declared ethni- city seems to have a larger effect on mathematics grade. In contrast, perceived ethnicity seems to show a larger effect on literature grade and GPA than self-declared ethnicity.
Furthermore, in some models (literature: models 1–3, GPA: model 4), perceived ethnicity is significantly associ- ated with grades whereas self-declared ethnicity is not, if both are included.11
Conclusions and Discussion
In the present study, we aimed to shed light on the mech- anisms of ethnic discrimination in grading. It is import- ant to note that discrimination does not equal to mere inequality that describes average group differences.
Discrimination covers two kinds of unjustified distinc- tions. First, direct discrimination is unequal treatment
on the basis of a social category. Theories attribute dir- ect discrimination to existing stereotypes or taste-based differences. Second, disparate impact or indirect dis- crimination is systematic differentiation based on inad- equately justified factors that favour members of one social category over members of another category (Blank, Dabady and Citro, 2004;Pager and Shepherd, 2008).
We investigated the possible mechanisms of discrim- ination empirically using the situation of Roma students in the Hungarian education system as test case. In line with previous empirical studies from other countries (Burgess and Greaves, 2013; Kiss, 2013; Botelho, Madeira and Rangel, 2015; Hinnerich, Ho¨glin and Johannesson, 2015;Triventi, 2019), we found evidence for a significant difference in the grades of Roma and non-Roma students conditional on standardized blind test scores and other relevant covariates such as parental SES. This finding is robust using two different studies with considerable differences in sample selection proced- ure and time of data collection, and to various alterna- tive model specifications.
First, we discussed the possibility that prior beliefs or stereotypes play a role in teacher assessments. Since our data did not allow to investigate grading discrimination when teachers started to teach the students, we cannot rule out the possibility that statistical discrimination (Phelps, 1972;Arrow, 1973;Aigner and Cain, 1977) or category-based impression formation (Fiske and Neuberg, 1990; Fiske, 1998) play a role in teacher assessments. The fact that we have found this consider- able ethnic difference in grades towards the end of
Table 4.Parameter estimates for self-declared and perceived ethnicity (Roma vs. non-Roma) from fixed-effects linear re- gression models predicting grades in mathematics, literature, and GPA in study 2, wave 3
Model 1 Model 2 Model 3 Model 4
Estimate SE P Estimate SE P Estimate SE P Estimate SE P
Mathematics
Roma (self-declared) 0.333 0.144 0.027 0.374 0.150 0.018 0.294 0.146 0.052 0.205 0.133 0.133 Roma (perceived) 0.335 0.178 0.069 0.334 0.179 0.071 0.278 0.157 0.086 0.089 0.136 0.516 Literature
Roma (self-declared) 0.309 0.205 0.142 0.342 0.204 0.103 0.250 0.229 0.283 0.145 0.204 0.483 Roma (perceived) 0.471 0.174 0.011 0.463 0.168 0.009 0.400 0.166 0.021 0.172 0.151 0.262 GPA
Roma (self-declared) 0.267 0.111 0.022 0.296 0.113 0.013 0.229 0.123 0.071 0.144 0.102 0.166 Roma (perceived) 0.414 0.130 0.003 0.407 0.126 0.003 0.360 0.112 0.003 0.175 0.087 0.054
Notes: Mathematics grade, literature grade, and GPA range from 1 (fail) to 5 (excellent). Model 1 controls for test score, model 2 controls for test score, gender, and special educational needs, model 3 controls for test score, gender, special educational needs, and low socio-economic status, and model 4 controls for test score, gender, special educational needs, low socio-economic status, and conduct mark. Class fixed effects are included. Standard errors are clustered around classes. The whole models can be found in Supplementary Tables S8, S10, and S12.N¼511 for mathematics, 513 for literature, 512 for GPA, 33 classes.
Downloaded from https://academic.oup.com/esr/advance-article/doi/10.1093/esr/jcab023/6355982 by guest on 21 August 2021
primary school education suggests, however, that these are not the explanations for why Roma students receive lower grades than non-Roma students, controlling for test results.
Second, we tested whether status generalization proc- esses underlie discrimination (Berger, Cohen and Zelditch, 1972;Ridgeway, 1991;Correll and Ridgeway, 2006). If this is the case, then we should not only find an ethnic difference in grades, but girls should also perform better than boys to achieve the same grades in stereotyp- ically male domains such as mathematics (Steele, 1997;
Spencer, Steele and Quinn, 1999). To the contrary, girls received better mathematics grades than boys with the same blind competence scores. This is in line with the results of previous empirical studies (Lindahl, 2007;
Lavy, 2008;Kiss, 2013).
Third, based on the literature on grading practices (Malouff, 2008;Hardre´, 2014), we have assumed that teacher assessments also indicate how students conform to school norms and expectations. We have argued that we can draw inference about conformity to school norms from individual conduct marks that indicate how the teacher perceives and evaluates student’s school be- haviour. The inclusion of conduct mark in the analysis decreased the ethnic difference in grades significantly.
Different causal mechanisms can explain this finding.
It is possible that Roma students behave differently in schools, and they do not only receive lower conduct mark because of their behaviour, but they are also pun- ished in their grades. Another possibility is that percep- tion of students’ behaviour is itself subject to cognitive biases and discrimination and majority teachers perceive minority students’ behaviour less favourably than that of majority students (Downey and Pribesh, 2004;Dee, 2005). Therefore, minority students receive lower con- duct mark and they are also punished in their grades be- cause of their differently perceived behaviour. We do not have data on students’ actual behaviour, we thus cannot rule out any of these possibilities. In both cases, however, Roma students are indirectly discriminated against in teacher assessments because teachers take into account a factor that is not related to students’ compe- tences, and this practise has a disparate impact on the assessment of minority and majority students. In the Hungarian educational system, it is prohibited to give lower grades because of students’ inappropriate behav- iour. Yet another possible explanation can be that Roma students perform below their ability level in school and receive both lower grades and lower conduct mark be- cause of it. The literature on oppositional culture and the acting white hypothesis suggests that minority stu- dents perform below their ability level due to peer
pressure arising from anti-achievement norms (Fordham and Ogbu, 1986;Fryer and Torelli, 2010). Although we have not investigated this possibility in the current ana- lysis, previous analyses on the association between Hungarian Roma students’ academic achievement and social relationships using the same samples, we used in this study have shown that Roma students do not ex- clude or sanction their high-performing Roma peers (Habsz and Rado´, 2018;Kisfalusi, 2018;Hajdu, Kertesi and Ke´zdi, 2019). This suggests that there is no peer pressure on Roma students to camouflage their efforts and competencies.
Since an ethnic difference in grades has still remained after accounting for students’ conduct mark, we could not rule out the possibility that there is taste-based dis- crimination in teacher assessments against Roma stu- dents. The fact that teachers’ ethnic perceptions seem to play a more important role in grading than students’ eth- nic self-identification, at least in the case of literature and GPA, also supports the possibility that teacher assessments are influenced by teachers’ ethnic preferen- ces and prejudices.
Our study is not without limitations. To study dis- crimination, we analysed observational data and fol- lowed a residual analytical approach to identify social mechanisms behind differential treatment and disparate impact discrimination. The residual approach has well- known weaknesses as it is vulnerable to the consequen- ces of unobserved heterogeneity (Cancio, Evans and Maume, 1996;Small and Pager, 2020) as well as to the possibility of overcontrol (Pager and Shepherd, 2008;
Keuschnigg and Wolbring, 2016; Neil and Winship, 2019; Wenz, 2020). Therefore, we were cautious in making causal interpretations, and we emphasized that our control variables might have been endogenous to the process of discrimination. Furthermore, it should be noted that study 2, which was used to investigate the mechanisms of discrimination, is not representative, be- cause the sample intentionally overrepresented schools with a higher share of Roma students.
Some scholars highlight that it is difficult to clearly distinguish disparate impact discrimination from ethnic inequality (see e.g.Wenz, 2020: p. 67). Disparate impact discrimination occurs in grading when teachers take into account factors in their evaluations that are not legitim- ate parts of the grading process (Blank, Dabady and Citro, 2004). Grading systems may differ in what factors are allowed to be used in grading. Taking into account diligence and effort, for instance, is justified in systems where grades are used to provide feedback to students, but they are unjustified where students with the same knowledge and competences are to receive the same
Downloaded from https://academic.oup.com/esr/advance-article/doi/10.1093/esr/jcab023/6355982 by guest on 21 August 2021
chances to continue their studies in the same academic track. Taking into account student school behaviour in the grading process is clearly unjustified in the Hungarian educational context as this practice is expli- citly prohibited by law. Taking this into consideration, our conclusions on discrimination hold only if the con- duct mark does not exclusively correlate with that part of student ability that is not reflected in blind standar- dized test but is observed by teachers.
Another caveat concerning the measurement of per- ceived ethnicity is that whereas homeroom teachers were asked to classify students as Roma or non-Roma, students’ performance was evaluated by the teacher who taught the given subject. For the majority of students in the sample, these two people were different. Although we assume that teachers are likely to share an opinion about who is Roma in a given class as social ties influ- ence ethnic perceptions (Boda, 2018), it is of course pos- sible that the mathematics or the literature teacher has a different perception about a student’s ethnicity than the homeroom teacher. It is important to emphasize, how- ever, that even with this way of measurement we found that students who are perceived as Roma by the home- room teacher receive lower grades in the examined sub- jects. In the case of literature grade and GPA, moreover, perceived ethnicity had a larger effect on grades than self-declared ethnicity, although this difference was stat- istically not significant, probably due to low statistical power. In addition, teachers might not only influence ethnic perceptions but also the direct stereotype- or taste-based discrimination tendencies of each other (Taka´cs, Bravo and Squazzoni, 2018).
Despite these limitations, our study is a significant contribution in multiple ways. We have demonstrated how to test for the presence of theoretical mechanisms that are able to explain discrimination in grading. As an innovative contribution, we have attempted to disentan- gle different mechanisms by looking at students’ self- declared ethnicity and also at teachers’ perception of students’ ethnicity. These contributions go beyond the analysis we conducted for studying ethnic discrimin- ation in grading in Hungary. The results suggest that Roma students are not the only social group that is dis- criminated against in teacher assessments: boys and low status students also receive lower grades than girls and higher status students with similar competences. The findings indicate that a considerable part of discrimin- ation is caused by the disparate impact of indirectly dis- criminatory grading practices: despite the legislation, teacher assessments do not only take into account com- petencies but also how students conform to school norms and expectations. In the case of Roma students
and low status students, furthermore, we did not rule out the possibility that taste-based discrimination also exists. Discrimination in grading thus further reinforces already existing educational inequalities.
Notes
1 In the Hungarian educational system, the 8-year- long primary school education consists of two 4- year-long phases. In the first 4 years, the homeroom teacher teaches most subjects. From the fifth grade on, every subject is taught by specialized teachers.
The teachers usually remain the same for the entire 4-year-long period.
2 See the Act CXC of 2011 on National Education 54.§(1).
3 The Inter-ethnic Friendship and Hostility (IEFH) survey was designed and supervised by Ga´bor Kertesi and Ga´bor Ke´zdi and was financed by the Educatio Kht, Hungary. The data were collected by the Adatgy}ujt}o Inte´zet, Hungary, in the spring of 2010. Hajdu, Kertesi, and Ke´zdi (2019) provide a detailed description of the study.
4 Teacher questionnaires are missing in the case of 8 classes, test scores are missing in the case of 14 classes, and grades are missing in the case of 4 classes.
5 Subjects in natural sciences such as physics, biol- ogy, and chemistry are incorporated in the curricu- lum at later grades.
6 The evaluation of the test is organized centrally by the Educational Authority. Therefore, teachers do not know the student whose test they correct. The test results are published several months later.
Individual test scores can be accessed with an indi- vidual identification code. This is obtained for re- search purposes only if parental consent is received.
7 In study 2, grades obtained at the end of the semes- ter when the 2015 NABC test was written are not available in the dataset. Hence, grades were meas- ured earlier in time than test scores. We argue that this is not a problem in the case of our analysis for two reasons. First, we do not intend to identify a causal relationship between test scores and grades but argue that these two assessments are aimed to measure different elements of the same concept:
students’ academic achievement. We use test scores as a proxy for competence, which is assumed to be non-varying under a short time period. In the meantime, we acknowledge that grades do not only rely on competence but take into account other fac- tors affecting academic achievement as well. Our
Downloaded from https://academic.oup.com/esr/advance-article/doi/10.1093/esr/jcab023/6355982 by guest on 21 August 2021
aim is to examine whether there are systematic eth- nic differences in the process how these factors are translated into grades. Second, summary grades at the end of a semester summarize grades obtained earlier during the school year. In the Hungarian educational system, summary grades at the end of the fall semester rely on grades obtained between September and January, whereas summary grades at the end of the spring semester rely on grades obtained during the entire academic year between September and June, thus, also include grades from the fall semester. Therefore, the correlation be- tween summary grades of the fall and the spring se- mester is usually very high. In the sample of study 2, for instance, the correlation coefficient between students’ GPAs in the fall and spring semester was 0.948 (P<0.001), whereas the correlation coeffi- cient between students’ mathematics grades in the fall and spring semester was 0.877 (P < 0.001) when students attended the fifth grade.
8 Two students declared to belong to another ethni- city: Russian and Finnish.
9 In the Hungarian educational system, the home- room teacher is responsible for a class size group of students—designated to the same home- room—in terms of administrative tasks, keeping contact with parents and other teachers, organiz- ing out-of-school activities for students, and con- ducting discussion classes. Usually, the homeroom teacher also teaches one or more sub- jects to the class.
10 Since log odds/odds ratios cannot be directly com- pared (Mood, 2010), we could only compare mar- ginal effects of the ordered logit models. But because our dependent variable is an ordered vari- able with five categories, five separate average mar- ginal effects belong to both self-declared and perceived ethnicity, which makes the parameter comparison much less straightforward in the case of the ordered logit models.
11 The results are robust to the exclusion of classes where the person who reports students’ perceived ethnicity (the homeroom teacher) is not the same who teaches the given subject and awards grades (mathematics: Supplementary Table S9,N ¼100 students, 6 classes; literature:Supplementary Table S11,N¼179, 10 classes).
Supplementary Data
Supplementary dataare available atESRonline.
Acknowledgements
We thank Ga´bor Kertesi, Ga´bor Ke´zdi, and Tama´s Hajdu for providing us access to the database of the Inter-ethnic Friendship and Hostility survey. We are grateful to the four an- onymous reviewers and the editors for their helpful comments and suggestions. The article is dedicated to the memory of Ga´bor Ke´zdi (1971–2021), a pioneer of quantitative research on discrimination against the Roma in the public education and the labour market.
Funding
This work was supported by the project ‘From Talent to Young Researcher project aimed at activities supporting the research career model in higher education’, identifier EFOP- 3.6.3-VEKOP-16-2017-00007 co-supported by the European Union, Hungary, and the European Social Fund to D.K., the U´ NKP-16-4 New National Excellence Program of the Ministry of Human Capacities to D.K., the Lendu¨let program of the Hungarian Academy of Sciences (Project title:
‘Competition and Negative Networks’ to K.T.), and the European Research Council (ERC) under the European Union’s Horizon 2020 research and innovation programme (grant agreement No 648693 to K.T.).
References
Aigner, D. J. and Cain, G. G. (1977). Statistical theories of dis- crimination in labor markets.ILR Review,30, 175–187.
Altonji, J. G. and Blank, R. M. (1999). Race and gender in the labor market. In Ashenfelter, O. C. and Card D. (Eds):
Handbook of Labor Economics, Vol.3. Amsterdam: Elsevier, pp. 3143–3259.
Ammermueller, A. (2007). Poor background or low returns?
Why immigrant students in Germany perform so poorly in the programme for international student assessment.Education Economics,15, 215–230.
Angrist, J. D. and Pischke, J.-S. (2009). Mostly Harmless Econometrics: An Empiricist’s Companion. Princeton, Oxford: Princeton University Press.
Arrow, K. J. (1973). The theory of discrimination. In Ashenfelter O. and Rees A. (Eds.), Discrimination in Labor Markets.
Princeton, New Jersey: Princeton University Press, pp. 3–33.
Becker, G. S. (1957). The Economics of Discrimination.
Chicago: The University of Chicago Press.
Becker, R. and Hecken, A. E. (2008). Why are working-class chil- dren diverted from universities?—An empirical assessment of the diversion thesis.European Sociological Review,25, 233–250.
Bennett, R. E.et al.(1993). Influence of behavior perceptions and gender on teachers’ judgments of students’ academic skill.
Journal of Educational Psychology,85, 347–356.
Berger, J., Cohen, B. P. and Zelditch, M. (1972). Status charac- teristics and social interaction.American Sociological Review, 37, 241.
Bernstein, B. (1971). Class, Codes and Control. Volume 1:
Theoretical Studies towards a Sociology of Language. London and New York: Routledge and Kegan Paul.
Downloaded from https://academic.oup.com/esr/advance-article/doi/10.1093/esr/jcab023/6355982 by guest on 21 August 2021