THE STATUS OF THE YOUNG - THE RESULTS OF A YOUTH RESEARCH
In the autumn of 2016 in the city of Eger we executed a youth research encompassing many questions. We reached out to the sample by online questionnaires, and we had 500 people as a sample. We were aiming for a balance between male and female participants in the sample, and also between place of residence (namely Eger residents and commuters).
The questionnaire, serving as measuring instrument of the survey, can be divided into 4 bigger topics. Beyond the socio-demographic data (e.g. gender, age, education of parents, place of residence, financial situation) we tried to explore how young people usually spend their spare time. After examining the quantity of their spare time, we asked them about how they spend it, and who influences them in deciding about the free time activities (e.g.
quantity of free time on weekdays and weekends, preferred activities on weekdays and weekends, who „drives” free time activities, what type of activities they miss).
The following group of questions aimed to explore the future plans. Some questions were about the general view of the world, planned studies and diploma, where they imagine themselves in the future, and if they plan any studies or work abroad. Also there is a question regarding young people’s set of values.
We were also interested in how young people see the various social problems, and how they are affected by those. In connection with these topics we asked them about the frequency of some deviant, or nearly deviant behaviour.
Finally, according to the challenges of our time, we tried to explore young people’s opinion and behaviour regarding social media.
Introduction
In this article we aim to present some results of a broader research. In the autumn of 2016 our questionnaire study was part of our extensive research, which was based on
many methods. We surveyed the young citizens of Eger from different angles, with the aim to provide some results about young people’s status, problem, and plans, supporting the Youth Concept, which is under elaboration.
493 people took part in the survey. During the planning phase we decided to have 500 people, taking diversity into account, and aiming a certain balance between male and female participants, place of residence (local residents, commuters and students living in student hostels). Besides the classic gender diversity we consider the place of residence as an important variable, or group forming factor, if these young people live in Eger, or commute to the town. When determining the number of sample, we considered that we have a lot of information about the population, moreover, we also considered that the population is highly homogenous (Héra and Ligeti, 2005) and Falus (1996). However, Iván Falus considers that it is necessary to involve 5-6% of the population in the case of studies regarding high-school students (Falus, 1996).
After cleaning the data gained from the 500 surveys, we found 7 surveys with insuffi- cient data, therefore those were excluded from the evaluation.
The questionnaire, serving as measuring instrument of the survey, can be divided to 4 bigger topics. Beyond the socio-demographic data (e.g. gender, age, education of parents, place of residence, financial situation) we tried to explore how young people usually spend their spare time. After examining the quantity of their spare time, we asked how them about how they spend it, and who influences them in deciding about the free time activi- ties (e.g. quantity of free time on weekdays and weekends, preferred activities on weekdays and weekends, who „drives” free time activities, what type of activities they miss).
The following group of questions aimed to explore the future plans. Some questions were about the general view of the world, planned studies and diploma, where they imagine themselves in the future, and if they plan any studies or work abroad. Also there is a question regarding young people’s set of values.
We were also interested in how young people see the various social problems, and how they are affected by those. In connection with these topics we asked them about the frequency of some deviant, or nearly deviant behaviour.
If it was possible, or the features of the variant allows it, we asked the questions in the format of an attitude scale. We did this with the consideration that more data can be
collected in shorter period of time. (We had to take into consideration that the ques- tionnaire was often filled in during a lesson in school, therefore they had limited time to complete it.) Moreover, if we ask the questions in this format, we will have less missing answers. In other cases we applied yes-no questions, or asked for exact data.
Presentation of the sample
As for the ages, the youngest responder was 14 years old, the oldest was 25. The average age of our sample is 16.5 years old, and they typical, most frequent responder is also 16 years old. This result is obvious, as a significant part of the questionnaires were filled in in high schools, so our primary target group was students attending secondary school.
As regards the distribution of gender, the ratios are balanced. Since we did not aim for representativeness in gender distribution, this data is considered to be favourable, an major corrections were not required.
Regarding education, 19 people from the responders said that the highest education level of the father is primary school (8 years of primary education in Hungary). Most of the responders said that their father graduated from secondary education (144 people, 337%); and one quarter of the sample (106 people) replied that their father graduated from college or university. As for the mothers, the data we received moved towards the „edge of the scale”. 26 people said that their mother has primary school education (6%), while 160 people responded that their mother has a diploma from higher educa- tion (38%). As the number of mothers with secondary school graduation almost equals to the fathers with similar educational level, we can assume that the level of education of a „technical school or vocational school without maturity exam” is far below the result we got in the case of fathers.
It is also not surprising that it is very common, that the 2 parents have a very similar educational level, in case of higher education, 75 (71%), in the case of primary education 10 (55%) matches. Parents with maturity exam do not influence the frequency of probability in matches, in this case 50% matches. However, in the case of vocational education, concur- rence is lower than expected, so it can be deducted from the two „extreme” values and from the vocation education results that the correlations can be considered as significant.
Among the responders 140 people (31%) is resident in Eger, 172 people (39%) commutes daily (a relatively high portion), while 109 students (39%) lives in student hostels – almost a quarter of the sample. 13 people live in rented apartments or stay with relatives. 9 people did not give answer to this question.). The ratios we got is acceptable and favourable for later comparisons.
Most part of are sample is from secondary school and secondary grammar school (180 and 173 people) – it is not surprising considering data regarding age. We had 42 people responding from post-secondary vocational education, and 23 people from secondary (technical) education. 17 people attended higher education.
As for the material goods, we had to face the general „secrecy”. We have a high number of students/responders who did not wish to reply this question. According to their own statement 140 people said that in their family the per capita income is above 90 thousand Hungarian Forints. But 27 of them said that their monthly per capita income is below 40 thousand Hungarian Forints.
We also asked the responders to evaluate their subjective wellbeing compared to their environment on a 5 degree scale.
As opposed to the previous question, we only had 9 questions missing. Based on this we got a relatively good result, average of 3.6. The most frequently marked value is above the average of 4 points on the scale.
Spare time
We were in a difficult position when surveying spare time. Since the concept of free time has an extensive background literature, it has many methods for categorisation, it was difficult to show „actual free time” which is free from physiological, social and other constraints. Therefore we decided to supplement questioning with some explanation. In spite of this we received answers which were not possible to evaluate, for example we had unrealistically evaluated free time (for example 22 or 24 hours on a weekend day), so we marked these values as „missing data”.
Based on the results, on an average weekday young people have 3.4 hours free time. At the weekends they have 9.4 hours.
On a weekdays most commonly they have 2 hours free time, while at weekends most people have 10 hours. We noticed that at weekends there are bigger standard deviations.
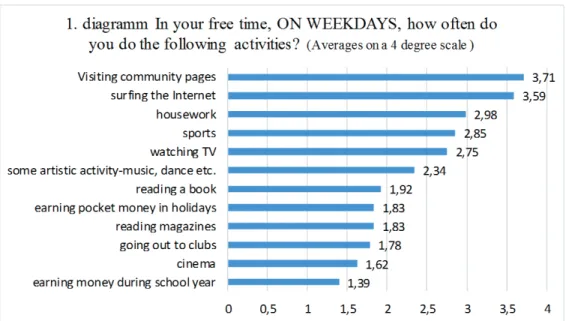
II/22. diagramm: In your free time, ON WEEKDAYS, how often do you do the following activities (Own edition)
When replying questions about spare time, we asked the responders about how often they perform an activity, and they had to mark frequency on a 4 degree scale. The sequence of the averages show the frequency of the activity. It is not surprising that visiting community and social media pages, and „surfing the Net” is on the first place.
Watching TV is only on the 5th place, visiting a cinema is the last but one – according to the tendencies of this age, interactive experience and the on-line world is a more comfortable field for this generation. Doing housework or doing some sports is on the 3rd and 4th places. In the middle of the range we found some creative, artistic activities and reading. The most diversely evaluated activities are artistic activities, earning money, watching TV and reading – meaning that these variables had a considerable higher stan- dard deviation than other activities (above 1 point).
Similarly we mapped weekend activities. At the weekends watching TV moved forward, it changed position with doing sports. Visiting clubs- as expected- moved forward by three positions. Deviations can be detected within the sample in the case of artistic activities, reading and watching. From this we can see that the main difference
between how free time is spent on a weekday or on a weekend is that clubs and pubs are preferred, and watching TV broadens the choice of activities over visiting social media pages and surfing the Net.
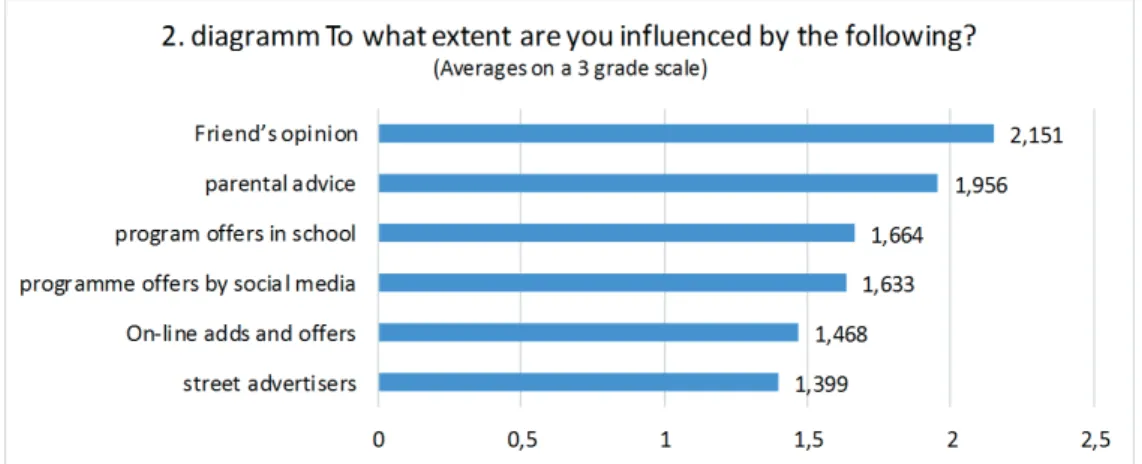
II/23. diagramm: To what extent are you influenced by the following (Own edition) The way free time is spent is highly influenced by peers. Then comes parental advise, then with a bigger difference comes programme offers by school. In spite of the fact that on-line interfaces mean the most important activity, it does not have a significant influencing power. Parental advice had a bigger power at younger age, while this effect is weakens at a later age due to separation from parents. Street advertisers are just passed by social media and other online surfaces.
Vision for the future
Young people perceive the changes of this era very well. They perceive the social changes generated by technological development, the inequality in access to informa- tion and knowledge, their impact on generating social inequality. Of course, they can experience how the loads of information burden people. This instability is reflected by the future career plans. More than one third of our sample forecast more jobs and more changes in career. Only 16% (74 people) thinks that they can manage with only one workplace or job.
If they had the chance, 140 responder would settle down in Eger, and if we add the number of people said that „I definitely want to live in Eger”, then 177 responder would
choose Eger – this is 40% of our sample. 103 people would definitely move away, and 135 people would only move if they had the opportunity – this is 238 people altogether.
Later on we will discuss in detail what kind of features people have who are longing to move away from Eger.
These days young people’s migration from certain regions is often consulted. It is a fact that in hope of a better living many young people leave our region.
Regional data and county data both show very well that after the change of regime our country became a target country, but later on it lost its attractiveness. (Melegh, 2011)
Migration affects younger generations in general, we cannot highlight some trade groups or educational level. Almost three quarter of Hungarian people who move abroad are below 40, and more than the half of them (56%) is between the age of 25 and 35. The cause of migration is the standard wages considerably below the European average, but Hungarian working conditions and the general social uncertainty also play an important role. (Vukovich, 2012) However, we should not forget that during history our country often was an „emissive country”.
It is important to make a difference between permanent and temporary migration.
Namely, if the possibility of returning is open. Migration research should be extended by other factors due to globalization. As a consequence of political and economic changes many people lost their previous existence (e.g. the decay of heavy industry), and with the free flow of goods, services and labour thousands could leave. (Melegh, 2011) We need to differentiate the permanent „migrants”, those cosmopolitan, young professionals who feel at home everywhere, and whose knowledge is valuable all over the world, and those who leave the country due to some political or economic constraints. (Appadurai, 1996) Another important question is that this phenomena mostly affects young people, who most probably return home, so working abroad has become a kind of life cycle phenom- enon. Namely, getting experience in a foreign country and learning languages appears in the individual career.
The above assumptions are confirmed by the answers we got. So the leading reasons for migration are learning languages, earning money and „world vision”.
It is favourable that family reasons are on the last on the list. From these points of view our sample is rather homogenous, we did not find significant deviations.
Involvement in deviations
We asked the responders to mark the frequency of how often they take legal or illegal
„stuff” or do illegal activities.
Based on the averages we can sort which activities are frequent, and how the young people of Eger are impacted.
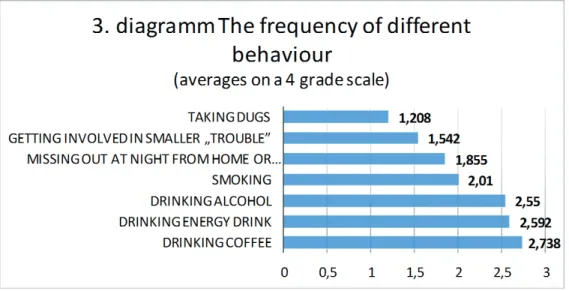
II/24. diagramm: The frequency of different behaviour (Own edition)
Most young people admitted drinking coffee and energy drink. More serious alcohol consumption is in the third position. Taking drugs and „getting into smaller trouble” is of the utmost concern, but they took the last 2 positions. Taking drugs has the smallest standard deviation, therefore it is not just the rarest deviation, but from this point of view it is the most homogenous sample.
It is interesting to look at which behaviours go together. Smoking goes together with all other activities, it also can be interpreted with statistic probability (r ≥0,4).
Drinking coffee with drinking energy drink (r ≥0,3). Drinking energy drink with missing out from home and drinking alcohol (r ≥0,3). Taking drugs with „trouble”
and missing out also goes together (r ≥0,3).
To make it easier to have a general overview of data and later analyzations we applied data reduction (factor analysis) – so statements regarding deviances can be arranged into
two groups. Based on the preliminary study it turned out that our data meets the condi- tions of the procedure. (KMO=0,828).
As a first step, we examined how many groups of behaviour should be created. If we create 3 bigger groups, then the „missing out at night” group was standing alone, with a relatively heavy weight factor. If we stick to the „two group model”, then the „miss- ing out” variable falls within the more serious deviances, with a medium weight factor.
Since the explanatory power of the model is still suitable – we stayed with this solution.
Smoking (0,526) and drinking coffee (0,537) is among „slight deviances”. (In brackets we mark the weight factor of the certain behaviour).
More „severe deviances” are „getting into smaller trouble” (0,695), taking drugs (0,693), missing out (0,464) and drinking alcohol (0,311). Based on the results we gener- ated a new variable, which will have the role to measure the involvement in deviances – the baseline for this is formed by the value measured in certain factors and factor scores.
Based on parents’ qualifications, we summarised the sequence in the chart below. Group 1 is the group with the biggest involvement, then the rest comes in descending order.
Serious deviances Slight deviances
Fathers Mothers Fathers Mothers
I. primary school primary school I don’t know primary school II. I don’t know I don’t know maturity exam vocational training III. diploma diploma vocational training maturity exam IV. maturity exam vocational training primary school diploma
V. vocational training maturity exam I don’t know I don’t know II/14. table (Own edition)
In the case of slight deviances the only significant divergence detected is in the quali- fication of the mothers. With higher educational qualifications involvement is reducing.
In spite of this, correlations can be well detected. This is not surprising in the light of the previous result, that in parents’ qualifications we have found homogeneity, therefore, in the case of parents similar school qualifications have an interpretable probability.
Based on the place of residence we have the following grouped responses (we had 13 people in rented apartments or staying with relatives who were filtered due to low
number of representation).
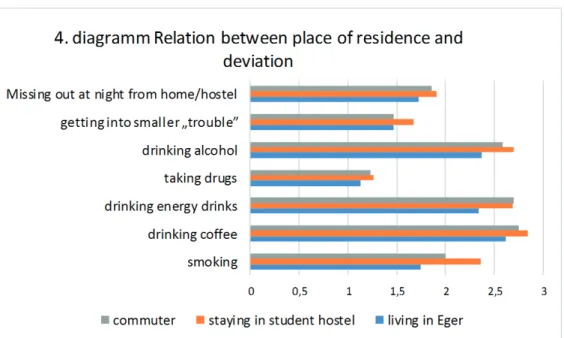
II/25. diagramm: Relation between place of residence and deviation (Own edition) It seems that the lack of parental guidance is reflected in the frequency of some behaviours. Students who live in student hostels are more involved in almost all these activities, the only exception is drinking energy drink. In general we can state that the commuters have the second position, namely in their case the involvement is higher compared to their peers with permanent residence in Eger.
Differences are significant in the case of smoking and drinking energy drinks.
If we examine the differences between severe and slight deviances, it is not surpris- ing that severe deviances show more significant standard deviances in the order above (sig=0,009), so the sequence is students living in hostels, commuters, then students living in Eger. In case of slight deviances we had similar results (sig=0,004).
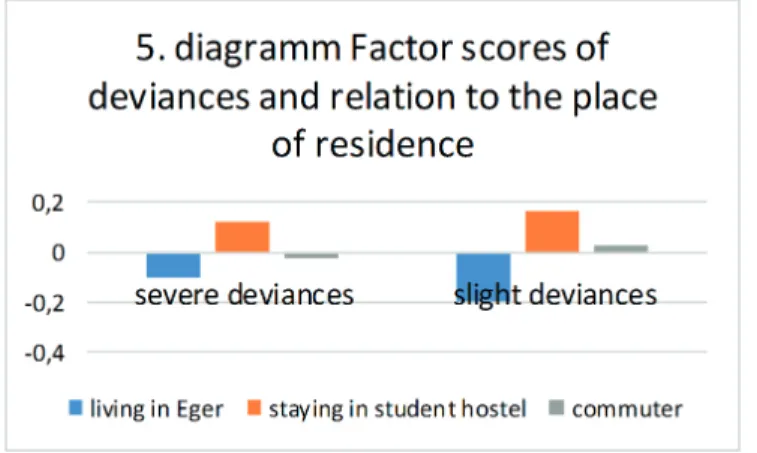
II/26. diagramm: Factor scores of deviances and relation to the place of residence (Own edition)
The expected tendencies are often reflected by the relation between the different educa- tional level and deviant behaviour. As the level of education is in close relation with age, it is not surprising that some behaviour is getting more frequent with the coming of age.
Here we consider drinking coffee, missing out at night, smoking and alcohol consump- tion – where coming to adult age legalizes these activities. Comparing data about age, we found weak correlations both with severe and slight deviations (r= 0,213 and 0,239).
Data from vocational school students show more interesting results – unfortunately, they are more involved than students attending other type of school. These are coffee, energy drink, drugs and „getting into trouble”.
The sequence of involvement is severe and slight deviances can be found in the chart below.
Severe deviances Slight deviances
1. vocational training university, college 2. university, college vocational training
3. post- secondary vocational training post- secondary vocational training 4. secondary (technical) school secondary (technical) school
5. grammar school grammar school
II/15. table
Students attending grammar school or secondary technical school are more
„protected”, the other significant trend is - taking age characteristics in considerations – that students who go to vocational trainings are particularly vulnerable. We got the same tendency when examining educational plans – we did not get any surprising result.
Being content with life highlights an interesting tendency. The more young people are content with their lives, the more extent they are involved in severe deviances, and in the case of slight deviances the „middle range – I am not too happy with my life” is the more affected group, but they are closer to the unsatisfied. We can clearly state that being content with life has a positive relationship with being affected by deviances. This is confirmed by the result that the mostly affected (in the case of both deviance group) responders see the world they live in as totally bad, and they feel it unstable. But those who are less affected see the world as good and they succeed in it.
Social problems and general wellbeing
Young people’s sensitivity can be detected in the field of evaluating social problems. On the top of the list we can often find material challenges, homelessness, unemployment, poverty – all got higher scores. But in the first two positions there is crime and domestic violence, and the question of immigration is also there in the leading group. Compared to the results the effect of excessive sensitivity triggered by the media emerges. We can also conclude this from the fact that racism and discrimination are on the second position in line. The differ- ent addictions – gambling, alcoholism, drug addiction – are in the less dangerous group.
Responders were more careful when evaluating problems appearing in their close environment Interestingly, we experience with many problems that - compared to the evaluation of the problems of the vast society – these problems are more serious when evaluating their own situation. Loneliness is one of these, which is in the first place, or alcoholism, gambling, discrimination. Crime got to the end of the list, and domestic violence also lost its leading position. If we want to define the types of problems, then we have a more difficult job. Results showing deviances or material problems do not settle close to each other.
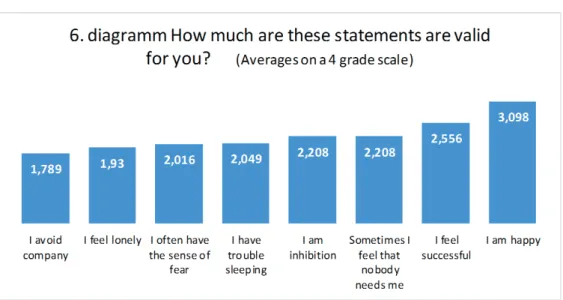
The result of young people’s mental state does not paint a dark picture. They feel happy and successful. But it is thought provoking that exclusion (nobody needs me) and being inhibited is following the positive feelings. It also makes us cautious that as opposed to previ- ous questions, where „external conditions” had to be evaluated, there were more standard deviations within certain variables. (At previous questions we usually got standard devia- tions below 0.5, at this question we often got a value above 1, on a 4 grade scale). „Nobody needs me”, „I am inhibited”, „I have trouble sleeping” typically produced these results.
II/27. diagramm: How much are these statements are valid for you? (Own edition)
Summary
Our results confirm the characteristics of this age, the answers we got to our questions confirm other city’s surveys, and even the results of countrywide youth researches. The routines of spending free time clearly reflects the digital challenges of our age, the leading role of community pages – may we consider weekdays or weekends. Working abroad or the plans of studying abroad has become an integral part of young people’s future plans.
It can be defined as a kind of lifecycle phenomena, in which the most crucial question is not leaving the country anymore, but the plan to return.
From the data we can deduct that being unhappy with life goes together with risk behaviour: such as smoking, drinking alcohol, taking drugs. Young people staying away from behaviour harmful for health evaluate their lives as more happy compared to consumers. If adolescent people are unhappy with more factors of their lives, it indisposes their adaptability, and it increases the probability of the appearance of a symp- tom. Those young people are more content with their lifestyle who are future oriented.
Besides all these factors it is rather promising that the generation under examination is very sensitive about the narrower and broader social problems.
Appadurai, A. (1996). Modernity at Large. Minneapolis: University of Minnesota Press.
Falus I. (1996). Bevezetés a pedagógiai kutatás módszereibe. Budapest: Műszaki Könyvkiadó.
Héra G., Ligeti Gy. (2005). Módszertan. Budapest: Osiris.
Melegh A. (2011). A globalizáció és migráció Magyarországon. Educatio, 2, 166-180.
Központi Statisztikai Hivatal, (2012). Magyarország 2011, Budapest: Vukovich G. fel. kiadó.