Applied Surface Science 551 (2021) 149436
Available online 27 February 2021
0169-4332/© 2021 The Authors. Published by Elsevier B.V. This is an open access article under the CC BY-NC-ND license
(http://creativecommons.org/licenses/by-nc-nd/4.0/).
Full Length Article
Mechanism of corrosion inhibition of intermetallic Al 2 Cu in acidic solution
Przemys ł aw Kwolek
a,*, Marek Wojnicki
b, Edit Csap ´ o
c,daRzeszow University of Technology, Department of Materials Science, Rzeszow, Poland
bAGH University of Science and Technology, Faculty of Non-Ferrous Metals, Krakow, Poland
cMTA-SZTE Biomimetic Systems Research Group, University of Szeged, H-6720 D´om t´er 8, Szeged, Hungary
dUniversity of Szeged, Department of Physical Chemistry and Materials Science, H-6720, Rerrich B. t´er 1, Szeged, Hungary
A R T I C L E I N F O Keywords:
Aluminium alloy Intermetallics Corrosion
Heteropolyoxomolybdate Phosphomolybdenum blue Orthophosphoric acid
A B S T R A C T
The objective of this work was to study the kinetics of phosphomolybdenum blue formation onto the surface of intermetallic Al2Cu in orthophosphoric acid solution. This was performed using UV–Vis spectroscopy, scanning electron microscopy, X-ray photoelectron spectroscopy, and electrochemical methods. The latter included measurement of open circuit potential, cyclic voltammograms, polarisation, and chronoamperometric curves as well as impedance spectra. It was shown that a stable form of phosphomolybdenum blue is formed via decomposition of an intermediate in the solution. However, neither phosphomolybdenum blue nor hetero- polyoxomolybdate species behave as a corrosion inhibitor. A protective layer of molybdenum oxides formed immediately upon immersion of intermetallic in the corrosive environment, is responsible for corrosion inhibition.
1. Introduction
Copper is an important alloying element in aluminium wrought and cast alloys. It constitutes numerous intermetallics with aluminium and other alloying elements/impurities, for instance, Al2Cu, Al2CuMg, Al6(Cu,Fe), Al6(Cu,Fe,Mn), Al15Si2(Cu,Fe,Mn)3, Al6(Cu,Fe,Ni). Espe- cially the first two of them, when precipitated from a supersaturated solid solution during heat treatment, ensure good strength of the alloys, but also deteriorate their corrosion resistance [1]. The latter occurs due to a strong galvanic coupling between the intermetallics and the matrix [2,3]. Al2CuMg is less noble than the matrix and preferentially corrodes.
Al and Mg are initially dissolved whereas Cu remains on the surface and accelerates further corrosion of adjacent matrix grains [4–6]. Al2Cu, in turn, is nobler than the matrix and constitutes local cathodes within the corrosion cell. This influences corrosion behaviour of wrought aluminium alloys with low Mg content [7,8] as well as cast alloys, where Al2CuMg is not formed [9–12].
Aluminium alloys are not corrosion resistant in most of the acidic environments and thus are not intentionally applied there. Certain in- dustrial processes, however, require corrosion resistance of aluminium alloys in acidic solutions. These include various pretreatment methods used in aluminium finishing industry and stripping of anodic coatings for gravimetric determination of their weight. The latter is routinely
performed for hard anodic coatings in hot orthophosphoric acid solution containing chromium trioxide as a corrosion inhibitor for the metallic substrate [13]. Unfortunately Cr(VI) species are highly toxic [14] and more environmentally-friendly corrosion inhibitors should be developed.
Promising results were obtained when Na2MoO4 was applied as the corrosion inhibitor of 1050 alloy in orthophosphoric acid solution [15].
Subsequently it was demonstrated that anodic coatings can be success- fully stripped from Al 1050 substrate using Na2MoO4 instead of CrO3
[16]. Corrosion of 2024 [17], 2017 [7] and 7075 [18] alloys was also inhibited, but inhibition efficiency was not always satisfactory. The mechanism of corrosion inhibition is complex because of the complexity of (i) the Na2MoO4 – H3PO4 system and (ii) phase composition of aluminium alloys.
Orthomolybdate ions, MoO42−, in acidic solutions transform to iso- polyoxomolybtate species such as dimolybdate [Mo2O7]2−, trimo- lybdate [Mo3O10]2−, tetramolybdate [Mo4O13]2−, heptamolybdate [Mo7O24]6−, octamolybdate [Mo8O26]4−, and decamolybdate [Mo10O34]8−. The stoichiometry of isopolyoxomolybdates depends on the pH and concentration of orthomolybdate. If an acidic solution con- tains so-called addenda atoms, e.g. P, As or Si, heteropolyoxomolybdates are formed, with [PMo12O40]3− as the most well-known example [19].
This can be reduced to phosphomolybdenum blue (PMB) [PMo12O40]7−
* Corresponding author.
E-mail address: pkwolek@prz.edu.pl (P. Kwolek).
Contents lists available at ScienceDirect
Applied Surface Science
journal homepage: www.elsevier.com/locate/apsusc
https://doi.org/10.1016/j.apsusc.2021.149436
Received 25 January 2021; Received in revised form 23 February 2021; Accepted 26 February 2021
[20] which indeed occurs in the corrosion cell [15,21]. Thus, it is not always clear which species are responsible for corrosion inhibition.
Other iso- and heteropolyoxometalates such as vanadates and tungstates either did not inhibit corrosion in strongly acidic solutions at all or only to the moderate level [15,22–24].
Phase composition of aluminium alloys consists of numerous inter- metallic particles located both in the interdendritic regions and within the matrix grains. Thus, it is important to understand their interactions with the acidic environment. This can be studied for the alloy as a whole and individual intermetallics. The latter approach was adopted in this work, which is focused on intermetallic Al2Cu. Because it is more noble than the matrix and other intermetallics, cathodic processes such as hydrogen and oxygen depolarisation as well as those involving hetero- polyoxomolybdate species occur there. The latter, including the mech- anism of PMB formation was studied for the first time. It was interesting to check whether the cathodic process in the corrosion cell can be inhibited. If this occurs together with inhibition of matrix dissolution, higher than already reported values of inhibition efficiency of Cu-rich aluminium alloys can be achieved.
2. Experimental
Stoichiometric amounts of Al and Cu (99.999 wt% purity, Alfa Aesar) were melted in an electric arc furnace under Ar atmosphere. Then the ingot, ca. 4.5 g, was annealed at 823 K for 30 h and cooled in air. The intermetallic Al2Cu was obtained. Its phase composition was confirmed using X-ray diffraction method, light microscopy, and differential scanning calorimetry. This was described in our previous work [25].
The annealed ingot was cut with an electrical discharge machine.
Then aluminium alloy wire, insulated from the solution using a heat shrink tube, was attached. This served as the electrical connection for electrochemical tests. Subsequently, the specimen and the electrical connection were mounted in an epoxy resin. The surface area of the electrode was 0.7 cm2. It was ground with SiC abrasive paper (320 and 500 grit), rinsed with deionised water, isopropyl alcohol, and air-dried prior to every experiment.
SP-300 potentiostat (Bio-Logic SAS, Seyssinet-Pariset, France) was used for electrochemical tests. Experiments were conducted in the three- electrode cell with a water jacket, placed in the Faraday cage. Counter electrode, 20 cm2, was made of platinum. Ag|AgCl (3 M KCl) reference electrode (REF) was placed in a Luggin probe filled with 0.25 M H3PO4
solution. The tip of the probe was very short to ensure low impedance of the reference electrode, 600 Ω. All potential values in the text are re- ported vs. Ag|AgCl (3 M KCl) reference electrode. The volume of the solutions was 100 cm3. The concentration of orthophosphoric acid, cacid, was 0.25 M, the concentration of sodium molybdate, cMo, was 0 and 10 mM. All electrochemical tests were performed at T =303 K; solutions were deaerated using Ar. The electrochemical characterisation of the studied system involved the determination of the open circuit potential (OCP), chronoamperometric curves, cyclic voltammograms (CVs), polarisation curves and the impedance spectra. Cyclic voltammograms were recorded onto a glassy carbon electrode, S =0.071 cm2, with the potential scanning rate 5 mV⋅s−1 and 50 mV⋅s−1. Anodic and cathodic polarisation curves were measured independently, starting from the OCP, with the potential scanning rate 0.33 mV⋅s−1. Electrode potential values were corrected with the i∙Rs drop in the electrolyte, where Rs is the solution resistance and was determined from the impedance spectra.
Impedance spectra were recorded in the frequency domain between 200 kHz and 10 mHz with a sinusoidal perturbation of potential equal to 7 mV of a root mean square. All the spectra were measured twice and compared to ensure that the system was sufficiently stable. Then, they were fitted with the appropriate electrical equivalent circuit in Zview software (Scribner Associates, Southern Pines, US, version 3.5d). The circuits were composed of solution resistance Rs, constant phase element CPE related to a double layer capacitance Cdl or a passive layer capac- itance Cpas and a Faradaic impedance containing, among others, a
charge transfer resistance Rct. CPE is commonly used in equivalent cir- cuits instead of the capacitor because time constants of the Faradaic processes are distributed over the electrode. The impedance of CPE is given by Eq. (1) [26]:
ZCPE= 1
Tdl(jω)α (1)
where Tdl is a parameter equal to the capacitance when α =1, ω is the angular frequency, j is the imaginary number and α indicates deviation from the capacitive behaviour. Double layer, as well as the passive layer capacitance, can be obtained from Eq. (2) provided that the time con- stants’ distribution occurs along the electrode’s surface [26]:
Cdl=Tdl1α (1
Rs
+ 1 Rct
)1−1
α (2)
A weighted sum of squares of differences between the measured and calculated impedances σ indicated the quality of the fit.
UV–Vis absorption spectra of the solutions were measured between 400 and 1000 nm using Cary 60 spectrophotometer (Agilent Technol- ogies Inc., Santa Clara, US). A quartz fibre optic immersion probe with 10 mm optical path length was applied. The absorption spectra were recorded as a function of Al2Cu immersion time, cMo, and temperature;
the reference was 0.25 M H3PO4 solution. The volume of the solutions was 100 cm3; they were agitated using a magnetic stirrer, 390 rpm, and deoxidised with Ar. The geometry of the cell was the same as that of the one used for electrochemical experiments. Absorption spectra with the highest intensity were approximated with the sum of two Gaussian peaks to obtain positions of their maxima, using Origin Pro software (Origin Lab Co., Northampton, US, version 2016).
The surface of the specimens was studied using a scanning electron microscope (SEM) and an X-ray photoelectron spectrometer (XPS). The former was HITACHI S-3400 N equipped with an energy-dispersive X- ray spectrometer (EDS) Thermo Noran System 7 (Hitachi High Tech Global, Tokyo, Japan). The latter was PHI 5000 Versa Probe II (ULVAC- PHI, Chigasaki, Japan) with 25 W Al Kα radiation source. The X-ray beam diameter was 100 μm; the operating pressure in the chamber was
<5⋅10−7Pa. The analyser pass energy was 46.95 eV; the charging effect was compensated using a dual-beam charge neutraliser. Three areas, 300 ×300 μm, were analysed on each specimen. After analysis, these areas were sputtered using Ar gas cluster ion beam, with the energy 10 keV and current 30 nA for t = 5 min, and the spectra were again recorded. The specimens were rotated during analysis. All XPS peaks were referenced to carbon C 1s peak with the binding energy of 284.8 eV. Spectrum background was subtracted using the Shirley method. PHI MultiPakTM data analysis software was used to calculate elemental compositions from the peak areas.
3. Results and discussion
3.1. Kinetics of phosphomolybdenum blue formation
Sodium molybdate, when is dissolved in orthophosphoric acid so- lution forms heteropolyoxomolybdate species, with stoichiometry depending on reagents’ concentrations and pH. These species strongly absorb light at λ <400 nm. Molybdenum ions can be partially reduced from hexavalent to pentavalent and PMB species are formed. This occurs in three consecutive steps. The first one, two-electron step, produces PMB(2e−) species with the absorption bands centred around 700 and
>1000 nm. The other one, two-electron step, produces PMB(4e−) spe- cies with two bands; their maxima are between 600–700 nm and 700–800 nm. These bands are related to Mo(V) – Mo(VI) intervalent charge transfer. The first one has an absorption coefficient equal to 10 000 dm3∙mol−1∙cm−1, the other one 26 000 dm3∙mol−1∙cm−1. The positions and intensities of these bands depend on the chemical composition of the solution. At the same time, PMB(2e−) decomposes to
12-molybdophosphoric acid and PMB(4e−). Thus, the former is observed only in non-aqueous environments or when the reduction in aqueous solutions is sufficiently slow. The last one, two-electron step, gives PMB(6e−) which is also unstable [20].
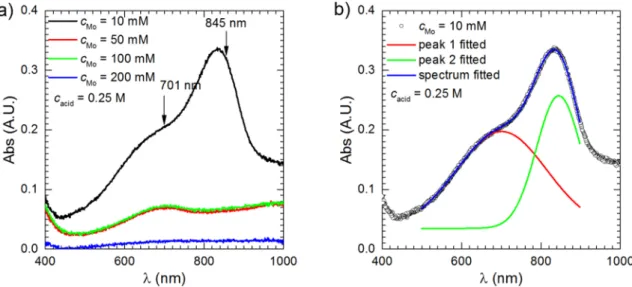
UV–vis spectra were recorded as a function of Al2Cu immersion time, cMo, and temperature. The spectra with the highest intensities of the absorption bands were approximated with the sum of two Gaussian peaks in the wavelength range 500 and 900 nm and positions of their maxima were obtained (Fig. 1a and b). It is evident that absorbance decreases as cMo increases. What is more, the shape of absorption spectra also changes with time. When cMo =50 and 100 mM, after t =176 min, only one absorption band centred around 700 nm is clearly visible.
Another one is centred in the infrared range of the spectrum. This sug- gests that PMB(2e−) species were mainly formed. Assuming the ab- sorption coefficient equal to 7000 dm3∙mol−1∙cm−1 [20], one can estimate their concentration as equal to 0.01 mM. Another interesting fact is that virtually the same spectra were obtained when cinh =50 and 100 mM. When cMo =200 mM, no absorption band can be distinguished.
Because PMB species are formed at the cathodic sites within the corro- sion cell these results suggest that cathodic, anodic, or both processes are inhibited with heteropolyoxomolybdate species. The decrease of the absorbance with increasing cMo has already been observed for 1050 and 7075 aluminium alloys and was attributed to inhibition of the anodic reaction in the corrosion cell [18,21]. However, the mechanism responsible for this effect in the case of intermetallic Al2Cu is different. It was studied with electrochemical methods and will be discussed further in the text.
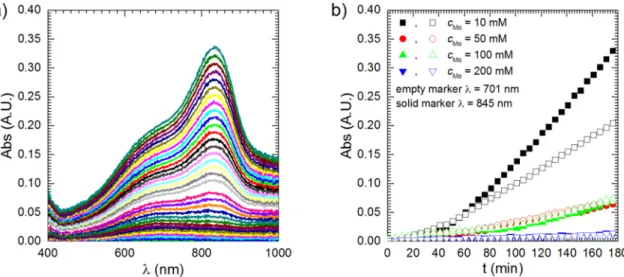
Kinetic studies of PMB formation were conducted in the solution containing cMo =10 mM because its absorbance between λ =400 and 1000 nm was the highest among the studied ones. It can be observed that absorption spectra change their shape as the immersion time increases (Fig. 2a). The absorbance at λ =701 nm is initially higher than at λ = 845 nm but after t =56 min this changes and the latter absorption band dominates the spectrum in the studied wavelength range (Fig. 2b). This is because the kinetics of reduction of heteropolyoxomolybdate species is rather sluggish and PMB(2e−) species temporarily appear in the so- lution. Because their absorption coefficient is lower when compared to the absorption coefficients of PMB(4e−) they are clearly visible only at the initial stage of the experiment.
Formation of PMB(2e−) species was further confirmed, when the Al2Cu specimen was removed from the solution and the reaction vessel became open to the air. Because oxygen oxidises PMB species [20]
absorbance at λ =701 and 845 nm decreases as time increases. The
initial increase at λ =845 nm, which is not observed at λ =701 nm, proves that PMB(4e−) species are formed due to decomposition of PMB (2e−) (Fig. 3).
The rate of PMB oxidation was rather moderate. The influence of oxygen on the kinetics of PMB formation is clearly visible when the temperature is sufficiently high. The influence of temperature on the absorbance of the solutions is presented in the Arrhenius-type plot (Fig. 4). The linear dependency of natural logarithm of absorbance on T−1 was only obtained in deaerated solutions. This is because PMB oxidation rate is rather insignificant when T ≤308 K and quite high at T
=313 K. Similar values of slopes obtained after linear fitting confirms that the influence of PMB(2e−) formation can be neglected when the concentration of PMB(4e−) is sufficiently high. Activation energy could not be obtained from this data, because the rate constant of the reaction remains unknown. What is more, the concentration of PMB species, which is proportional to absorbance, depends on the kinetics of both cathodic and anodic reactions in the corrosion cell. Thus, the activation energy would not have any physical meaning.
Stirring is another parameter that might affect the studied system.
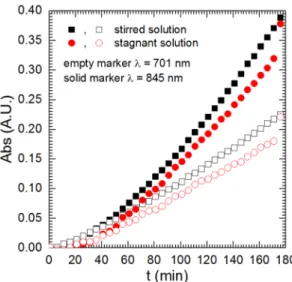
On one hand, it decreases the concentration of PMB(2e−) at the in- termetallic’s surface which makes its further reduction to PMB(4e−) more difficult there. On the other hand, the latter is also formed in the bulk of the solution because of PMB(2e−) decomposition. The kinetics of PMB formation was compared in stirred and stagnant solutions (Fig. 5).
Lower absorbance values both at λ =701 and 845 nm at stagnant, when compared to the stirred solution are related to low diffusivity of PMB.
Stirring does not have any significant influence on the kinetics of PMB formation. This was confirmed when the stagnant solution was stirred at t =176 min and the absorbance increased rapidly to the value obtained in solution stirred continuously. Consequently, it further confirms that PMB(2e−) decomposition is the main mechanism responsible for PMB (4e−) formation and the reaction rate is not faster than the diffusion rate of PMB(2e−).
Because intermetallic Al2Cu in aluminium alloys is nobler than the matrix, the formation of PMB species occurs there during corrosion. The kinetics of this process was studied for Al2Cu specimen electrically connected with aluminium. The surface area ratio was ca. 1:1. Inter- estingly, absorbance at λ = 701 and 845 nm decreased significantly when compared to the results obtained for the intermetallic alone (Fig. 6). This is because electrical contact decreases the open circuit potential in the corrosion cell. Why this also decreases the rate of PMB formation is explained further in the text.
Fig. 1. UV–Vis absorption spectra of H3PO4 – Na2MoO4 aqueous solutions at different cMo (a) and the deconvolution of the spectrum using 10 mM of cMo in equilibrium with air (b), T =303 K, t =176 min, stirring with 390 rpm.
3.2. Mechanism of corrosion inhibition 3.2.1. Open circuit potential
Electrochemistry of Al2Cu-H3PO4-Na2MoO4 system is rather com- plex. Firstly, because numerous electrochemical and chemical reactions occur. Secondly, the intermetallic suffers from selective corrosion and its surface area increases with time [27]. Therefore, the experiments were performed at cacid =0.25 M, pH =1.2, which was not very aggressive.
What is more, it offered a relatively wide potential window, where there was no hydrogen evolution on the electrode. Most of the experiments were conducted in deaerated solutions and the reduction of hetero- polyoxomolybdate species was the only possible cathodic reaction. This of course further decreased the corrosion rate of the intermetallic.
The open circuit potential (OCP) was studied as a function of time in deaerated, stagnant, and stirred solution (Fig. 7a). The stirring rate 290 rpm corresponds to 390 rpm applied during UV–Vis studies because a longer stir bar was applied. When the electrode was immersed in the electrolyte containing cMo = 10 mM OCP rapidly increased from the negative values towards 0 V vs. REF. When cMo =0 mM, much lower values around − 480 mV were achieved. Interestingly, OCP started to oscillate in stirred solution, when cMo =10 mM, but not when cMo =100 mM. The oscillation consisted of alternate drastic, ca. 290 mV per 3–4 s,
and gradual changes of OCP (Fig. 7b) and disappeared spontaneously.
The latter can also be forced by switching off the magnetic stirrer. Thus, an appropriate initial concentration of sodium molybdate and stirring are necessary to observe the oscillation. This could be related to alter- nating cycles of formation and dissolution of a protective layer on the electrode.
3.2.2. DC electrochemical methods
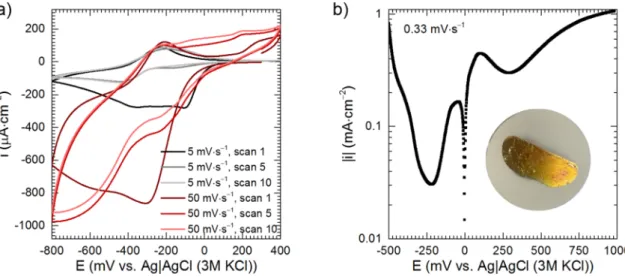
The protective layer must be formed at the low potential, right after immersion of the intermetallic to the solution. Analysis of the shape of cyclic voltammograms and the polarisation curves confirms this assumption. Cyclic voltammograms were recorded on the glassy carbon working electrode (Fig. 8a). Cathodic current density during the first scan was much higher when compared to the subsequent scans, regardless of the scanning rate, because of the formation of the protec- tive layer. It was probably composed of molybdenum oxides/hydrox- ides, where Mo is present at V and VI oxidation state [28]. Molybdenum oxides, where the metal is present at III and IV oxidation state are also formed in acidic solutions during cathodic polarisation of metallic mo- lybdenum and are responsible for its passivity [29]. The aforementioned Fig. 2. Kinetics of formation of phosphomolybdenum species: (a) absorption spectra; (b) kinetic curves; solutions in equilibrium with air, T =303 K, stirring with 390 rpm.
Fig. 3. Kinetics of oxidation of PMB species with O2, cacid =0.25 M, cMo =10
mM, T =303 K, stirring with 390 rpm. Fig. 4. Kinetics of formation of PMB species in solutions in equilibrium with air and deaerated with Ar as a function of temperature, cacid =0.25 M, cMo =10 mM, t =176 min, stirring with 390 rpm.
oxide layer was rather thin. When the electrode was rinsed with water and again polarised in orthophosphoric acid solution, cacid =0.25 M, without molybdenum species, there were no reduction and oxidation peaks visible (data not shown). The oxidation peak, centred between
− 200 and − 250 mV vs. REF, obtained during the reverse scan, is probably related to oxidation of MoV within the oxide layer [28]. That is, because the peak intensity does not change neither during subsequent scans, nor upon change of the scanning rate. When the scanning rate was increased from 5 to 50 mV∙s−1 additional reduction and oxidation peaks appeared. They are related with reduction/oxidation of intermediates, formed during electrochemical processes. When the scanning rate was low, 5 mV∙s−1, they diffused from the electrode to the bulk of the electrolyte and corresponding peaks were not observed. It should also be noted here that the Mo-containing layer, formed during cathodic scan, was not completely oxidised during anodic scan. This changed when the anodic vertex potential was increased to 800 mV vs. REF (data not shown). Then, the difference in the intensity of the first and subsequent cathodic peaks decreased significantly.
Current density, during cathodic polarisation, Fig. 8b, initially increased and PMB species were formed but then it rapidly decreased
and achieved a local minimum around − 250 mV vs. REF. This is related to the formation of the protective layer probably composed of molyb- denum oxides. Formation of molybdenum oxide bronzes is possible at lower potentials [28,29]. Hydrogen evolution starts when E <− 450 mV vs. REF which is lower than the theoretical value − 290 mV obtained from the Nernst equation. Hydrogen adsorption and diffusion within the oxide layer can also occur [29]. When the polarisation was finished, the surface of the electrode was covered with a goldish layer of molybdenum oxides (Fig. 8b). The anodic peak, centred around 100 mV vs. REF is related to oxidation of Mo in the oxide layer [28,29], oxidation of PMB species also cannot be excluded (Fig. 8b). When the anodic polarisation curve was finished, the surface of the electrode was shiny, with no signs of corrosion. However, when cMo =0 mM, it was covered with Cu due to selective dissolution of aluminium (data not shown).
Formation of the protective layer was studied at the constant po- tential E = − 200 mV vs. REF (Fig. 9a). Current density rapidly decreased at the very first minute of the experiment and the current density became cathodic. The maximal cathodic current density was achieved after ca. 3 min and then it gradually decreased towards 0 µA∙cm−2. This means that the reduction process was hampered due to the formation of the protective layer. The PMB species were not formed. What is more, the cathodic-to-anodic transition occurred. It started at t =35 min and finished 10 min later. When t >45 min only anodic current density was observed, but its value was very low. When cMo =0 mM, the protective layer was not formed and only the anodic current density was recorded (see inset in Fig. 9a) because − 200 mV vs. REF is far more positive than the OCP (Fig. 7a). After initial drop (not visible), current density grad- ually increased with time, current spikes were also observed. They indicate corrosion of the intermetallic. The corrosion had a selective character i.e. aluminium was dissolved and the surface became enriched with copper. This, in turn, accelerated the corrosion of adjacent areas of Al2Cu. After t =24 min current density increased rapidly to ca. 15 mA∙cm−2 and finally stabilised. The surface was covered with a porous copper layer and further selective dissolution of aluminium occurred.
The final proof of the formation of the protective layer was obtained when cMo =10 mM and the potential was set at 0 mV vs. REF. There was no cathodic current and only the anodic one, increasing with time, was recorded (Fig. 9b). Thus, the protective layer was not formed. This also means that neither heteropolyoxomolybdate, nor phosphomolybdenum blue species inhibit the corrosion of Al2Cu.
3.2.3. Surface analysis
The protective layer formed at − 200 mV vs. REF, when cMo =10 mM, was not detected on the surface during SEM examination, probably because of its low thickness. XPS analysis, however, confirmed its ex- istence (Table 1). It is probably composed of molybdenum oxides [28,29] and aluminium oxide. The latter, although unstable in acids can be stabilised against dissolution with heteropolyoxomolybdates (vide infra). Phosphorus is rather included within the layer than adsorbed onto the surface, because its content increased after sputtering together with other elements. Cu(II) may be in the form of insoluble salts such as CuMoO4 and Cu3(PO4)2 because CuO is not formed in acidic solutions.
Its concentration, however decreased after sputtering suggesting that copper ions may be adsorbed on the surface. Interestingly, the content of metallic copper increased after sputtering. Because no metallic aluminium was detected, this suggests that there is a Cu-rich interlayer between Al2Cu and the oxide layer. It was probably formed due to se- lective corrosion of the intermetallic.
The most important result of XPS analysis is that molybdenum exists at various oxidation states within the layer. This confirms that the layer is formed due to reduction of heteropolyoxomolybdates. The Mo 3d5/2 lines with binding energy BE =230.5 eV and spin orbit splitting value DS =3.13 eV; BE =231.9 eV with DS =3.19 eV and BE =232.9 eV with DS =3.14 eV were ascribed to Mo(IV), Mo(V) and Mo(VI) respectively [30] (Fig. 10). At the surface, Mo(VI) dominates over Mo(V) possibly because molybdenum was oxidised in air. The specimen was not Fig. 5. Kinetics of formation of PMB species in stirred, 390 rpm, and stagnant
solutions deaerated with Ar, cacid =0.25 M, cMo =10 mM.
Fig. 6.The influence of electrical contact of Al2Cu with Al on the kinetics of formation of PMB species, solutions in equilibrium with air, T =303 K, stirring with 390 rpm.
Fig. 7.OCP of intermetallic Al2Cu: (a) as a function of time, stirring and cMo; (b) magnified part obtained for cMo =10 mM, stirred with 290 rpm; all solutions were deaerated with Ar, T =303 K.
Fig. 8. Cyclic voltammograms obtained at the glassy carbon electrode (a) and polarisation curves obtained for intermetallic Al2Cu (b) in stagnant solutions deaerated with Ar, cacid =0.25 M, cMo =10 mM, T =303 K.
Fig. 9. Chronoamperometric curves obtained for intermetallic Al2Cu, in solutions deaerated with Ar, stirred with 290 rpm, cacid =0.25 M, T =303 K: (a) cMo =0 and 10 mM, E = − 200 mV vs. REF; (b) cMo =10 mM, E =0 mV vs. REF.
Table 1
Chemical composition of the surface of intermetallic Al2Cu after t =60 min exposition at E = −200 mV vs. REF in solution containing cacid =0.25 M, cMo =10 mM, deaerated with Ar, stirred with 290 rpm, T =303 K.
Conditions Average concentration, at.%
C 1s O 1s Al(III) 2p P(V) 2p Cu(0) 2p Cu(II) 2p Mo(IV) 3d Mo(V) 3d Mo(VI) 3d
Prior sputtering 38.7 39.5 10.2 4.6 0.9 1.6 0.0 0.9 3.6
After sputtering 13.3 50.7 23.1 5.1 3.1 0.3 0.3 1.5 2.6
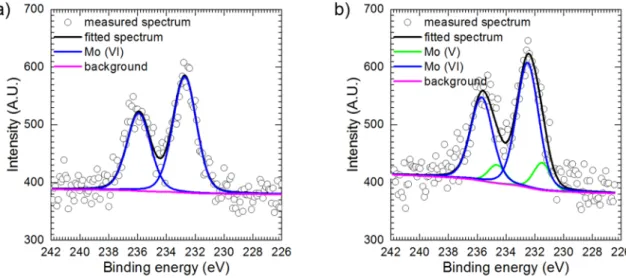
Fig. 10. Mo 3d5/2 photoelectron spectra of the surface of intermetallic Al2Cu after t =60 min exposition at E = − 200 mV vs. REF in solution containing cacid =0.25 M, cMo =10 mM, deaerated with Ar, stirred with 290 rpm, T =303 K: (a) prior sputtering with Ar clusters, (b) after sputtering.
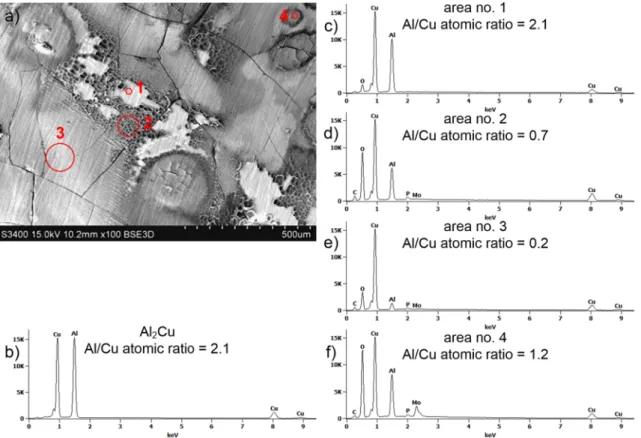
Fig. 11. Microscopic examination of the surface of intermetallic Al2Cu after t =120 min exposition at E =0 mV vs. REF in solution containing cacid =0.25 M, cMo = 10 mM, deaerated with Ar, stirred with 290 rpm, T =303 K: (a) SEM micrograph; (b) the results of the EDS analysis of the specimen prior corrosion; (c)–(f) the results of the EDS analysis in the selected areas after corrosion experiment.
protected against oxidation in the period of time between electro- chemical experiment and XPS analysis. After sputtering the Mo(V) content increased and a small amount of Mo(IV) appeared.
SEM and EDS analysis indicated that the surface of the intermetallic Al2Cu after exposition in the solution, at E = 0 mV vs. REF became locally corroded, enriched with copper and covered with an oxide layer (Fig. 11a). Al/Cu atomic ratio indicates whether the intermetallic corroded or not. The stoichiometric value is 2, in this work 2.1 was obtained for the grinded specimen, prior exposition to the electrolyte (Fig. 11b). The same value was obtained for area no. 1 which did not corrode (Fig. 11c). It is known that standardless analysis of Cu with EDS can lead to errors [31] and this explains the small deviation from the stoichiometry. Area no. 2, in Fig. 11d, is significantly enriched with Cu and numerous corrosion pits are visible. Interestingly, also the concen- tration of oxygen is significant. Unfortunately, EDS cannot be used for quantitative determination of oxygen unless the stoichiometry of the oxide is known. The Cu content is even higher in area no. 3 (Fig. 11e).
Increased Mo content was detected in area no. 4 (Fig. 11f), together with oxygen. Phosphorus is present on the surface probably due to adsorption of H3PO4, because P/Mo atomic ratio is different in the studied areas.
XPS analysis of the intermetallic’s surface after exposition in the solution, at E =0 mV vs. REF confirmed its enrichment with copper (Table 2). Prior sputtering both metallic and ionic form were present.
This was related to the corrosion process. The Cu(0)/Cu(II) ratio was 1.1. After sputtering, Cu(0)/Cu(II) ratio increased to 3.8 and weak signal from Al(0) appeared. This means that layer of corrosion products on the surface was almost completely removed with Ar clusters and the signal coming from the intermetallic was detected. This was not observed when the specimen was polarised at E = − 200 mV vs. REF. Because the sputtering conditions were the same it can be concluded that the pro- tective layer composed of molybdenum oxides was thicker.
Molybdenum prior sputtering was exclusively on its highest oxida- tion state. After sputtering a small amount of Mo(V) was also detected (Fig. 12). The intensities of Mo 3d5/2 lines in both cases were c.a. 5 times lower when compared to the specimen polarised at E = −200 mV vs.
REF, with the same analysed area. This again stresses the crucial role of molybdenum species in formation of the protective coating.
Aforementioned results explain the phenomenon of corrosion inhi- bition of the intermetallic Al2Cu and oscillation of the open circuit po- tential. The protective layer, once formed, caused the increase of the OCP to ca. 0 mV vs. REF. Then, Mo at low oxidation state, V, or IV was oxidised. This probably enhanced its chemical dissolution [29], espe- cially when the solution was stirred. When the intermetallic’s surface was exposed to the electrolyte, OCP decreased to the value, where the protective layer was reconstructed and so on. When the solution was stagnant, the OCP remained unchanged. These suggest that the oscilla- tion should be also observed at different concentrations cMo, cacid and temperature. Stirring, itself should not be the critical factor inducing the oscillation, provided that the protective layer can be formed and dis- solved sufficiently fast. Another issue is why the oscillation declines spontaneously. This could be related to the local enrichment of the surface with copper which enhances Al dissolution. Because the solu- tions were deaerated, the corrosion rate of Al2Cu was very small. Thus, possible depolarisation processes were PMB(2e−) formation at E ≈0 V vs. REF and heteropolyoxomolybdate reduction around − 200 mV vs.
REF. Slight Al dissolution can be related to these cathodic processes as it was indicated with XPS. This suggests that OCP oscillations could last
relatively long. Here however another factor should be considered. The surface of Al2Cu electrode was inhomogeneous, because of numerous cracks. This probably explains why the oscillations can be prematurely extinguished. Destabilisation of the protective layer is not studied in detail in this work. The influence of the chemical composition of the solutions, stirring, and temperature on the OCP’s oscillation will be the topic of the subsequent article.
It should also be noted that PMB(2e−) species are formed around E ≈ 0 V vs. REF, but not when the potential is low. This occurs at the surface of intermetallics that is not covered with the oxide layer. Alternatively, this may be also possible on the surface of the protective layer provided that it is electrically conductive, which is possible for the mixed-valence molybdenum oxides, especially when they are intercalated with a cation [29]. The first possibility, however, is more tempting, because it also suggests the destabilisation of the protective layer necessary for poten- tial oscillation.
3.2.4. Electrochemical impedance spectroscopy
Further characterisation of the system containing cMo =10 mM was conducted using Electrochemical Impedance Spectroscopy (EIS).
Impedance spectrum at E = − 200 mV vs. REF was recorded after t =60 min, when the system was sufficiently stable, and fitted using the equivalent circuit (Fig. 13a). Unfortunately, when cMo =0 mM the sta- tionary state was not achieved and EIS method could not be applied.
Cao, in his work, demonstrated the applicability of the similar model, but consisting of resistors, and capacitors, for an active–passive transi- tion of metals [32]. In this work the constant phase elements CPEs were applied instead of capacitors because much better fit was achieved. R1 in the applied model stands for the solution resistance whereas CPE1 cor- responds to the capacitance of the passive layer Cpas rather than the electrical double layer. The capacitance was calculated using the Eq. (2) as equal to 33 ±9 µF∙cm−2. This result, however, should be treated as rather rough estimation than precise calculation. First of all, the Eq. (2) can be applied when the surface distribution of time-constants is uni- form [33]. Validity of this assumption could not be verified. Secondly, application of this equation could lead to significant errors, because of α1 <0.85 (Table 3) [34]. The corresponding thickness of the passive layer d was roughly estimated as 0.5 nm using Eq. (3), assuming that it consists of MoO3:
Cpas=ε0εr
d (3)
where εr =18 [35], ε0 =8.85∙10−12 F∙m−1 and they stand for relative dielectric permittivity of MoO3 and dielectric permittivity of vacuum respectively.
Faradaic impedance consists of two resistors, R2, R3, and CPE2. R2 is the charge transfer resistance Rct. In the Cao’s original model Rct takes into account current densities corresponding to metal corrosion and passive layer formation, where both are anodic processes. Thus, the charge transfer resistance increases as the surface area that is not covered with the passive layer decreases [32]. Here the situation is more complex, because the protective layer is formed in the cathodic process.
This layer can be oxidised to some extent and there is also possibility of Al dissolution at E = − 200 mV vs. REF as visible in the inset of Fig. 9a.
Interpretation of R3 and CPE2 is even more complex. According to Cao’s model, the resistance R3 could be negative when the charge transfer coefficient for metal dissolution is smaller than the charge Table 2
Chemical composition of the surface of intermetallic Al2Cu after t =120 min exposition at E =0 mV vs. REF in solution containing cacid =0.25 M, cMo =10 mM, deaerated with Ar, stirred with 290 rpm, T =303 K.
Conditions Average concentration, at.%
C 1s O 1s Al(III) 2p Al(0) 2p P(V) 2p Cu(0) 2p Cu(II) 2p Mo(V) 3d Mo(VI) 3d
Prior sputtering 38.0 42.1 17.3 0.0 3.1 3.2 2.8 0.0 0.8
After sputtering 23.9 38.3 24.0 2.0 2.9 6.4 1.7 0.2 0.6
transfer coefficient for the electrochemical process of formation of the passive layer. In addition, the rate constant for dissolution of the passive layer must be sufficiently small. Constant phase element CPE2, with parameters T2 and α2, corresponds to the capacitor in Cao’s model. The capacitance decreases as the charge transfer resistance increases pro- vided that it is sufficiently high [32].
Cao’s model offers the possibility of a quantitative description of a passivating metallic electrode, but the mechanism of this process must be known. The studied one is much more complex than proposed by Cao.
This may cause significant deviation of CPE1 and CPE2 from the purely capacitive behaviour. Thus, the fitting has a rather formal character, nevertheless, high values of the charge transfer resistance (Table 3) and polarisation resistance, Rp = − 11.116 kΩ∙cm2 indicate existence of the compact protective layer.
Impedance spectrum obtained at OCP, at the stagnant solution, was also approximated with the same equivalent circuit as above, but the physical interpretation of the circuit’s elements remains unclear (Table 3). What is more, the low-frequency part of the spectrum was not Fig. 12. Mo 3d5/2 photoelectron spectra of the surface of intermetallic Al2Cu after t =120 min exposition at E =0 mV vs. REF in solution containing cacid =0.25 M, cMo =10 mM, deaerated with Ar, stirred with 290 rpm, T =303 K: (a) prior sputtering with Ar clusters, (b) after sputtering.
Fig. 13.EIS spectra obtained for intermetallic Al2Cu, cacid =0.25 M, cMo =10 mM, solution deaerated with Ar, stirred with 290 rpm, T =303 K: (a) E = −200 mV vs.
REF; (b) at OCP; continuous line shows fitting.
Table 3
The results of the approximation of the impedance spectra: σ, is the residual sum of squares indicating the quality of the fit; R1 is the solution resistance; T1 is the constant phase element parameter representing the passive layer; α1 is the exponent of the CPE1; R2 is the charge-transfer resistance; T2 and α2 are the parameter and exponent of CPE2, respectively, R3 is the resistance, these elements contribute to the Faradaic impedance; uncertainties of the fitted parameters, obtained from the Zview fitting software, are given in brackets.
Conditions σ R1
Ω∙cm2 T1
µF∙sα−1∙cm−2
α1 R2
Ω∙cm2 T2
µF∙sα−1∙cm−2
α2 R3
Ω∙cm2
cMo =10 mM, − 200 mV 0.02 16(1) 175(5) 0.78(0.01) 736(82) 177(7) 0.61(0.01) −11852(401)
cMo =10 mM, OCP 0.01 17(1) 465(116) 0.66(0.03) 24(4) 1021(112) 0.65(0.02) 99(4)
cMo =0 mM, +150 mV 0.07 15(1) 193(6) 0.74(0.01) 197(2) 7377(80) 0.83(0.02) −545(30)
cMo =10 mM, +150 mV 0.07 16(1) 137(4) 0.76(0.01) 413(6) 4942(70) 0.72(0.02) −1183(100)
approximated and thus the polarisation resistance was not calculated. In general, the impedance, including the charge transfer resistance, is much lower when compared to E = −200 mV vs. REF. This is probably because charge transfer occurs mainly within the oxide layer and is related to the oxidation of Mo ions. Rct also takes into account the for- mation of PMB(2e−) species at the electrode’s surface and Al2Cu corrosion, which is insignificant. The capacitance corresponding to CPE1
was not calculated, because the value of α1 was too low. More detailed studies of the protective layer stability are necessary to approximate the impedance spectrum in the whole frequency range as well as to provide the physical meaning of the circuit’s elements.
3.3. Influence of heteropolyoxomolybdates on stability of Al2O3 layer in acidic solution
The electrochemical behaviour of intermetallic Al2Cu was also studied at E = +150 mV vs. REF (Fig. 14a). Current density, in the so- lution without heteropolyoxomolybdates initially dropped, because at anodic polarisation passivating Al2O3 layer was formed on the surface.
Formation of such a thin layer, <5 nm, has already been reported at the open circuit potential and anodic polarisation, in deaerated borate so- lution at pH =5 [2]. Molybdenum oxides were not formed, because the potential was too high. Then, after 20–30 s, the current density increased because of Al2O3 dissolution in the acidic environment, pH = 1.2. It can be concluded that a certain equilibrium between the forma- tion and dissolution of the layer was established. This equilibrium, however, was unstable and there was a problem with the reproducibility of the chronoamperometric curves. In one of the experiments, the sta- tionary state was achieved enabling further characterisation of the sys- tem with EIS. In another, current spikes were observed (red and green lines in Fig. 14a, respectively). These current spikes indicate selective corrosion of the intermetallic as it was already explained. This lack of reproducibility can occur due to inhomogeneity of the electrode’s sur- face chemical composition possibly within cracks. Nevertheless, analysis of EIS spectrum also confirmed that the passive layer was initially pre- sent onto the intermetallic Al2Cu (Fig. 14b).
When the solution contained 10 mM of heteropolyoxomolybdate, lower current density was obtained. What is more, it decreased as time increased (Fig. 14a). This suggests that heteropolyoxomolybdate species adsorbed on the Al2O3 and inhibited its dissolution. Inhibition of Al2O3
dissolution has already been reported in the literature when the kinetics of stripping of anodic coatings was studied [36]. Alternatively, one could imagine the formation of a protective salt layer in the solution containing heteropolyoxomolybdates and aluminium ions. This,
however, was excluded experimentally when Al(ClO4)3 was mixed with molybdate-containing orthophosphoric acid solution. Dynamic light scattering was used to detect the formation of particles of solid matter, but none were detected. The same effect was obtained when the solution contained also PMB (data not shown).
Impedance spectra were approximated using the same equivalent circuit as previously. Here, however, the electrochemical processes related with molybdenum species can be neglected. Current density corresponding to the reduction of heteropolyoxomolybdate at E = +150 mV vs. REF is − 2.66 µA∙cm2 (Fig. 8a), which is over 200-fold smaller when compared to the anodic current density (Fig. 14a, black line).
Thus, the following electrochemical and chemical reactions describe the formation and dissolution of the oxide layer onto intermetallic Al2Cu (Eqs. (4)–(6)):
Al→Al3++3e− (4)
Al+3 2H2O→1
2Al2O3+3H++3e− (5)
1
2Al2O3+3H+→Al3++3
2H2O (6)
These equations are consistent with the model proposed by Cao [32].
Heteropolyoxomolybdate species complicate this because they affect oxide dissolution. Nevertheless, even this simplified model can be applied for the studied system.
Charge transfer resistance takes into account current densities for both reactions (4) and (5). Their sum gives the anodic current density presented in Fig. 14a. It was significantly lower in the solution where cMo = 10 mM when compared to cMo = 0 mM. Because hetero- polyoxomolybdate species can stabilise aluminium oxide against disso- lution [36], the surface area that is not covered with the oxide layer decreased. This, in turn, decreased current densities of reactions (4) and (5), because they are proportional to the surface area that is not covered with the oxide layer. Interestingly, Rct is much lower when compared to E = − 200 mV vs. REF which means that the protective properties of Mo- containing layer on the surface of Al2Cu are better than Al2O3.
According to Cao’s model, the resistance R3 can be negative when transfer coefficient of the reaction (4) is smaller than that of the reaction (5) and the rate constant for oxide dissolution (Eq. (6)) is sufficiently small. The decrease of the latter caused the decrease of the surface area uncovered with the oxide layer and thus the increase of |R3|. This effect can be even stronger when the potential-dependent rate constants of reactions (4) and (5) are decreased [32]. The increase of Rct and |R3| when E = +150 mV vs. REF and cMo was increased from 0 to 10 mM
Fig. 14.Electrochemical behaviour of intermetallic Al2Cu at E = +150 mV vs. REF, cacid =0.25 M, cMo =0 and 10 mM, solutions deaerated with Ar, stirred with 290 rpm, T =303 K: (a) chronoamperometric curves; (b) impedance spectra, continuous lines indicate fitting.
indeed occurred (Table 3). Both reasons explaining the increase of |R3| can be valid, because heteropolyoxomolybdate species not only stabilise the oxide layer against dissolution but also inhibit the anodic process in the corrosion cell [15,18]. The latter, however, was only demonstrated for aluminium alloys but not for the intermetallic Al2Cu.
Constant phase element CPE2, with parameters T2 and α2, corre- sponds to the capacitor in Cao’s model. The capacitance decreases as the charge transfer resistance increases, provided that the latter is suffi- ciently high [32]. In this work, the deviation of CPE2 from the purely capacitive behaviour is high, nevertheless T2 parameter decreased as Rct
increased.
Cao’s model offers the possibility of a quantitative description of the passivating metallic electrodes. The potential-dependent rate constants of the reactions (4) and (5) as well as the rate constant for oxide disso- lution (Eq. (6)) can be calculated. In this work, this could not be con- ducted because of the deviation from the capacitive behaviour predicted by the model at low frequencies. Nevertheless, the analysis provided explains the role of heteropolyoxomolybdate species in stabilisation of the oxide layer against dissolution in the acidic medium.
Capacitances of the passive layer, Cpas, formed at E = +150 mV vs.
REF were calculated using Eq. (2) and equal to 24 ±10 and 20 ±6 µF∙cm−2 for cMo = 0 and 10 mM respectively. Assuming dielectric permittivity εr of Al2O3 between 7.45 and 15 [37] one can calculate the thickness of the passive layer using Eq. (3). This gives d between 0.3 and 0.7 nm which is reasonable taking into account d <5 nm obtained at pH
=5 [2]. This result, however, should be treated as a rather rough esti- mation than precise calculation as it was already explained.
4. Conclusions
Interactions between heteropolyoxomolybdates and intermetallic Al2Cu were studied in the acidic solution. UV–Vis analysis revealed that PMB(2e−) intermediate appears in the solution and decomposes forming stable PMB(4e−) species. The overall rate of PMB(4e−) formation de- pends on the first step i.e. reduction of heteropolyoxomolybdate to PMB (2e−) at the surface of Al2Cu. PMB(4e−) species are oxidised with oxy- gen dissolved in the solution and this process strongly depends on temperature. When it was low, 303 K, the oxidation rate was much smaller when compared to the rate of PMB(4e−) formation.
The concentration of PMB(4e−) species in the solution decreases as the concentration of heteropolyoxomolybdate increases. This is due to the formation of a thin protective layer containing molybdenum oxides at various oxidation states. The layer plays a crucial role in corrosion behaviour of intermetallic Al2Cu protecting this against selective corrosion. Neither heteropolyoxomolybdate, nor phosphomolybdenum blue species behave as corrosion inhibitor. This is important conclusion and its consequences should be further studied for aluminium alloys.
This also suggests that similar mechanism of corrosion protection could be achieved in solutions containing isopolyoxomolybdates. This system is simpler to study because PMB species are not formed.
On the one hand, it was shown that heteropolyoxomolybdates sta- bilise aluminium oxide layer against dissolution in acidic solution. On the other hand, the protective layer composed of molybdenum oxides is formed at an appropriate potential value. This suggests that inhibition efficiency of aluminium alloys in solutions containing hetero- polyoxomolybdates could have been increased if the specimen was appropriately polarised. Specimen’s polarisation could also reduce the undesirable formation of the corrosion product on the surface of aluminium alloys.
CRediT authorship contribution statement
Przemysław Kwolek: Conceptualization, Methodology, Formal analysis, Investigation, Writing - original draft, Writing - review &
editing, Project administration, Funding acquisition. Marek Wojnicki:
Formal analysis, Investigation, Writing - original draft, Writing - review
& editing. Edit Csapo: ´ Writing - original draft, Writing - review &
editing.
Declaration of Competing Interest
The authors declare that they have no known competing financial interests or personal relationships that could have appeared to influence the work reported in this paper.
Acknowledgments
The financial support from the National Science Centre, Poland, Grant No. 2016/23/D/ST5/01343 is gratefully acknowledged. The au- thors also acknowledge Dr. Dariusz Szeliga and Mr. Andrzej Gradzik for preparation of the Al2Cu intermetallic phase, Dr. Małgorzata Wierz- binska for SEM/EDS characterisation of the intermetallic´ ’s surface, Dr.
Magdalena Wytrwał-Sarna for XPS characterisation, also Mr. Andrzej Obł´oj and Mr. Kamil Dychto´n for their help in conducting spectroscopic and electrochemical tests.
References
[1] L.F. Mondolfo, Aluminum Alloys: Structure and Properties, Butterworths & Co., London, 1976.
[2] J.R. Scully, T.O. Knight, R.G. Buchheit, D.E. Peebles, Electrochemical characteristics of the Al2Cu, Al3Ta and Al3Zr intermetallic phases and their relevancy to the localized corrosion of Al alloys, Corros. Sci. 35 (1993) 185–195, https://doi.org/10.1016/0010-938X(93)90148-A.
[3] R.G. Buchheit, A compilation of corrosion potentials reported for intermetallic phases in aluminum alloys, J. Electrochem. Soc. 142 (1995) 3994–3996, https://
doi.org/10.1149/1.2048447.
[4] H.M. Obispo, L.E. Murr, R.M. Arrowood, E.A. Trillo, Copper deposition during the corrosion of aluminum alloy 2024 in sodium chloride solutions, J. Mater. Sci. 36 (2001) 3479–3495, https://doi.org/10.1023/A:1017975728838.
[5] R.G. Buchheit, M.A. Martinez, L.P. Montes, Evidence for Cu Ion Formation by Dissolution and Dealloying the Al2CuMg Intermetallic Compound in Rotating Ring- Disk Collection Experiments, J. Electrochem. Soc. 147 (2000) 119–124, https://
doi.org/10.1149/1.1393164.
[6] M.B. Vukmirovic, N. Dimitrov, K. Sieradzki, Dealloying and Corrosion of Al Alloy 2024–T3, J. Electrochem. Soc. 149 (2002) B428, https://doi.org/10.1149/
1.1498258.
[7] P. Kwolek, G. Mr´owka-Nowotnik, M. Wytrwal-Sarna, Corrosion of structural constituents of 2017 aluminium alloy in acidic solutions containing inhibitors, Mater. Corr. (n.d.). https://doi.org/10.1002/maco.202012046.
[8] Z. Liu, P.H. Chong, A.N. Butt, P. Skeldon, G.E. Thompson, Corrosion mechanism of laser-melted AA 2014 and AA 2024 alloys, Appl. Surf. Sci. 247 (2005) 294–299, https://doi.org/10.1016/j.apsusc.2005.01.067.
[9] F. Vergara-Juarez, I. Rosales-Cadena, V.M. Salinas-Bravo, M.A. Lucio-Garcia, J. Porcayo-Calderon, J.G. Gonzalez-Rodriguez, et al., Effect of methanol on the corrosion behaviour of Al-Cu Alloys in sulphuric acid, Corros. Eng., Sci. Technol.
52 (2017) 476–483, https://doi.org/10.1080/1478422X.2017.1335531.
[10] D. Song, A.B. Ma, J.H. Jiang, P.H. Lin, F.M. Lu, L.Y. Zhang, Significantly changed intergranular corrosion and exfoliation corrosion behavior of the ultra-fine grained Al-5 mass% Cu alloy fabricated by ECAP, Mater. Corros. 64 (2013) 1015–1023, https://doi.org/10.1002/maco.201206874.
[11] W.R. Os´orio, C.A. Siqueira, C.A. Santos, A. Garcia, The Correlation between Electrochemical Corrosion Resistance and Mechanical Strength of As-Cast Al-Cu and Al-Si Alloys, Int. J. Electrochem. Sci. 6 (2011) 6275–6289.
[12] W.R. Os´orio, J.E. Spinelli, I.L. Ferreira, A. Garcia, The roles of macrosegregation and of dendritic array spacings on the electrochemical behavior of an Al–4.5 wt%
Cu alloy, Electrochim. Acta 52 (2007) 3265–3273, https://doi.org/10.1016/j.
electacta.2006.10.004.
[13] ASTM B137-95, Standard Test Method for Measurement of Coating Mass Per Unit Area on Anodically Coated Aluminum, 2009.
[14] S.A. Katz, H. Salem, The toxicology of chromium with respect to its chemical speciation: A review, J. Appl. Toxicol. 13 (1993) 217–224, https://doi.org/
10.1002/jat.2550130314.
[15] X. Li, S. Deng, H. Fu, Sodium molybdate as a corrosion inhibitor for aluminium in H3PO4 solution, Corros. Sci. 53 (2011) 2748–2753, https://doi.org/10.1016/j.
corsci.2011.05.002.
[16] P. Kwolek, A. Kami´nski, K. Dychto´n, M. Drajewicz, J. Sieniawski, The corrosion rate of aluminium in the orthophosphoric acid solutions in the presence of sodium molybdate, Corros. Sci. 106 (2016) 208–216, https://doi.org/10.1016/j.
corsci.2016.02.005.
[17] K. Dychto´n, P. Kwolek, The replacement of chromate by molybdate in phosphoric acid-based etch solutions for aluminium alloys, Corros. Eng., Sci. Technol. 53 (2018) 234–240, https://doi.org/10.1080/1478422X.2018.1446582.
[18] P. Kwolek, Corrosion behaviour of 7075 aluminium alloy in acidic solution, RSC Adv. 10 (2020) 26078–26089, https://doi.org/10.1039/D0RA04215C.
[19] M.T. Pope, Heteropoly and Isopoly Oxometalates, Springer-Verlag, Berlin, 1983.
[20] E.A. Nagul, I.D. McKelvie, P. Worsfold, S.D. Kolev, The molybdenum blue reaction for the determination of orthophosphate revisited : Opening the black box, Anal.
Chim. Acta 890 (2015) 60–82, https://doi.org/10.1016/j.aca.2015.07.030.
[21] P. Kwolek, M. Wojnicki, Spectrophotometric study of corrosion inhibition of aluminium in orthophosphoric acid aqueous solutions by using sodium molybdate, Corros. Eng., Sci. Technol. 54 (2018) 199–204, https://doi.org/10.1080/
1478422X.2018.1557914.
[22] K.D. Ralston, S. Chrisanti, T.L. Young, R.G. Buchheit, Corrosion Inhibition of Aluminum Alloy 2024–T3 by Aqueous Vanadium Species, J. Electrochem. Soc. 155 (2008) C350–C359, https://doi.org/10.1149/1.2907772.
[23] M. Iannuzzi, G.S. Frankel, Mechanisms of corrosion inhibition of AA2024-T3 by vanadates, Corros. Sci. 49 (2007) 2371–2391, https://doi.org/10.1016/j.
corsci.2006.10.027.
[24] E.E. Abd El Aal, S. Abd El Wanees, A. Farouk, S.M. Abd El Haleem, Factors affecting the corrosion behaviour of aluminium in acid solutions: II. Inorganic additives as corrosion inhibitors for Al in HCl solutions, Corr. Sci. 68 (2013) 14–24, https://doi.
org/10.1016/j.corsci.2012.09.038.
[25] P. Kwolek, B. Ko´scielniak, M. Wytrwal-Sarna, Pentavalent Vanadium Species as Potential Corrosion Inhibitors of Al2Cu Intermetallic Phase in the, Materials. 13 (2020) 1946, https://doi.org/10.3390/ma13081946.
[26] A. Lasia, Electrochemical Impedance Spectroscopy and its Applications, Springer- Verlag, New York, 2014.
[27] P. Kwolek, K. Dychto´n, M. Pytel, Orthophosphoric acid solutions of sodium orthovanadate, sodium tungstate, and sodium molybdate as potential corrosion inhibitors of the Al2Cu intermetallic phase, J. Solid State Electrochem. 23 (2019) 3019–3029, https://doi.org/10.1007/s10008-019-04397-0.
[28] B. Keita, E. Abdeljalil, F. Girard, S. Gerschwiler, L. Nadjo, R. Contant, et al., Electrochemically induced transformations of heteropolyanions: New electroactive metal oxide films studied by the electrochemical quartz crystal microbalance,
J. Solid State Electrochem. 3 (1999) 446–456, https://doi.org/10.1007/
s100080050180.
[29] V.S. Saji, C.W. Lee, Molybdenum, molybdenum oxides, and their electrochemistry, ChemSusChem 5 (2012) 1146–1161, https://doi.org/10.1002/cssc.201100660.
[30] J. Baltrusaitis, B. Mendoza-Sanchez, V. Fernandez, R. Veenstra, N. Dukstiene, A. Roberts, et al., Generalized molybdenum oxide surface chemical state XPS determination via informed amorphous sample model, Appl. Surf. Sci. 326 (2015) 151–161, https://doi.org/10.1016/j.apsusc.2014.11.077.
[31] J. Goldstein, D.E. Newbury, P. Echlin, D.C. Joy, A.D. Roming, C.E. Lyman, et al., Scanning Electron Microscopy and X-Ray Microanalysis, 2 nd, Plenum Press, New York, USA, 1992.
[32] C. Cao, On the impedance plane displays for irreversible electrode reactions based on the stability conditions of the steady-state-I. One state variable besides electrode potential, Electrochimica Acta. 35 (1990) 831–836, https://doi.org/10.1016/
0013-4686(90)90077-D.
[33] B. Hirschorn, M.E. Orazem, B. Tribollet, V. Vivier, I. Frateur, M. Musiani, Constant- Phase-Element Behavior Caused by Resistivity Distributions in Films I. Theory, J. Electrochem. Soc. 157 (2010) C452–C457, https://doi.org/10.1149/1.3499564.
[34] B. Łosiewicz, R. Jurczakowski, A. Lasia, Kinetics of hydrogen underpotential deposition at iridium in sulfuric and perchloric acids, Electrochim. Acta 225 (2017) 160–167, https://doi.org/10.1016/j.electacta.2016.12.116.
[35] S.K. Deb, J.A. Chopoorian, Optical properties and color-center formation in thin films of molybdenum trioxide, J. Appl. Phys. 37 (1966) 4818–4825, https://doi.
org/10.1063/1.1708145.
[36] P. Kwolek, A. Pustuła, W.J. Nowak, Influence of molybdophosphoric acid on the kinetics of the anodic coating dissolution, Surf. Coat. Technol. 357 (2019) 535–542, https://doi.org/10.1016/j.surfcoat.2018.10.055.
[37] M.M. Lohrengel, Thin anodic oxide layers on aluminium and other valve metals:
high field regime, Mater. Sci. Eng.: R: Rep. 12 (1993) 243–294.