FOGORVOSI SZEMLE n 114. évf. 4. sz. 2021. 168–179.
Érkezett: 2021. március 16.
Elfogadva: 2021. április 20. DOI https://doi.org/10.33891/FSZ.114.4.168-179
Introduction
It is widely known that deficiencies associated with mal- occlusion and craniofacial deformities are usually comor- bid with cognitive difficulties and psychiatric disorders.
Therefore, it is important to consider the adaptation of soft tissue and its contours during treatment planning whilst accommodating the limitations presented by the patients’ disabilities [1, 34].
As bimaxillary surgery provides more favourable re- sults for the aesthetic facial proportion, it has been in- creasingly used, especially in patients with mandibular prognathism [8, 21].
Previous post-operative studies on the soft tissue chang- es after the bimaxillary surgery were mainly based on the use of two-dimensional (2D) methods as an inspection tool, e.g. cephalometric images, anteroposterior graphs, and photogrammetric analyses [17, 31], in which super- imposition and magnification were considered limita- tions affecting the final results.
In the new era of three-dimensional (3D) imaging tech- niques, we can overcome these disadvantages and uti- lise more reliable diagnostic tools. Cone-beam comput- ed tomography (CBCT) is highly utilized for soft tissue
inspection, although, the high radiation dose should al- ways be taken into consideration [6, 32]. New 3D im- aging methods for soft tissue visualization, such as la- ser surface scanning and stereophotogrammetry, have recently been introduced [10]. These friendly, non-inva- sive procedures require a short scanning time; howev- er they are large footprint and are not easy to operate.
Using a structured-light scanning device, facial tex- ture and colour details can be easily collected with high resolution without exposure to the external radiation haz- ards [3], and is benefited by fast scanning time, portabil- ity, and flexible operability [30]. To our knowledge, there were only a few studies that used a 3D-facial scanner to evaluate the soft tissue changes after the orthognathic surgery of skeletal class III patients. Nevertheless, only some examined deviations at specific points or calcu- lated linear and angular measurements [7, 29]. Such finding may be improved by evaluating facial regions on a 3D-basis assessment. Therefore, the purpose of our prospective study is to perform an extensive evaluation of the short-term soft tissue changes in various morpho- logical regions of the face after the bimaxillary surgery of skeletal class III patients using a 3D handheld struc- tured-light scanner.
University of Szeged, Faculty of Medicine, Department of Oral & Maxillofacial Surgery, Craniofacial Unit, Hungary*
University of Szeged, Faculty of Medicine, Department of Oral & Maxillofacial Surgery, Hungary**
Three-dimensional changes of the facial soft tissue after bimaxillary surgery of skeletal class III patients:
a prospective study
DR. ALKHAYER ALI* DR. PIFFKÓ JÓZSEF** DR. SEGATTO EMIL*
Soft tissue adaptation and contours are of paramount importance in the design of orthognathic surgeries. The aim of our study was to investigate the use of three-dimensional handheld structured-light scanners for an extensive evalua- tion of the post-operative soft tissue changes in various morphological regions of the face following the bimaxillary sur- gery of skeletal class III patients. Our study sample consisted of 12 patients (6 males and 6 females) with mean age of (22 ± 2.17 years), with skeletal class III malocclusion, all which required bimaxillary osteotomy as the second step of their comprehensive treatment. The three-dimensional facial images were acquired one week before surgery (T0), and there- after, 6 months after surgery (T1), using a 3D-handheld structured light scanner. Linear and angular measurements were recorded and compared. Three-dimensional deviation analyses were done for the 7 morphological regions of the face.
Based on obtained results, we found statistically significant increases in the nasal and the nasal base widths, the nasal tip angle, the upper lip height, and the lower lip angle; significant decreases in the lower lip height and the inter-labial an- gle were also found. The three-dimensional soft tissue changes after the bimaxillary surgery of skeletal class III patients were observed in majority of the facial regions, with the most significant ones found in the middle third of the face, the nose, and the upper lip areas. These findings must be taken into account during treatment planning.
Keywords: Orthognathic Surgery, class III malocclusion, Facial Soft tissue, Three-Dimensional Imaging
Original article
Materials and Methods Study Sample
This prospective study was approved by the Human Investigation Review Board, the University of Szeged, Albert Szent-Györgyi Clinical Centre (No. 151/2019-SZTE).
Informed consent was obtained from all patients who agreed to participate in this study.
Patients with skeletal class III malocclusion requiring bimaxillary surgery as the second step of their full com- prehensive orthodontic-orthognathic treatment were re- cruited from the Craniofacial Unit, Department of Oral and Maxillofacial Surgery, Albert Szent-Györgyi Clinical Centre, University of Szeged, Hungary. Exclusion cri- teria were cleft lip and palate, craniofacial syndromes, major medical diseases, a history of facial trauma, and a previous orthognathic surgery. All of patients were of Caucasian ethnic backgrounds, had no further growth anticipated, and had had the pre-and post-surgical or- thodontic treatments successfully completed (Figure 1).
Our study consisted of 12 patients (6 males and 6 fe- males) with a mean age of 22 ± 2.17 years, range 19.6–
24.5 and without severe facial asymmetry (less than 4 mm of chin deviation from the mid-sagittal plane or facial midline). [13, 42]. The sample size was deter- mined based on the findings of a previous study by Ko- erich and colleagues [26]. All patients were treated by the same surgeon (J. P.), who performed maxillary ad- vancement and a mandibular setback to achieving a normal dento-skeletal relationship. Following imple- mentation of the treatment plan, the level of achieved skeletal movement was 3.87 ± 1.6 mm for the maxillary advancement, and 3.46 ± 1.34 mm for the mandibu- lar setback. No additional surgical procedures such as genioplasty, rhinoplasty, or infraorbital augmentations were performed either, in conjunction with the osteoto- mies or postoperatively.
Surgical Protocol
The surgical procedure consisted of the conventional Le Fort I osteotomy and the Bilateral sagittal split set- back osteotomy (BSSO). As per Obwegeser, the Le Fort I osteotomy cut was made above the apices of the maxillary teeth and underneath the infraorbital nerve [35], and then extended to achieve a full mobilization of the maxilla. The mobilized maxilla was moved and fixed in a previously planned position using a surgical splint.
During the (BSSO), the subperiosteal incision was made. The osteotomy was performed according to Ob- wegeser/Dal Pont [15]: splitting of the mandible was carried out, and a segment of bone was removed to re- tract the body of the mandible guided by the fabricated surgical splint. All patients underwent internal fixation of the maxilla and the mandible with functional mini-plates and mini-screws, and a surgical wafer was placed for approximately 5-6 weeks after surgery. Following re-
moval of the surgical wafers, intermaxillary elastic fixa- tions were performed to stabilize the occlusion.
Data processing and measurements
3D facial images using the 3D handheld structured-light scanner (Artec EvaTM; Artec Group, Luxembourg) were obtained one week prior to the surgery (T0), and thereaf- ter, 6 months post-surgery (T1). This scanner uses struc- tured light scanning technique for precise capture of up to 16 frames per second in a point-and-shoot mode with every frame captured as a 3D image. The frames are adjusted automatically, real-time and deliver high reso- lution (up to 0.5 mm) and high accuracy (up to 0.1 mm).
All images were taken with the head in a natural position, teeth within centric occlusion, lips in rest, and slightly closed eyes [39]. To accomplish the natural head balance, the subjects were seated in a back-supported and a vertically adjustable chair. They were instructed to turn their heads forward and backward with decreasing amplitude until a relaxed position is achieved [43]; then, they were requested to look straight ahead to the point on the wall in front of them at the eye level. During scan- ning, a hairband was used to prevent the concealment of the facial regions by the subjects’ hair.
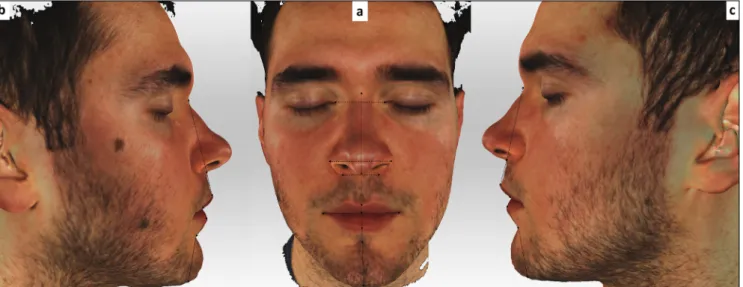
19 landmarks, 5 bilateral and 9 unilateral (Table 1, Figure 2), were located according to the literature [27, 40];
13 linear and 6 angular measurements were taken di- rectly with the 3D-facial images using Artec Studio V.12 software (Figure 3, 4).
To perform the 3D deviation analysis, the images were transferred into reverse engineering software (GOM Inspect Evaluation Software, Capture 3D, Inc., Santa Ana, CA); then, polygon meshes were created in stereolithography (STL) format. The hair, the ears, and the below-neck region were removed. The images ob- tained at the T0 time point were aligned with the images taken at T1 by using the overall best-fit method as per Dindaroglu and colleagues [16] (Figure 5).
Negative values indicate that T1 images are located behind the T0 images (blue shades), whereas positive values indicate that T1 images are located in front of the T0 images (red shades). To create morphological re- gions, reference lines passing through different points specified on the face were determined and a 3D devi- ation analysis was performed in seven morphological regions of the face [16] (Table 2, Figure 6). In addition, we calculated the deviation magnitude for the facial soft tissue landmarks directly on the 3D inspected meshes (Figure 7).
Statistical Analysis
Normal distribution of the data was set up through the Shapiro–Wilk and Kolmogorov-Smirnov tests. To deter- mine the method’s reliability, T0 and T1 images of the
FOGORVOSI SZEMLE n 114. évf. 4. sz. 2021.
170
Figure 1: Intraoral photographs of one patient included in our study.
(a) The initial phase. (b) T0 phase, during the pre-surgical orthodontic treatment.
(c) T1 phase, during the post-surgical orthodontic treatment. (d) The final phase after removal of the appliance
Table 1 Definition of facial landmarks used in our study.
Landmark Definition
Exocanthion (Ex)* The point at the outer commissure of the eye fissure Endocanthion (End)* The point at the inner commissure of the eye fissure Soft tissue nasion (N) Midpoint on the soft tissue contour of the nasal root’s base Alare (Al)* The most lateral point on each alar contour (on the base view).
Pronasale (Prn) The most anterior midpoint of the nasal tip (on the right and left profile view).
If a bifid nose is present, the more protruding tip is chosen to determine Pronasale.
Alar curvature point (Ac)* The point located at the facial insertion of each alar base. (on the submental view)
Subnasale (Sn) The midpoint on the nasolabial soft tissue contour between the Columella crest and the upper lip Columella (Cm) The midpoint of the Columella crest at the level of the nostril top points
Labiale superius (Ls) The midpoint of the vermilion line of the upper lip (on the submental view).
Stomion (Stm) The midpoint of the horizontal labial fissure.
Chelion (Ch)* The point located at each labial commissure (on the frontal view).
Labiale inferius (Li) The midpoint of the vermilion line of the lower lip (on the right profile view).
Sublabiale (Sl) The most posterior midpoint on the Labiomental soft tissue contour that defines the border between the lower lip and the chin.
Soft tissue pogonion (Pog´) The most anterior midpoint of the chin
Menton (Me´) The most inferior midpoint on the soft tissue contour of the chin located at the level of the 3-D cephalometric hard tissue Menton landmark
* Indicates bilateral landmarks (right and left).
Figure 3: Linear measurements used in our study (a) Frontal view. (b) and (c) Lateral views.
Figure 2: Landmarks used in our study located directly on the 3D-facial images (a) Frontal view. (b) and (c) Lateral views.
patients were re-aligned; then, the measurements were recalculated a month later by the same investigator. In- tra-examiner reliability was evaluated utilizing the intra- class correlation coefficient (ICC). The random errors were calculated according to Dahlberg’s formula (D =
√ ∑ d2/2N) [19], where D is the error variance, d is the difference between the first and second measure, and N is the sample size which was re-measured. The systematic errors were also assessed by the depend- ent t-test. The (T0) and (T1) linear and angular meas- urements were compared. Significant differences at the level of 5% significance were tested utilizing the Wilcox- on signed-rank test. Likewise, for every patient, a 3D deviation analysis was performed to calculate not only maximum positive and negative deviations, but also mean deviation amounts for the facial meshes. Ad- ditionally, the deviation magnitude for specific facial
landmarks was calculated directly on the 3D-assessed meshes. All statistical analyses were performed using the Statistical Package for Social Sciences software (SPSS Inc. v 24; Chicago, IL, USA).
Results
Based on Shapiro–Wilk test and Kolmogorov-Smirnov test, all parameters were normally distributed. The ICC values between the two sets of measurements were high (range 0.816–0.924). The amount of random error was small enough (less than 0.5 mm/°), and no system- atic errors were found in the measurements obtained on the two different occasions (p ≥ 0.05).
We found statistically significant increases in the nasal and nasal base width, the upper lip height, and
FOGORVOSI SZEMLE n 114. évf. 4. sz. 2021.
172
Figure 4: Angular measurements used in our study, (a) Frontal view. (b) and (c) Lateral views.
Figure 5: The best fit method used, (a) T0 mesh. (b) T1 mesh. (c) The final mesh aligned.
a decrease in the lower lip height after bimaxillary sur- gery (Table 3), which is also demonstratable in descrip- tive statistics of the pre-treatment (T0) and post-treat- ment (T1) variables.
Statistically significant increases in the nasal tip an- gle, the lower lip angle, and a decrease in the Inter-la- bial angle were noticed after the bimaxillary surgery, as seen in Table 4.
We found facial soft tissue changes in both the up- per and the lower face regions with a mean of (0.77, 0.67 mm) respectively; the mean deviation at the na- sal region was (1.03 mm), with the highest magnitude of the soft tissue changes found in the upper lip region with a mean deviation (3.25 mm). Descriptive statistics of the maximum positive and negative deviation limits
and also of the mean limits of the meshes are seen in Table 5, 6.
After calculating the deviation in the soft tissue, changes were observed in several further facial landmarks (Table 7).
Discussion
Facial soft tissue is dynamic and elastic, and is easily affected by other factors; such as swelling, weight, head position changes, or even by the treatment itself and the underlying hard tissue changes [11]. That’s why 2D-fa- cial images and cephalometric examination were found to be inadequate methods for soft tissue evaluation after surgical procedures. With advances in 3D technology,
Table 2 Definition of the morphological regions used for the 3D deviation analyses
Region Definition
Total face The facial region designated while creating masks before alignment
Upper face The region between the line passing through the right and left Exocanthion points and the line passing through the Subnasale point parallel to that line.
Lower face The region between the line passing through the Subnasale point and the line passing through the Menton point parallel to that line.
Upper lip The region between the lines passing through the right and left Endocanthion points and the right and left Cheilion points, and the line passing through the Subnasale point
Lower lip The region between the lines passing through the right and left Endocanthion points and the
right and left Cheilion points, and the line passing through the supramental point parallel to other lines.
Nose The region between the lines passing through the right and left Endocanthion points that are tangent to the nasal wings and the line passing through the Subnasale point
Chin The region formed between four reference lines: the two lines passing through the right and left Endocanthion points, the right and left cheilion points respectively, and the horizontal lines passing through Sublabiale and
Menton points respectively.
Figure 6: The morphological regions used for the deviation analysis.
(a) Total face region with the reference lines used. (b) Upper face region. (c) Nose region. (d) Lower face region.
(e) Upper lip region. (f) Lower lip region. (g) Chin region.
FOGORVOSI SZEMLE n 114. évf. 4. sz. 2021.
174
Figure 7: Deviation analysis used for specific landmarks in our study.
(a) Frontal view. (b) and (c) Lateral views.
Table 3 Descriptive statistics of the pretreatment (T0) and posttreatment (T1) linear measurements
Measurement T0 T1
Δ = T1- T0 (mm)
Mean (mm) SD Mean (mm) SD
Intercanthal width EnR-EnL 33.87 1.05 33.92 2.02 0.05
Nasal width Alar.R-Alar.L 36.44 3.38 38.75 3.32 2.31*
Nasal base width AcR-AcL 32.92 3.2 34.94 1.49 2.02*
Mouth width ChR-ChL 48.88 4.14 50.47 3.46 1.59
Nasal high N-Sn 50.13 4.46 50.2 4.9 0.07
Upper lip height Sn-Ls 12.3 2.97 13.77 2.8 1.47*
Upper lip vermilion height Ls-Stm 6.71 1.2 9.02 4.4 2.31*
Total upper lip height Sn-Stm 18.89 2.88 22.7 3.18 3.8*
Lower lip vermilion height Stm-Li 9.66 0.46 8.36 1.26 –1.3
Lower lip height Li-Sl 15.56 3.7 13.66 3.18 –1.9*
Lips vermilion height Ls-Li 16.37 1.47 17.38 1.62 1.01
Chin height Stm-Me´ 53.24 5.61 48.49 4.28 –4.75
Lower anterior facial height Sn-Me´ 72.14 4.7 73.54 4.18 1.4
* Significant changes at the level of 5% of significance (α = 0.05)
Table 4 Descriptive statistics of the pretreatment (T0) and posttreatment (T1) angular measurements
Measurement T0 T1 Δ = T1- T0
Mean (°) SD Mean (°) SD Mean (°) Nasal tip angle AlarR-Prn-AlarL 81.26 7.5 88.62 8.5 7.36*
Upper lip angle ChR-ls-ChL 119.7 6.2 115.38 6.9 –4.32 Lower lip angle ChR-li-ChL 116 4.8 126.46 4.56 10.46*
Inter-labial angle Ls–Stm–Li 134.33 8.5 125.52 8.67 –8.81*
Nasolabial angle Cm-Sn-Ls 82.68 9.14 94.25 6.22 11.57
Labio-mental angle Li-Sm- Pog´ 145.91 10.8 140.59 8.19 –5.32
* Significant changes at the level of 5% of significance (α = 0.05) based on the Wilcoxon signed-rank test
Table 5 Descriptive statistics of the maximum positive and negative deviation limits of the meshes
Morphological region Maximum positive deviation limits (mm) Maximum negative deviation limits (mm)
Minimum Maximum Mean SD Minimum Maximum Mean SD
Total face 5.84 5.96 5.9 0.08 –5.04 –4.74 –4.89 0.21
Upper face 5.68 5.98 5.87 0.16 –4.74 –3.04 –3.98 0.86
Lower face 5.62 5.84 5.7 0.15 –5.04 –2.53 –3.83 1.25
Nose 5.6 5.98 5.84 0.21 –4.74 –3.94 –4.49 0.7
Upper lip 5.62 5.84 5.71 0.11 –2.94 –2.4 –2.67 0.27
Lower lip 2.31 2.44 2.37 0.09 –5.04 –3.47 –4.25 1.11
Chin 0.46 1.48 0.97 0.72 –3.94 –3.38 –3.66 0.39
Table 6 Descriptive statistics of the mean limits of the meshes Morphological regions Minimum Maximum Mean SD
Total face 0.34 0.7 0.52 0.25
Upper face 0.29 1.31 0.77 0.51
Lower face 0.4 0.95 0.67 0.38
Nose 0.89 1.17 1.03 0.14
Upper lip 3.03 3.38 3.25 0.19
Lower lip –1.48 –0.95 –1.21 0.37
Chin –1.73 –1.59 –1.66 0.09
Table 7 Deviation magnitude of the facial soft tissue landmarks
Landmark Deviation mean (mm) SD
Endocanthion (right) Endr –0.4 1.09
Endocanthion (left) Endl –0.1 1.03
Soft tissue nasin N –0.23 0.78
Alar point (right) Alarr 1.26 0.92
Alar point (left) Alarl 0.85 0.99
Alar curvature (right) Acr 1.36 0.69
Alar curvature (left) Acl 1.14 0.83
Pronasale prn 1.93 0.12
Subnasale Sn 3.03 1.32
Chelion (right) Chr 0.63 0.78
Chelion (left) Chl 0.57 0.44
Labiale superius Ls 3.12 1.23
Labiale inferius Li –3 1.77
Stomion Sto 2.58 1.28
Sublabiale Sl –2 1.22
Soft tissue pogonion Pog´ –2.5 1.94
Soft tissue menton Me´ –1.3 1.76
it has become possible to standardize image registration and to reduce errors in head orientation [11, 4]. Some studies suggested that the flaws associated with refer- ence landmarks on 3D-facial images were in sub-milli- metre dimension. The facial soft-tissue landmarks were
reported as having moderate to high reliability and re- producibility, and the 3D-facial scanning systems could be useful in providing accurate images [9, 37]. Further- more, Jung et al. concluded that a structured light scan- ning system proved to be a useful tool to evaluate the
FOGORVOSI SZEMLE n 114. évf. 4. sz. 2021.
176
nasolabial soft tissue changes after orthognathic sur- gery [22], while Modabber and colleagues concluded that the Artec Eva scanner leads to more accurate 3D models as compared to scanning with FaceScan3D, and it is comparable to the other commercially available scanners [33].
To minimize the effects of different types of maloc- clusion and surgeon-related factors, the subjects’ selec- tion was limited to those with skeletal class III defects, and all operations were performed by one surgeon (J. P.).
Unfortunately, considering gender-related effects with- in the small sample size in our study further analyses were not feasible. Notwithstanding that, Chen and col- leagues found no sex-related differences in soft tissue changes in patients with mandibular prognathism after orthognathic surgery [12]. Further studies with larger sample size to inspect the sex-related effects of bimax- illary surgery on the soft tissue are essential.
The timing of the soft tissue analysis is very critical.
A period up to 6 months after bimaxillary surgery was chosen as the T1 stage due to the fact that a suffi- cient facial soft tissue stabilization is required to avoid any subsequent modifications, such as post-operative swelling, soft tissue remodelling, due to which the relo- cation should be minor enough to be insignificant [23].
Proffit and colleagues explained that postoperative changes do not show a normal distribution and that only a few patients exhibit considerable changes [38].
Similarly, Oh et al. found that 6 months post-surgery will be the ideal time for a proper assessment [36].
Soft tissue changes
We found a statistically significant increase in the nasal width and widening of the alar bases after bimaxillary osteotomies (2.31 mm and 2.02 mm p < 0.05 respec- tively). We can explain these increases by the remod- elling and relocating of the surrounding muscles in the alar region [36]. Our results confirmed the results of Baik and colleagues who found a 2.0 mm nasal width increase after maxillary advancement and mandibular setback [7]. Similarly, an increase was also reported in the alar width after bimaxillary surgery in class III pa- tients using a 3D laser scanner and 3D facial morpho- metry [18]. Liebregts and colleagues found an increase of 0.24 mm in the alar width for every 1 mm of maxillary advancement [28]. Altman and Oeltjen noted that all Le Fort I osteotomies caused widening of the alar bases due to retraction of perioral muscles around the maxilla, which results in their detachment from insertions during maxillary surgery [5].
In the study by Worasakwutiphong and colleagues, which evaluated the nasal changes in class III patients who underwent two-jaw surgery, it was found that, after the surgery, the alar width was increased by 0.74 mm and the nasolabial angle had increased significantly,
while the width of the alar base and the nasal height and length remained similar [44].
No significant changes neither in the intercanthal width, nor in the mouth width, were found in our study. This corresponds to results in previous studies following bi- maxillary surgeries, and it was reported that changes in the lips were produced by the stretching of soft tis- sues [7, 41].
With regards to the vertical plane, we found substan- tial increases in both the upper lip height and the upper lip vermilion height (1.47 and 2.31 mm, p < 0.05 respec- tively); thus, the total upper lip height was significantly increased by (3.8 mm). We can explain these increas- es by the relocation of the orbicularis oris muscle and a soft tissue tension in the upper lip region.
Marsan et al. found elongation in the upper lip (1.2 ± 1.6 mm) after bimaxillary surgery in Turkish female Class III patients [31, which supports our findings.
In our study, we found a statistically significant de- crease in the lower lip height (Li-Sl; 1.9 mm, p < 0.05).
In these changes, the upward and backward movement of the mandible may have played a role. A 4 mm de- crease was reported by Marsan et al. in their study [31], whilst the findings of Kim et al. suggest that the lower lip decrease could be rather due to influence of the mus- cle rather than the bone [24].
Regarding the angular measurements, we found a statistically significant increase in the Nasal tip angle (7.36 º, p < 0.05), which could be affected by the lateral movements of the alar landmarks, and the increase in the nasal and nasal base width due to the relocation of the nasalis muscle after the surgery.
Usually, in addition to the nasal tip projection, the nasolabial angle is used to record the maxillary pro- trusion in the upper lip. We found an insignificant in- crease in this angle (11.57 º), which could be produced by stretching the soft tissues in this area. We also no- ticed a decrease in the Inter-labial angle (–8.81°, p <
0.05), which could be explained by the relocation of the orbicularis oris muscle and the upper and lower lips af- ter the bimaxillary osteotomies. Following a bimaxillary surgery, a significant increase found in the lower lip an- gle (10.46 º) which could refer to the backward move- ment of the (Li) landmark, a decrease (–5.32 º) was al- so found in the Labiomental angle, but without reaching a significant level.
In their study on skeletal class III patients after a bi- maxillary surgery Al-Gunaid et al., evaluating the hard and soft tissue changes, found an increase in the nasol- abial angle, a decrease in the labio-mental angle, and an improvement of dentofacial aesthetics. They also re- ported that the soft tissue facial profiles and the posture of the lips were improved [2].
A gradual advancement at the nasal tip, a significant increase in the nasolabial angle, and a decrease in the labio-mental angle were reported in the study by Mar- san et al [31]. In our post-operative study, to improve
the analysis of the facial changes, we conducted the deviation analysis of the facial meshes in seven mor- phological regions across the whole face rather than focusing only on certain linear and angular measure- ments.
Although the high positive and negative deviation lim- its were observed in the total face region in our study, the mean deviation of all landmarks forming the re- gion didn’t exceed 0.52 ± 0.25 mm. This small magni- tude can be explained by the multidirectional soft tissue changes in the facial parts forming the overall facial en- velope.
We found facial soft tissue changes in both the upper face and lower face regions with a mean of 0.77 ± 0.51 and 0.67 ± 0.38 mm respectively, while the mean devi- ation at the nasal region was 1.03 ± 0.14 mm. Previous studies of maxillary advancement and mandibular set- back reported more soft-tissue movement in the cen- tral parts than in the lateral parts [25]. While Gjorup et al found that no changes occurred in the cheeks, they took into consideration that the influence of the muscles and soft tissue tension decreased as the distance from the area where the hard tissue changes increased [20].
The highest magnitude of the soft tissue changes was found in the upper lip region with a mean deviation of 3.25 ± 0.19 mm and high positive and negative de- viation peaks of 5.71 ± 0.11 mm and –2.67 ± 0.27 mm respectively.
In regard to the lower lip and chin regions, we no- ticed soft tissue decrease of –1.21 ± 0.37 mm and –1.66 ± 0.09 mm respectively. Baik et al. suggested that the semi-circular shapes of the maxilla and the mandible correspond to fewer changes in the sub-com- missural region (a lateral part) than in the labio-mental or chin regions (a central part) [7].
To provide a better overview of the facial changes, we calculated the deviation using designated land- marks of the face. The magnitude of deviation at the level of bilateral Alar points (1.26mm and 0.85 mm for the right and the left respectively) emphasizes lateral and anterior movements mentioned above. A similar movement can be anticipated at the level of bilateral Alar curvature landmarks (1.36, 1.14 mm), indicating soft tissue changes in the nasal region along with the deviation noticed at the level of pronasal and subnasal (1.93mm and 3.03 mm) regions respectively.
Similar results were found in the study of Çoban et al, which reported lateral movement of bilateral alar and alar curvature landmarks in addition to the upward and forward movements of alar and alar curvature, subna- sale, labiale superior, sublabiale, and pogonion, which concurs with our findings [14].
In the upper lip area, a positive deviation of 3.12 mm was found at the level of Labiale superius point, which is indicative of anterior moment following a bimaxillary surgery. Furthermore, following bimaxillary osteotomies, deviations of –3, –2.5, –1.3 mm at the level of Labiale inferius, Soft tissue pogonion, and Soft tissue menton
respectively were reported in our study, which may in- dicate a posterior movement of the soft tissue in both the lower lip and the chin regions and confirm our pre- vious results in the linear and angular measurements.
Even though small sample size being is one of the limitations of our study, it has delivered relevant and valuable information regarding three-dimensional soft tissue changes of the face. In order to further advance the clinical research and the analysis, it may be benefi- cial to be repeat the study with a larger sample size and to consider the gender-related effects.
Conclusion
In our present comprehensive 3D evaluation, we suc- ceeded to quantify and visualize the post-operative soft tissue changes in the 6th month of post bimaxillary surgery. Even in the presence of limitations of a small sample size, we concluded that, compared to the other facial structures, the middle third of the face, especially the nose and the upper lip, will be affected by the bi- maxillary surgery. These expected changed should be taken into account when planning the treatment, and the patients must be informed accordingly. Further investi- gations with a larger sample size and appropriate con- trols will be necessary for a more precise evaluation of the soft tissue responses following a bimaxillary surgery.
References
1. AckermAn JL, Proffit Wr, SArver Dm: The emerging soft tissue paradigm in orthodontic diagnosis and treatment planning.
Clin Orthod Res 1999; 2: 49–52.
https://doi.org/10.1111/ocr.1999.2.2.49
2. AL-GunAiD t, YAmAki m, tAkAGi r, SAito i: Soft and hard tissue changes after bimaxillary surgery in Japanese class III asymmetric patients. J Orthod Sci 2012; 1: 69–76.
https://doi.org/10.4103/2278-0203.103865
3. AlkhAyer A, Becsei r, hegedűs l, Párkányi l, Piffkó J, BrAunitzer g, et al: Evaluation of the Soft Tissue Changes after Rapid Maxillary Expansion Using a Handheld Three-Dimensional Scanner:
A Prospective Study. Int J Environ Res Public Health 2021; 18:
e3379. https://doi.org/10.3390/ijerph18073379 4. ALmeiDA rc, ceviDAneS LH, cArvALHo fA, mottA At,
ALmeiDA mA, StYner m, et al: Soft tissue response to mandibular advancement using 3D CBCT scanning.
Int J Oral Maxillofac Surg 2011; 40: 353–359.
https://doi.org/10.1016/j.ijom.2010.11.018
5. ALTMAN JI,OELTJEN JC: Nasal Deformities Associated With Orthognathic Surgery: Analysis, Prevention, and Correction.
J Craniofac Surg 2007;18: 734–739.
https://doi.org/10.1097/SCS.0b013e3180684328 6. AYoub Af, XiAo Y, kHAmbAY b, Siebert JP, HADLeY D:
Towards building a photo-realistic virtual human face for craniomaxillofacial diagnosis and treatment planning.
Int J Oral Maxillofac Surg 2007; 36: 423–428.
https://doi.org/10.1016/j.ijom.2007.02.003
7. bAik HS, kim SY: Facial soft-tissue changes in skeletal Class III orthognathic surgery patients analyzed with 3-dimensional laser scanning. Am J Orthod Dentofacial Orthop 2010; 138: 167–178.
https://doi.org/10.1016/j.ajodo.2010.02.022
FOGORVOSI SZEMLE n 114. évf. 4. sz. 2021.
178
8. bAiLeY LJ, coLLie fm, WHite rP Jr: Long-term soft tissue changes after orthognathic surgery.
Int J Adult Orthodon Orthognath Surg 1996;11: 7–18.
9. BAysAl A, Ozturk MA, sAhAn AO, uysAl t: Facial soft-tissue changes after rapid maxillary expansion analyzed with 3-dimensional stereophotogrammetry: A randomized, controlled clinical trial. Angle Orthod 2016; 86: 934–942.
https://doi.org/10.2319/111315-766.1
10. bronS S, vAn beuSicHem me, bronkHorSt em, DrAAiSmA J, berGé SJ, mAAL tJ, et al: Methods to quantify soft-tissue based facial growth and treatment outcomes in children:
a systematic review. PLoS One 2012; 7: e41898.
https://doi.org/10.1371/journal.pone.0041898 11. ceviDAneS LH, mottA A, Proffit Wr, AckermAn JL,
StYner m: Cranial base superimposition for 3-dimensional evaluation of soft-tissue changes.
Am J Orthod Dentofacial Orthop 2010; 137: S120–129.
https://doi.org/10.1016/j.ajodo.2009.04.021
12. cHen cm, LAi S, Lee He, cHen kk, HSu kJ: Soft-tissue profile changes after orthognathic surgery of mandibular prognathism.
Kaohsiung J Med Sci 2012; 28: 216–219.
https://doi.org/10.1016/j.kjms.2011.10.018 13. cHeonG YW, Lo LJ: Facial asymmetry:
etiology, evaluation, and management.
Chang Gung Med J 2011; 34: 341–351.
14. ÇOBAN G, YAVUZ İ,DEMIRBAŞ AE: Three-dimensional changes in the location of soft tissue landmarks following bimaxillary orthognathic surgery.
J Orofacial Orthop 2021 Jul; 82 (4): 257–265.
https://doi.org/10.1007/s00056-021-00279-1
15. DAL Pont G: Retromolar osteotomy for the correction of prognathism.
J Oral Surg Anesth Hosp Dent Serv 1961 Jan; 19: 42–47.
16. DinDAroGLu f, DurAn GS, GorGuLu S: Effects of rapid maxillary expansion on facial soft tissues : Deviation analysis on three-dimensional images. J Orofac Orthop 2016; 77: 242–250.
https://doi.org/10.1007/s00056-016-0033-5
17. enAcAr A, tAner t, toroGLu S: Analysis of soft tissue profile changes associated with mandibular setback and double-jaw surgeries. Int J Adult Orthodon Orthognath Surg 1999;
14: 27–35.
18. ferrAriO Vf, sfOrzA c, schMitz Jh, sAntOrO f: Three-dimensional facial morphometric assessment of soft tissue changes after orthognathic surgery. Oral Surgery, Oral Medicine,
Oral Pathology, Oral Radiology and Endodontics 1999; 88: 549–556.
https://doi.org/10.1016/S1079-2104(99)70084-3
19. DAHLberG G: Statistical Methods for Medical and Biological Students.
British Medical Journal 1940; 2: 358–359.
https://doi.org/10.1136/bmj.2.4158.358-b
20. GJoruP H, AtHAnASiou Ae: Soft-tissue and dentoskeletal profile changes associated with mandibular setback osteotomy.
Am J Orthod Dentofacial Orthop 1991 Oct; 100: 312–323.
https://doi.org/10.1016/0889-5406(91)70068-8 21. JunG J, Lee c-H, Lee J-W, cHoi b-J: Three dimensional
evaluation of soft tissue after orthognathic surgery.
Head & Face Medicine 2018; 14: 21.
https://doi.org/10.1186/s13005-018-0179-z
22. kAu cH, cronin AJ, ricHmonD S: A three-dimensional evaluation of postoperative swelling following orthognathic surgery at 6 months.
Plast Reconstr Surg 2007; 119: 2192–2199.
https://doi.org/10.1097/01.prs.0000260707.99001.79
23. kim kA, cHAnG YJ, Lee SH, An HJ, PArk kH: Three-dimensional soft tissue changes according to skeletal changes after mandibular setback surgery by using cone-beam computed tomography and a structured light scanner.
Prog Orthod 2019; 20: 25.
https://doi.org/10.1186/s40510-019-0282-0
24. kim nk, Lee c, kAnG SH, PArk JW, kim mJ, cHAnG Yi:
A three-dimensional analysis of soft and hard tissue changes after a mandibular setback surgery.
Comput Methods Programs Biomed 2006; 83: 178–187.
https://doi.org/10.1016/j.cmpb.2006.06.009
25. koericH L, brunetto DP, oHirA etb: The effect of hard tissue surgical changes on soft tissue displacement: a pilot CBCT study.
Dental Press J Orthod 2017; 22: 39–46.
https://doi.org/10.1590/2177-6709.22.5.039-046.oar 26. fArkAS LG: Anthropometry of the head and face in medicine.
Journal of Oral and Maxillofacial Surgery 1981; 40: 394.
https://doi.org/10.1016/0278-2391(82)90269-5
27. LiebreGtS J, Xi t, ScHreurS r, vAn Loon b, berGe S, mAAL t:
Three-dimensional virtual simulation of alar width changes following bimaxillary osteotomies.
Int J Oral Maxillofac Surg 2016; 45: 1315–1321.
https://doi.org/10.1016/j.ijom.2016.05.012
28. liM yk, chu eh, lee dy, yAng ih,BAek sh: Three-dimensional evaluation of soft tissue change gradients after mandibular setback surgery in skeletal Class III malocclusion.
Angle Orthod 2010; 80: 896–903.
https://doi.org/10.2319/021210-90.1
29. mA L, Xu t, Lin J: Validation of a three-dimensional facial scanning system based on structured light techniques.
Comput Methods Programs Biomed 2009; 94: 290–298.
https://doi.org/10.1016/j.cmpb.2009.01.010
30. mArSAn G, curA n, emekLi u: Soft and hard tissue changes after bimaxillary surgery in Turkish female Class III patients.
J Craniomaxillofac Surg 2009; 37: 8–17.
https://doi.org/10.1016/j.jcms.2008.07.004
31. mirAcLe Ac, mukHerJi Sk: Conebeam CT of the head and neck, part 1: physical principles.
AJNR Am J Neuroradiol 2009; 30: 1088–1095.
https://doi.org/10.3174/ajnr.A1653
32. moDAbber A, PeterS f, kniHA k, GoLoboroDko e, GHASSemi A, LetHAuS b, et al: Evaluation of the accuracy of a mobile and a stationary system for three-dimensional facial scanning.
J Craniomaxillofac Surg 2016; 44: 1719–1724.
https://doi.org/10.1016/j.jcms.2016.08.008
33. obWeGeSer H: Surgery of the maxilla for the correction of prognathism. SSO Schweiz Monatsschr Zahnheilkd 1965 75:
365–374. (German)
34. oH km, Seo Sk, PArk Je, Sim HS, ceviDAneS LH, kim YJ, et al:
Post-operative soft tissue changes in patients with mandibular prognathism after bimaxillary surgery.
J Craniomaxillofac Surg 2013; 41: 204–211.
https://doi.org/10.1016/j.jcms.2012.09.001
35. otHmAn SA, AHmAD r fAu, mericAnt Af, mericAnt Af fAu, JAmALuDin m, JAmALuDin m: Reproducibility of facial soft tissue landmarks on facial images captured on a 3D camera.
Aust Orthod J 2013 May; 29: 58–65.
36. Proffit Wr, turveY tA,PHiLLiPS c: The hierarchy of stability and predictability in orthognathic surgery with rigid fixation:
an update and extension. Head Face Med 2007; 3: 21.
https://doi.org/10.1186/1746-160X-3-21
37. SoLoW b, tALLGren A: Natural Head Position in Standing Subjects.
Acta Odontol Scand 1971; 29: 591–607.
https://doi.org/10.3109/00016357109026337
38. SWennen GrJ: 2006. 3-D Cephalometric Soft Tissue Landmarks Three-Dimensional Cephalometry. Springer.
https://doi.org/10.1007/3-540-29011-7
39. tiWAri r, cHAkrAvArtHi PS, kAttimAni vS, LinGAmAneni kP:
A Perioral Soft Tissue evaluation after Orthognathic Surgery Using Three-Dimensional Computed Tomography Scan.
Open Dent J 2018; 12: 366–376.
https://doi.org/10.2174/1874210601812010366
40. WAnG tt, WeSSeLS L, HuSSAin G, merten S: Discriminative Thresholds in Facial Asymmetry: A Review of the Literature.
Aesthet Surg J 2017 Apr; 1; 37: 375–385.
https://doi.org/10.1093/asj/sjw271
41. Weber DW, fALLiS DW fAu, PAcker mD, PAcker mD:
Three-dimensional reproducibility of natural head position.
Dr. ALkHAYer ALi* dr. Piffkó József** Dr. SeGAtto emiL*
Az arc lágyrészeinek háromdimenziós változásai skeletalis III. osztályú páciensek bimaxilláris műtétje után: prospektív vizsgálat
Az ortognath műtétek tervezésénél a lágyrészek adaptációjának és kontúrjainak figyelembe vétele kiemelt fontosságú.
Prospektív tanulmányunk célja a skeletalis III. osztályú páciensek bimaxilláris műtétje után, az arc különböző morfológiai régióiban bekövetkezett lágyrész-változások átfogó értékelésének elvégzése kézi háromdimenziós strukturált fény szken- nerrel. Vizsgálati mintánk 12 olyan páciensből állt (6 férfi és 6 nő, átlagéletkoruk 22 ± 2,17 év), akiknek a skeletalis III. osztályú eltérése átfogó kezelésük második lépéseként bimaxilláris osteotomiát igényelt. Háromdimenziós arcképe- ket készítettünk egy héttel a műtét előtt (T0) és 6 hónappal a műtét után (T1) kézi 3D strukturált fényszkennerrel. A ké- peken lineáris és szögméréseket végeztünk és hasonlítottunk össze, illetve elkészítettük az arc 7 morfológiai régiójának háromdimenziós deviációs elemzését. Statisztikailag szignifikáns növekedést találtunk az orr- és az orralap szélessé- gében, az orrcsúcs szögében, a felső ajak magasságában és az alsó ajak szögében. Ezzel szemben az alsó ajak ma- gassága és az inter-labialis szög értéke szignifikánsan csökkent. A skleletalis III. osztályú betegek bimaxilláris műtétje után különböző mértékű háromdimenziós lágyrész változásokat figyeltünk meg a faciális régiók többségében, melyek közül jelentősebbek voltak a középarc, az orr és a felső ajak változásai. Ezekkel a várható változásokkal a kezelések megtervezésénél számolni kell.
Kulcsszavak: Ortognath sebészet, III. osztályú rendellenesség, arc lágyrész, háromdimenziós képalkotás Eredeti cikk
https://doi.org/10.1016/j.ajodo.2012.11.026
42. WorASAkWutiPHonG S, cHuAnG Y-f, cHAnG H-W, Lin H-H, Lin P-J, Lo L-J: Nasal changes after orthognathic surgery for patients
three-dimensional photogrammetry.
J Formos Med Assoc 2015; 114: 112–123.
https://doi.org/10.1016/j.jfma.2014.10.003