1
Integration of in situ experiments and numerical simulations to reveal the 1
physicochemical circumstances of organic and inorganic precipitation at a thermal 2
spring 3
Petra Kovács-Bodora*, Dóra Andab, Laura Jurecskab, Mihály Óváric, Ákos Horváthd, Judit 4
Makkb, Vincent Poste, Imre Müllera, Judit Mádl-Szőnyia 5
a József and Erzsébet Tóth Endowed Hydrogeology Chair, Department of Physical and 6
Applied Geology, ELTE Eötvös Loránd University, Pázmány Péter stny. 1/C., H-1117, 7
Budapest, Hungary 8
b Department of Microbiology, ELTE Eötvös Loránd University, Pázmány Péter stny. 1/C., H- 9
1117, Budapest, Hungary 10
c MTA Centre for Ecological Research, Danube Research Institute, Karolina út 29., H-1113, 11
Budapest, Hungary 12
d Department of Nuclear Physics, ELTE Eötvös Loránd University, Pázmány Péter stny. 1/A., 13
H-1117, Budapest, Hungary 14
e Federal Institute for Geosciences and Natural Resources, Hannover, Germany 15
* corresponding author: Petra Kovács-Bodor, petra.bodor28@gmail.com, ELTE Eötvös 16
Loránd University, Pázmány Péter stny. 1/C., H-1117, Budapest, Hungary 17
email addresses: petra.bodor28@gmail.com (P. Kovács-Bodor), andadora@caesar.elte.hu (D.
18
Anda), jurecskalaura@gmail.com (L. Jurecska), ovari.mihaly@okologia.mta.hu (M. Óvári), 19
akos@ludens.elte.hu (Á. Horváth), makkjudit@gmail.com (J. Makk), Vincent.Post@bgr.de 20
(V. Post), imremuller40@gmail.com (I. Müller), szjudit@ludens.elte.hu (J. Mádl-Szőnyi) 21
Abstract 22
2
Organic and inorganic precipitates are both characteristic in the active hypogenic karst area of 23
Buda Thermal Karst in Hungary. As an active system, it is a good natural laboratory to study 24
ongoing precipitation processes. Because of anthropogenic influence and the complexity of 25
spring environments, it is challenging to reveal all the governing factors in the process of 26
precipitation. In situ experiments, i.e. artificially controlled natural systems simplify the 27
complexity by adding, excluding or stabilizing influencing parameters during the experiment.
28
CO2 degassing drives changes in the physicochemical parameters of spring waters from the 29
discharge along their flow path. The rate and spatial extension of these changes depend on local 30
hydrogeological, geological, climatic, topographical etc. factors, affecting precipitation 31
processes.
32
In this study, two one-day-long in situ experiments were executed to examine the 33
physicochemical parameter changes of thermal water in a tunnel. The integration of the results 34
with reactive transport models revealed the physicochemical processes of ingassing and 35
degassing and predicted CaCO3 precipitation along the flow path. Small-scale roughness of the 36
channel surface seemed to further influence pH and concentration of HCO3-. After six weeks 37
of thermal water flowing, organic precipitate (biofilm) formed close to the discharge and then, 38
with a sharp change, inorganic precipitate (calcite) dominates a bit further from the discharge.
39
In situ experiments and connected numerical simulations revealed the role of CO2 degassing 40
and calcite precipitation in the changes of physicochemical parameters, but organic precipitates 41
also have to be considered near the discharge.
42
Keywords 43
3
thermal water; in situ experiment; physicochemical parameters; reactive transport modelling;
44
organic precipitation; inorganic precipitation 45
Acknowledgement 46
This work was supported by the National Research Development and Innovation Office 47
(NKFIH 101356). The authors would like to thank the permission and the help of Budapest 48
Spa Plc. and the management of Gellért Spa. The measurements would not have been possible 49
without the assistance of the Geology BSc, MSc and PhD students of Eötvös Loránd 50
University. The scientific discussions with Andrea Mindszenty are highly appreciated. Both 51
in the field and in the laboratory, László Szikszay has provided essential help. Thanks are also 52
due to the Departments of Nuclear Physics, Microbiology, Physical Geography, Meteorology, 53
Analytical Chemistry and the Imre Müller and Heinz Surbeck Hydrogeology Laboratory of 54
Eötvös Loránd University for the various measurements which were required. Special thanks 55
to Heinz Surbeck for providing the alpha spectrometer to measure the radionuclides. Thanks 56
also to András Hegedűs and Katalin Csondor for their professional work on the photos.
57
1. Introduction 58
Changes in the physicochemical parameters of springs are observed from their points of 59
outflow along their flow paths. The main driving force of these changes is the degassing of 60
CO2 due to the significant difference between the partial pressure of CO2 in the air and in the 61
water. One consequence of CO2 escape is an increase in pH. Additionally, the oxidative 62
environment, i.e. the air causes a rise in the dissolved oxygen content of the water. The rate 63
and spatial extension of the variations depends on many factors, such as the change in 64
pressure, the initial physicochemical parameters, the flow velocity and depth of the water, 65
parameters related to the air, and the irregularities of the bottom of the spring or stream bed, 66
4
i.e. turbulence (Chen et al., 2004; Dandurand et al., 1982; Hammer et al., 2008; Herman &
67
Lorah, 1986, 1987; Hoffer-French & Herman, 1989, 1990; Lorah & Herman 1988, 1990;
68
Nordstrom et al., 2005; Zhang et al., 2001).
69
The aquatic chemistry of the outflowing water is dependent on the groundwater flow system 70
feeding the spring (Tóth, 1963). In the case of the discharge of a regional groundwater flow 71
system, thermal water rises to the surface, and this is characterized by a low dissolved oxygen 72
content, neutral or acidic pH, a high Total Dissolved Solid (TDS) content, elevated 73
temperature and, usually, a high concentration of CO2 (Goldscheider et al., 2010; Mádl- 74
Szőnyi and Tóth, 2015; Tóth, 1963). As a consequence of these characteristics, the gradient 75
between the discharging thermal water and the air is high, so the physicochemical parameters 76
change abruptly closer to the outflow than in the case of lukewarm and cold springs. The 77
38.5–93 °C thermal waters in Yellowstone National Park display remarkable variations in the 78
parameters over the first 6–30 meters from the outflow (Nordstrom et al., 2005). In the case of 79
colder waters (9.3–35 °C), however, at locations with similar surface temperatures, a greater 80
distance from the outflow (ranging from 47 m up to as far as 10 km) is required for such 81
differences to be observed (Amundson and Kelly, 1988; Dandurand et al., 1982; Das and 82
Mohanti, 2015; Dreybrodt el al., 1992; Herman & Lorah, 1986, 1987; Hoffer-French and 83
Herman, 1989, 1990; Lorah and Herman 1988, 1990).
84
The latitudinal and altitudinal location of a given spring discharge is another crucial factor in 85
defining the gradient between the water and the air. The temperature, humidity, air pressure, 86
seasonality, daily variations of these parameters are further factors influencing changes in the 87
physicochemical parameters of the flowing water, so as the density and type of vegetation 88
(e.g. Das & Mohanti, 2015; Herman & Lorah, 1986; Hoffer-French & Herman, 1989, 1990).
89
5
It is a special case when the spring discharges into a cave. There are no or quite smoothened 90
seasonality and daily variations in air conditions in caves compared to the outside air.
91
Furthermore, in the absence of light, there is no photosynthetic vegetation, but there are plenty 92
of nutrients for chemoautotrophic and chemolithoautotrophic bacteria, which inhabit the walls 93
and the water, usually forming biofilms (e.g. Engel et al. 2001; Sarbu et al., 1996). Biofilms 94
also form in subaerial springs (e.g. Amundson & Kelly, 1998; Das & Mohanti, 2015;
95
Nordstrom et al. 2005). The bacteria influence their environment via metabolization and 96
therefore, take part in the processes of dissolution and precipitation (e.g. Ehrlich, 2001).
97
Carbonates are also common phenomena in caves and springs. The increasing pH of water 98
causes a rise in the saturation index with respect to calcite (SIcalcite) and after reaching the 99
appropriate state of supersaturation, CaCO3 precipitates. Biofilms and carbonates often occur 100
together, connected to the same water body, and characterized by the same water chemistry.
101
Because of that, and the complexity of natural spring systems, it is challenging to measure and 102
take into consideration all the governing factors in the process of precipitation. Laboratory 103
experiments are often executed to study the evolution of precipitates and the effects of 104
specific parameters. However, it is not possible to make such a complex system in the 105
laboratory, what exists in the nature. In situ experiments, i.e. artificially controlled natural 106
systems provide a key solution in overcoming these problems. Parameters can be added, 107
excluded or stabilized during the in situ experiment. The changes of the water chemistry and 108
the formation of the precipitates can be followed in time and space.
109
Based on these preliminary considerations, an in situ experiment was conducted in the active 110
hypogenic karst area of Buda Thermal Karst (BTK) in Hungary, where biofilm formation and 111
carbonate precipitation are active processes (Erőss, 2010; Mádl-Szőnyi and Erőss, 2013). The 112
direct observation of ongoing precipitation processes is possible near the surface in thermal 113
6
spring caves and hypogenic caves (Erőss, 2010), and thus providing an excellent natural 114
laboratory. The thermal springs of the BTK are anthropogenically controlled, so in situ 115
experiments cannot be made at these locations. But there is a canal in the artificial tunnel of 116
Gellért Hill, which is located close to the thermal water discharge in the south part of the 117
BTK. Here thermal water can be directed into a trapezoid canal, simulating thermal spring 118
discharge in a cave environment. The known and constant initial volume discharge, the easily 119
measurable water chemistry along the flow path and the regular canal profile provide good 120
input data to a reactive transport model. The integration of in situ experiment and numerical 121
simulation gives a detailed picture of the changing physicochemical parameters and the 122
underlying biogeochemical processes.
123
The aim of the study was to examine the rate and spatial extension of the physicochemical 124
parameter changes of flowing thermal water via an in situ experiment in the “artificial cave”
125
of a natural laboratory to reveal the circumstances of the evolution of organic and inorganic 126
precipitation in advance of their formation. Furthermore, to examine the distribution of 127
radionuclides and trace elements along the flow path of the thermal water, before the 128
adsorbing precipitates form. Beside the measurements, reactive transport modelling was used 129
to simulate the main chemical reactions along the flow path of the thermal water.
130
2. The study area 131
2.1 Gellért Hill 132
7 133
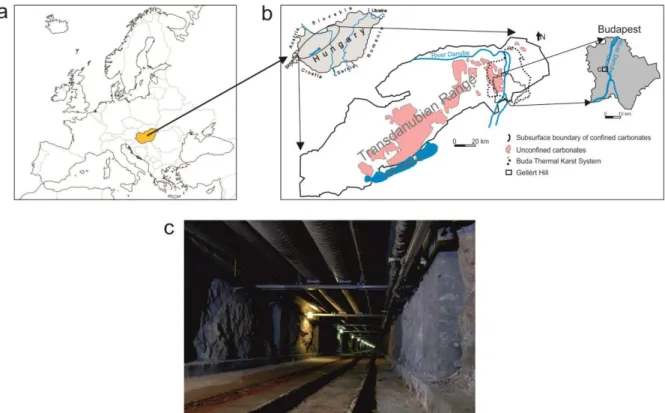
Fig. 1 (a) Location of Hungary in Europe, (b) the study area in the Transdanubian Range 134
(modified after Fülöp in Haas, 2001 and Mádl-Szőnyi et al., 2001) and (c) the Gellért tunnel 135
The BTK is the regional discharge area of a thick carbonate system lying on the boundary of 136
confined and unconfined carbonates (Mádl-Szőnyi and Tóth, 2015). The BTK is situated on 137
the northeastern edge of this carbonate system, the Transdanubian Range (Fig. 1a, b).
138
Hydraulic and hydrochemical studies and the radionuclide analysis of the BTK have assisted 139
in the delineation of the flow components of the discharge area (Erhardt et al., 2017; Erőss et 140
al., 2012; Mádl-Szőnyi et al., 2017a, b). In the Gellért Hill area, only thermal springs, 141
originating from regional groundwater flow systems discharge. These waters are characterized 142
by not only fresh karst water, but by some additional basinal fluid component from the 143
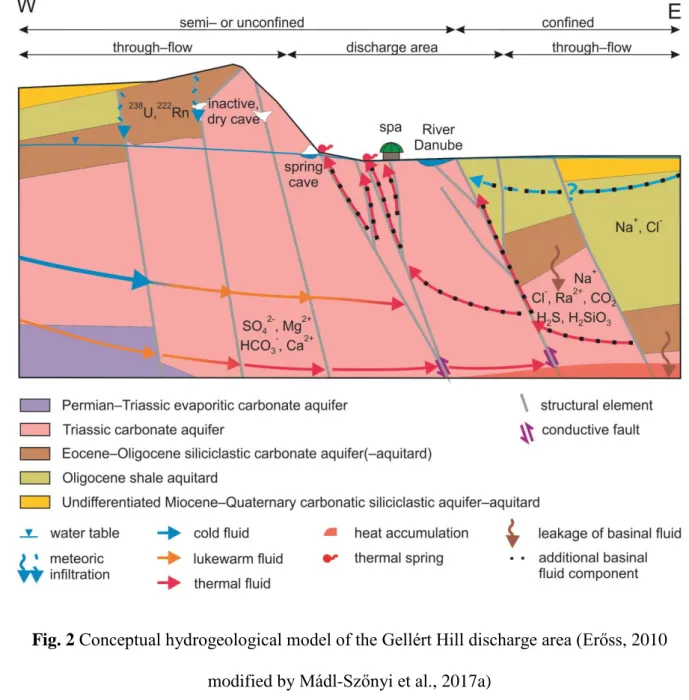
confined part. The discharging thermal water has elevated concentrations of HCO3-, Ca2+, 144
Mg2+ and SO42- (Erőss, 2010; Kovács and Erőss, 2017). The basinal fluids, on the other hand, 145
are responsible for the Na+, Cl-, Ra2+, CO2, H2S, H2SiO3 and trace element content of the 146
discharging water (Mádl-Szőnyi and Tóth, 2015; Mádl-Szőnyi et al., 2017a) (Fig. 2).
147
8
Associated with the discharge of groundwater flow systems, springs, thermal caves (e.g. Leél- 148
Őssy, 1995; Leél-Őssy and Surányi, 2003; Takács-Bolner and Kraus, 1989), inorganic and 149
organic precipitates are to be found in this specific hydrogeologic environment (Erőss, 2010;
150
Mádl-Szőnyi and Erőss, 2013). It has been discovered that biofilms are formed where the 151
discharging reduced thermal water become oxidized, i.e. meets the air (Borsodi et al., 2012;
152
Erőss et al. 2012). Bacteria, inhabiting the biofilms, take part mainly in the iron and sulphur 153
cycle via iron (FeII)/sulphur-oxidation or iron(FeIII)/sulphate-reduction (Anda et al. 2014;
154
Borsodi et al., 2012; Makk et al. 2016). Furthermore, biofilms in spring caves and springs can 155
adsorb 226Ra from the water and are responsible for the elevated 222Rn content of thermal 156
springs in the BTK, (Erőss et al., 2012), similar phenomena have been observed in Japan 157
(Fujisawa and Tazaki, 2003; Nagai et al., 2001; Tazaki, 2009) and in Switzerland (Gainon et 158
al., 2007). Trace elements also tend to accumulate in biofilms (Dobosy et al., 2016; Le Guern 159
et al., 2003).
160
9 161
Fig. 2 Conceptual hydrogeological model of the Gellért Hill discharge area (Erőss, 2010 162
modified by Mádl-Szőnyi et al., 2017a) 163
2.2 Location of the in situ experiment 164
A canal in an artificial tunnel in Gellért Hill was the location of the in situ experiment. The 165
tunnel was built between 1969 and 1978 to act as a gallery and to supply the spas of Buda 166
along the River Danube with unpolluted thermal water. The tunnel is 1100 metres long and 167
situated by 2–3 meters above the groundwater level. It connects three spas (Fig. 3a).
168
10 169
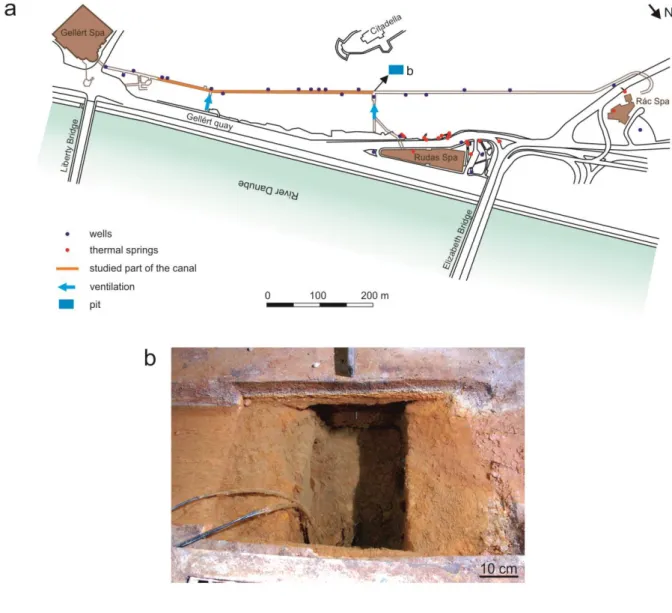
Fig. 3 (a) Route of the Gellért tunnel, with the location of spas, wells, thermal springs, 170
ventilation ducts and the pit and (b) the pit 171
The groundwater and Danube are hydraulically connected, so when the river floods, the river 172
water pushes the discharge of thermal water down into river bed, causing the shifting of this 173
extra thermal water discharge to the river bank (Alföldi et al., 1968; Schafarzik, 1920;
174
Somogyi, 2009; Striczki, 2010 etc.). Consequently, during floods the tunnel is submerged 175
under thermal water. To facilitate access to the tunnel during these high-water episodes and 176
control the outflowing water, pits (Fig. 3b) and a trapezoid canal (average size: bases - 27 and 177
39 cm, legs - 9 and 7 cm) have been excavated into the concrete floor of the tunnel.
178
11
A 400m long section of the canal was studied in the course of the in situ experiment, because 179
thermal water discharges in the area of Gellért Hill at a temperature of 31.4–46.7 °C (Erőss et 180
al. 2012), so the gradient is high and fast changes are to be expected in the physiochemical 181
parameters of the water, surely stabilizing in the 400m long section.
182
Based on measurements made within the in situ experiment, two main factors influence the air 183
temperature in the tunnel (Weidinger et al., 2016). The first is the presence of the district 184
heating pipes of the city, which are attached to and follow the ceiling of the tunnel. The 185
second is the location of various junctions and ventilation ducts. In the studied 400m long 186
section of the tunnel, there are two places where fresh air can enter. One is where the thermal 187
water outflows from the pit (at the Rudas Spa junction) and the other is at a distance of around 188
300m from the pit (Fig. 3).
189
3. Data and methods 190
3.1 Experimental settings 191
The in situ experiments were carried out when the water level of the Danube was relatively 192
low, so the effects of flood could be excluded. To provide thermal water outflow, a pump 193
(Barwig BWV 01 low voltage submersible pump) was inserted into the pit 194
(width*length*depth: 25*35*39 cm) (Fig. 3b) at the Rudas Spa junction. This pump ensured a 195
constant and manageable level of water discharge.
196
The one-day-long experiment was performed on two separate occasions, 23rd March 2016 and 197
22nd April 2016. On both occasions, pumping was started a few hours before the 198
measurements to ensure the water filled the entire examined length (400 m) of the canal. Later 199
on, the experiment was repeated for 6 weeks to study the thermal water precipitates, to 200
validate the results of the integration of one-day-long experiments and numerical simulations.
201
12
3.2 Measured and sampled parameters, sampling strategy and procedure 202
On both experimental occasions, parameters were measured at defined distances from the pit, 203
i.e. from the outflow of the thermal water. Those parameters were measured which can 204
influence precipitation processes or can be affected by the precipitates (temperature, pH, 205
specific electric conductivity, dissolved oxygen content, concentration of anions, cations and 206
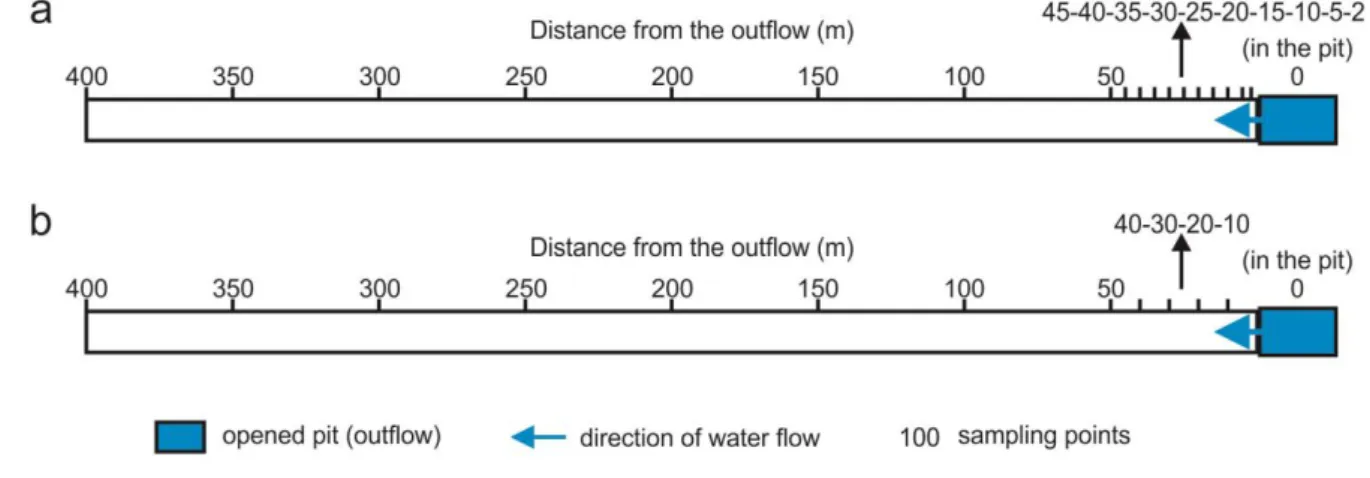
trace elements, activity of 226Ra and 222Rn). The location of the March sampling points may 207
be seen in Figure 4a. The sampling density was more frequent over the first 50 m based on the 208
literature, i.e. the physicochemical parameters of the thermal water change fast close to the 209
outflow. Temperature, specific electric conductivity, pH, dissolved oxygen content, 210
concentration of HCO3- and water discharge were recorded on site. Furthermore, samples 211
were collected for laboratory measurement of major ion analysis (Ca2+, Mg2+, Na+, K+, Cl-, 212
CO32-, SO42-) from the pit and at distances of 50 and 400 metres in order to obtain a general 213
overview of the changes in ion concentrations. As calcite is the main evolving precipitate in 214
the area, only Ca2+ and HCO3- were measured on site at every sampling point.
215
In the course of the second experimental session, the location of sampling points (Fig. 4b) was 216
modified based on the results of the first one. The number of measured parameters was also 217
increased. Besides the parameters measured earlier, samples were also collected for the 218
laboratory measurement of 226Ra and 222Rn from all sampling points and for the analysis of 219
trace elements from the pit. As water temperature is the parameter most sensitive to the 220
variations of air conditions, air temperature was also monitored during the second sampling 221
session to understand the effects of the heating pipes and the ventilation ducts.
222
13 223
Fig. 4 Sampling points of the in situ experiment along the flow path on (a) 23rd March and (b) 224
22nd April 2016 225
3.3 Applied methods 226
The applied methods, the accuracy/detection limit of the measurements and the laboratories 227
are summarized in Table 1. The major ions were determined with the usual analytical 228
laboratory techniques, following standard methods (Eaton et al., 2005). For these 229
measurements, samples were collected in 1.5 l PET bottles with no free head space and were 230
kept cool until the analysis (within 1–2 days).
231
To determine 222Rn activity, 10 ml samples were injected into glass vials containing 10 ml 232
Optifluor-O cocktail at the site. The cap of the vial was additionally wrapped with parafilm.
233
The activity was determined within 24 hours because of the short half-life of the isotope (3.82 234
days).
235
For 226Ra sampling, 0.25 l PET bottles were used. The radionuclides were measured using 236
Nucfilm discs (Surbeck, 2000). The samples were kept cool between the sampling and the 237
measurements (within 3–4 weeks).
238
Table 1 Summary of the measured parameters, methods, accuracies/detection limits and 239
laboratories 240
14
Parameter Method Accuracy/detection limit Laboratory
Temperature, specific electric conductivity, pH, dissolved oxygen
HQ40d Multi-Parameter Meter
±2 % for specific electric conductivity
On site
±0.01 for pH
±0.1 mg/l for dissolved oxygen
Ca2+ EDTA titrimetric method
(ASTM 3500-Ca D) ±2 % On site
HCO3- alkalinity titration (ASTM
2320 B) ±2 % On site
Na+, K+
Flame emission
photometry (ASTM 3500- Na D, ASTM 3500-K D)
±2 % Department of Physical
Geography, ELTE*
Mg2+ EDTA titrimetric method
(ASTM 3500-Mg E) ±2 % Department of
Microbiology, ELTE*
Cl- Argentometric titrimetry
(ASTM 4500-Cl--B) ±2 % Department of
Microbiology, ELTE*
SO42- Turbidimetric method
(ASTM 4500-SO42--E) ±5 % Department of
Microbiology, ELTE*
222Rn
Liquid scintillation
method min. 3 Bq/l Department of Atomic
Physics, ELTE* TRICARB 1000 TR
226Ra Alpha spectrometry
(Surbeck, 2000) min. 10 mBq/l
Imre Müller and Heinz Surbeck Hydrogeology Laboratory of the Department of Physical and Applied Geology, ELTE*
Trace elements
ICP-MS (Element2, ThermoFinnigan, Bremen, Germany)
Department of Analytical
Chemistry, ELTE*
Air temperature Voltcraft DL-120TH ±1 °C On site
* Eötvös Loránd University
241
On the second occasion, samples of trace elements for analysis were collected in 15 ml 242
polypropylene tubes. At each sampling point, both an unfiltered and a 0.2 µm filtered sample 243
were taken, in order to determine the distribution of the trace elements between the dissolved 244
and suspended matter. The samples were acidified with HNO3 on site to ensure a pH of <1.
245
15
After adding 10 µg/l indium internal standard, the analysis was carried out with the use of 246
inductively coupled plasma-mass spectrometry (ICP-MS). Quantification was performed 247
following the external calibration method.
248
Water discharge was measured by scaling at the outflow of thermal water. Along the flow 249
path of the canal, discharge was calculated from flow velocities determined by surface 250
floating method and trapezoid sections of the canal.
251
Air temperature was measured about 20 centimetres above the bottom of the tunnel.
252
To support the interpretation of the concentration patterns measured in March and April, 253
reactive transport modelling was conducted using the PHREEQC code (Parkhurst and 254
Appelo, 2013). The reactions considered were similar to those in the work of Keppel et al.
255
(2012) in their study of spring outflow into a wetland, i.e. gas exchange between the water 256
and atmosphere and calcite precipitation. In the present study, the degassing of CO2 and 222Rn 257
and the ingassing of O2 were modelled using the rate expression, Eq. (1):
258
) (m meq k
r (1)
259
where r is the rate of gas transfer between the water and the air in the tunnel (M/s, where M is 260
molality), k is the gas exchange rate constant (1/s), m is the concentration of the gas (M), and 261
meq is the concentration of the gas in equilibrium with the water at the prevailing temperature 262
(M). The latter value is calculated using PHREEQC. Calcite precipitation was modelled using 263
the kinetic rate equation developed by Plummer et al. (1978). This rate expression is 264
implemented in the standard database of PHREEQC (phreeqc.dat) used in this study. The gas 265
exchange rate constant k depends on several factors, including turbulent dissipation at the air- 266
water interface, water depth, flow velocity, the kinematic viscosity of the water, and the 267
diffusion rate of the gas (Raymond et al., 2012). While theoretical relationships are available 268
16
to calculate k, poor agreement has been reported between these and values of k measured in 269
tracer injection experiments (Genereux & Hamond, 1992). In the present study, the value of k 270
was therefore optimized by fitting the model to the measured concentrations.
271
The morphology of the evolved precipitates was examined by scanning electron microscopy 272
(SEM). The samples were filtered onto 0.2 µm polycarbonate filter (Millipore) fixed in 273
glutaraldehyde (5 % in 0.1 M phosphate buffer) for 4–5 hours at room temperature. The fixed 274
samples were rinsed twice with phosphate buffer solution (pH 7), shock frozen in liquid 275
nitrogen and freeze-dried (until 2 x 10⁻² mbar, at -60 °C for 6–8 h). After lyophilization, the 276
dried samples were mounted on metal stubs, and sputter-coated with gold. The samples were 277
examined using an EVO MA 10 Zeiss scanning electron microscope at an accelerating 278
voltage of 10 kV.
279
The mineral composition of the crystalline precipitates was investigated by X-ray powder 280
diffractometer (XRD), using a Siemens D5000 type device (Bragg-Brentano setup, Cu 281
radiation).
282
4. Results of the in situ experiment 283
4.1 Field parameters and major ions 284
Water temperature decreased overall from 36 to 32.6 °C in the first session, and from 36.9 to 285
31.5 °C in the second. In the first occasion, the temperature dropped from 36 °C to 30.8 °C 286
over the 200m, and then increased to 32.6 °C. In the second session, the water temperature 287
dropped (36.9–33.2 °C) over the first 150m, then increased (33.2–34.2 °C) by 250m, and 288
decreased again (34.2–31.5 °C) (Fig. 5).
289
17
The air temperature ranged from 35 to 37 °C (Fig. 5). 50m from the pit it increased, then it 290
became stable, decreasing after 300 m.
291
The change in pH was very sharp. The thermal water in the pit was slightly acidic (6.84; 6.79) 292
and it changed to alkaline (8.05; 8.42) between the two ends. In the March sampling session, 293
pH increased rapidly, 6.84 to 7.84, between the pit and the 25m point. Between 25 and 50 m, 294
it was stable at around 7.8. Then it increased slightly to 8.22 and finally dropped to 8.05 at the 295
end of the canal. In April, pH increased abruptly from 6.79 to 8.23 between the pit and the 296
80m point. After 80m, it barely changed (Fig. 5).
297
Dissolved oxygen increased along the flow path on both occasions. In the first case, it was 1.7 298
mg/l at the pit and 7.3 mg/l at 400m. It changed rapidly between the pit and 100m, then at a 299
lower rate. On the second occasion, it changed from 0.9 mg/l to 7.5 mg/l, with an abrupt rise 300
between the pit and the 100m point (Fig. 5).
301
Specific electric conductivity decreased from 2059 µS/cm to 1666 µS/cm in March and from 302
2011 µS/cm to 1732 µS/cm in April. In both sampling sessions the greater part of the drop in 303
specific electric conductivity took place over the first 100 m (Fig. 5).
304
18 305
Fig. 5 Variations in the field parameters along the flow path for the two occasions (error of 306
measurements: DO: ±0.1 mg/l, EC: ±2 %, pH: ±0.01, T: ±1 °C) 307
At the outflow of the thermal water, the volume discharge was an average of 1.8*10-4 m3/s in 308
March and 1.2*10-4 m3/s in April. The measured volume discharge was 2.14*10-4 m3/s in the 309
canal in March and fell between 3.57*10-5 and 3.61*10-4 m3/s in April.
310
19
The concentration of HCO3- and Ca2+ decreased along the whole flow path from 531 to 295 311
mg/l and from 173 to 101 mg/l, respectively in March. In April, the concentration of HCO3-
312
and Ca2+ decreased from 554 to 331 and from 170 to 98 mg/l, respectively (Fig. 6). The 313
concentrations of the other major ions did not change significantly along the flow path (Cl- 314
(147–153 mg/l), Mg2+ (58–58 mg/l), Na+ (119–128 mg/l) and K+ (17–19 mg/l)) according to 315
the widely-spaced measurements (at 0, 50 and 400 m) (Table 2).
316
317
Fig. 6 Variations in the concentrations of Ca2+ and HCO3- along the flow path (error of 318
measurements for both ions: 2 %) 319
Table 2 Concentrations of the major ions at 0, 50 and 400m in April (error of measurements:
320
2 %, for SO42-: 5 %) 321
Distance from the outflow
(m)
SO42-
(mg/l)
Cl- (mg/l)
Ca2+
(mg/l)
Mg2+
(mg/l)
Na+ (mg/l)
K+ (mg/l)
0 353 147 173 58 119 17
20
50 295 147 158 58 121 17
400 336 153 101 58 128 19
322
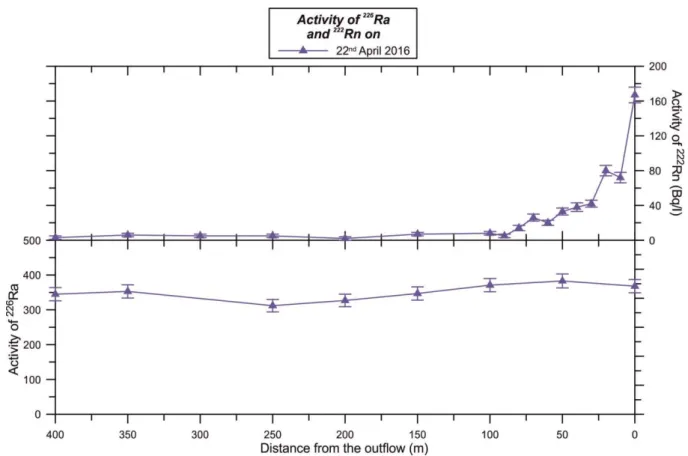
4.2 226Ra and 222Rn activity 323
The concentration of 226Ra in the water (mean value: 351 mBq/l) remained the same along the 324
flow path within the error of analysis (Fig. 7).
325
The 222Rn activity decreased from 167±9 Bq/l to 3±2 Bq/l (between the pit and the 400-metre 326
point) with an increase at 20m in April. It dropped to the level of the background radiation (2–
327
3 Bq/l) at 100 m (Fig. 7).
328
329
Fig. 7 Variations in the activity of 226Ra and 222Rn along the flow path 330
4.3 Trace elements 331
The concentration of trace elements in the original (unfiltered) samples and in the suspended 332
solid (=unfiltered-filtered) are depicted in Fig. 8. Be, Bi, Cd, Cr, Hg, Mo, Pb, Sb, Sn, Te, Th, 333
21
Tl, U, V and Y were present at the lowest concentration in both the unfiltered samples and in 334
the suspension, between 0 and 0.5 µg/l (Fig. 8a). Bi, Cr and Th were below the detection 335
threshold in the filtered samples. The concentrations of Al, As, Cu, P, Sc, Se, Ti and Zn fell 336
within the range of 1 to 12 µg/l (Fig. 8b), while Ba, B, Br, Cs, Fe, I, Li, Mn and Rb were 337
between 10 and 620 µg/l (Fig. 8c). The concentration of S and Si were the highest (4000–
338
55000 µg/l) in both the unfiltered samples and in the suspension (Fig. 8d).
339
In the case of many elements (Be, Bi, Cd, Cr, Pb, Th, Tl, V, Y, Al, Cu, Se, Ti, Zn, Fe, Mn) 340
the concentration in the suspension is close to the total concentration. Other elements like Mo, 341
U, As, P, B, Li, S are represented in relatively less abundance in the suspended solid (Fig. 8).
342
343
22
Fig. 8 Trace element concentrations in unfiltered water and in the suspended solid of the pit in 344
the range of (a) 0–0.5, (b) 1–12, (c) 10–620, (d) 4000–55000 µg/l 345
4.4 Simulated SIcalcite and pCO2 and reactive transport modelling 346
The saturation index with respect to calcite was modelled using the measured concentrations 347
and parameters. The indices were positive along the whole flow path. The indices increased 348
over the first 80m (0.4–1.55), then the values were almost the same between 80 and 150m 349
(around 1.55), and decreased from 1.55 to 1.35 in the next 50m (150–200m), then remained 350
around 1.35 (Fig. 9).
351
The partial pressure of CO2 (pCO2) changed in the opposite direction to SIcalcite. It steeply 352
decreased in the first 100m, then, increased slightly in the next 100m (100–200m), and 353
slightly decreased between 200 and 400m (Fig. 9).
354
355
Fig. 9 Modelled variations in SIcalcite and pCO2 along the flow path 356
The reactive transport model was fitted to the measured data using a model optimisation 357
software, PEST (Watermark Numerical Computing, 2016), by adjusting the gas exchange rate 358
constants for CO2, O2 and 222Rn (kCO2, kO2, kRn) and the surface area over volume parameter 359
(A/V) in the rate expression of calcite. While kO2 and kRn could be fitted to the data 360
independently, it was found during trial runs that the value of kCO2 correlated to the value of 361
23
A/V in the expression of the rate for calcite precipitation. It was found that because of this 362
dependence, a better fit of the measured pH values, which are very sensitive to the value of 363
kCO2, could only be obtained at the expense of a worse fit of the Ca2+ and HCO3-
364
concentrations.
365
Flow and solute transport were modelled using the following form of the advection-dispersion 366
equation, Eq. (2):
367
dx r D m dx v m t m
L
2 2
368 (2)
Where m is the aqueous concentration (M), t is time (s), v is the water flow velocity (m/s), x is 369
the distance from the outflowing (m), and DL is the hydrodynamic dispersion coefficient, 370
which is defined as DL = αLv + De (m2/s), where αL is the dispersivity (m) and De is the 371
diffusion coefficient (m2/s).
372
The value of v was derived from the discharge rates measured in the course of the experiment.
373
For De a value of 5×10⁻⁹ m/s2 was assumed, and αL was set to 0.05 m. No further optimization 374
of these parameters was attempted, as a good fit between the modelled and measured 222Rn 375
could be obtained with these chosen values (Fig. 10). Since 222Rn is chemically inert, this was 376
considered to be confirmation of the model’s ability to simulate the flow and mixing 377
processes within the canal.
378
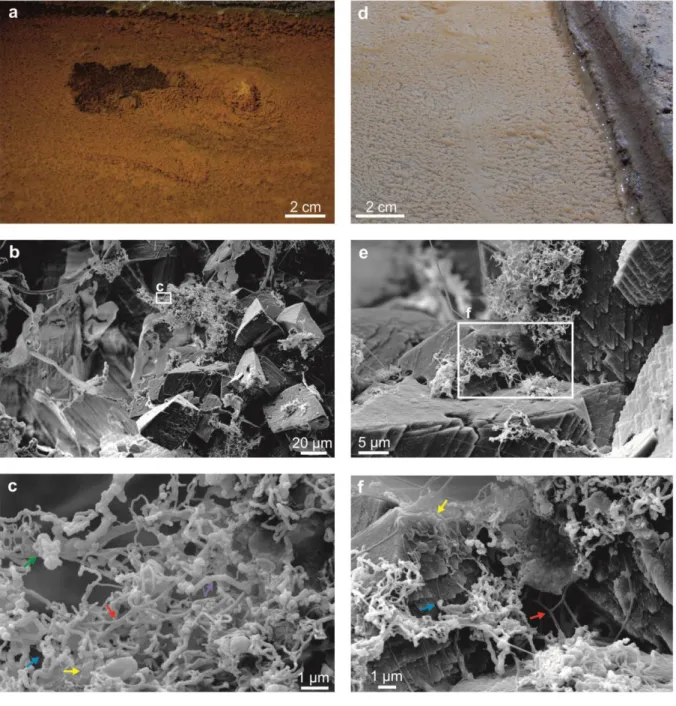
4.5 Observation of evolved precipitates 379
Due to six weeks of thermal water flowing, reddish-brown, amorphous precipitate formed 380
close to the outflow, and up to distance of 15 m from it (Fig. 10a). Low magnification SEM 381
images showed extended bacterial colonization, with some minerals in the first 15m-long 382
section (Fig. 10b). The high-resolution SEM images reflected the networked structures and 383
morphological variability of the biofilm-forming bacterial cells. Different sized and shaped 384
24
filamentous bacteria in interwoven form (red arrow), numerous straight (yellow arrow) and 385
curved rod-shaped (blue arrow), aggregate-forming cells of varied sizes (green arrow) were 386
visible in the photos. The rod-shaped cells form long chains (purple arrow) (Fig. 10c).
387
Downstream, a beige, crystalline precipitate evolved along to the end of the studied section 388
(Fig. 10d). Calcite crystals (also revealed by XRD) dominate this precipitate with serrated 389
mineral surfaces. In the low magnification SEM images, patches of bacterial colonization can 390
be seen (Fig. 10e). The morphology of bacteria of these colonizations is the same as in the 391
biofilms of the first 15 m (Fig. 10f).
392
25 393
Fig. 10 The reddish-brown, amorphous precipitate at 8 m (a) on site, (b) (c) in SEM images;
394
crystalline precipitate at 40 m (d) on site, (e) (f) in SEM images 395
5. Interpretation and discussion 396
Thermal springs are discharge features of regional groundwater flow systems and are 397
characterized by a near constant volume discharge and relatively invariant physicochemical 398
parameters at the outflow as long as the hydrogeological environment is stable (for hundreds 399
or thousands of years) (Goldscheider et al., 2010; Mádl-Szőnyi and Tóth, 2015). The natural 400
26
thermal water discharge can be simulated by invariable pumping from a well. Though the 401
initial discharge is stable, volume discharge could change along the flow path due to the 402
roughness and route of the bed, even in regular channels, like that in the experiment.
403
5.1 Physicochemical parameter changes along the flow path 404
The air temperature of the tunnel is affected by ventilation, but this fact does not necessarily 405
influence the temperature of the water inside the tunnel if the temperature of the water and the 406
air are similar, as was the case in the present study. This supposition was then confirmed by 407
the absence of significant correlation (-0.27) (Table 3).
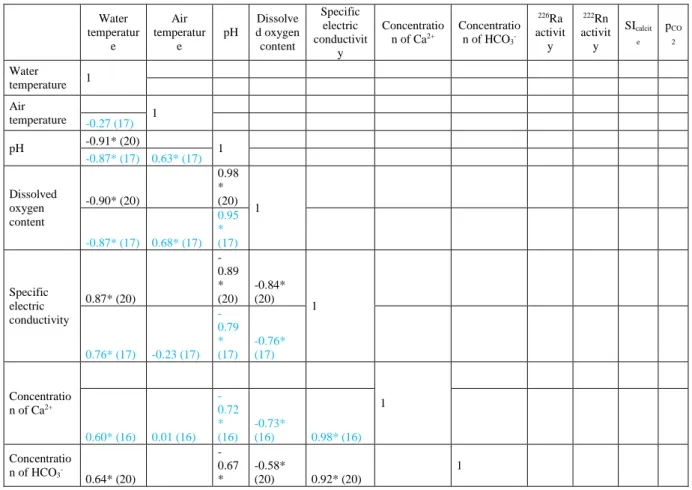
408
Table 3 Correlation matrix (Pearson correlation) for the measured parameters in March 409
(black) and April (blue) (n/a invalid values because the measured parameters are used for the 410
calculation of the modelled ones; * correlation is significant at the 0.05 level (two-tailed); (20) 411
number of data pairs) 412
Water temperatur
e
Air temperatur
e
pH
Dissolve d oxygen
content
Specific electric conductivit
y
Concentratio n of Ca2+
Concentratio n of HCO3-
226Ra activit y
222Rn activit y
SIcalcit e
pCO 2
Water
temperature 1
Air temperature
1
-0.27 (17)
pH -0.91* (20)
1
-0.87* (17) 0.63* (17)
Dissolved oxygen content
-0.90* (20)
0.98
* (20)
1
-0.87* (17) 0.68* (17) 0.95
*
(17)
Specific electric conductivity
0.87* (20)
- 0.89
* (20)
-0.84*
(20)
1
0.76* (17) -0.23 (17) - 0.79
* (17)
-0.76*
(17)
Concentratio n of Ca2+
1
0.60* (16) 0.01 (16) - 0.72
* (16)
-0.73*
(16) 0.98* (16)
Concentratio n of HCO3-
0.64* (20)
- 0.67
*
-0.58*
(20) 0.92* (20)
1
27
(20)
0.50* (17) -0.19 (17) - 0.66
* (17)
-0.56*
(17) 0.90* (17) 0.99* (16)
226Ra activity
1
0.19 (8) -0.35 (8) -0.41
(8) -0.40 (8) 0.46 (8) 0.52 (7) 0.70 (8)
222Rn activity
1
0.86* (17) -0.69* (17) - 0.96
* (17)
-0.99*
(17) 0.75* (17) 0.68* (16) 0.56* (17) 0.41
(8)
SIcalcite n/a
n/a
n/a n/a
1 0.72* (17)
0.92*
(17) -0.57* (17)
-0.28 (8)
-0.94*
(17)
pCO2 n/a
n/a
1 -0.58* (17)
-0.94*
(17) 0.85* (17) 0.80* (16) 0.74* (17) 0.46 (8)
0.94*
(17) - 0.90*
(17) n/a invalid
values because the measured parameters are used for the
calculation of the modelled ones
* correlation is significant at the 0.05 level (2- tailed) () number of data pairs
413
The abrupt pressure drop at the outflow results in rapid, intensive CO2 degassing and a 414
concomitant sharp rise in pH values close to the outflow, with less intensive degassing as the 415
volume of CO2 in the water decreases.
416
The strong significant negative correlation (-0.94) (Table 3) demonstrates the converse nature 417
of the change in dissolved oxygen content from pCO2, as O2 originating in the air of the tunnel 418
dissolves into the water. After reaching saturation point, the dissolved oxygen content remains 419
stable (Fig. 5).
420
Given the increase in the pH of the water, supersaturation and the precipitation of CaCO3 are 421
to be expected, and this assumption gains support from the increase of SIcalcite (Fig. 9), the 422
decrease in specific electric conductivity (Fig. 5) and the decrease in the concentration of the 423
28
two major ions, Ca2+ and HCO3- (Fig. 6). The significant correlation coefficients of 0.98 and 424
0.90–0.92 obtained between the specific electric conductivity and the concentrations of Ca2+
425
and HCO3-, respectively, confirm that the decrease in these two ions causes the drop in 426
specific electric conductivity. The concentration of Ca2+ and HCO3- displayed a continual 427
decrease along the flow path.
428
From the relatively spaced-out measurements, it seems that the concentration of other major 429
ions (Mg2+, Na+, K+, Cl-) remains relatively constant along the flow path (Table 1); this is 430
related to the fact that they do not take part in precipitation processes. Though Mg-calcite has 431
been determined as the main mineral phase of the carbonates in the spring caves of the BTK 432
(Erőss, 2010), along the flow path a decrease in Mg2+ in the water was not detectable.
433
5.2 Radionuclides and trace elements in the water 434
The concentration of 226Ra remains stable (Fig. 8a) in the canal, displaying no significant 435
correlation with any of the parameters (Table 3). 222Rn is the decay product of 226Ra, and it 436
degasses rapidly from water, since there is no additional supply along the flow path. The 437
222Rn activity displays a strong significant correlation with pCO2 (0.94) and a strong significant 438
negative correlation with pH (-0.96) and dissolved oxygen content (-0.99) (Table 3). The 439
strong correlation with pCO2 demonstrates that 222Rn degasses in a way similar to CO2, as it is 440
also a dissolved gas: its concentration dropped to the level of the background radiation within 441
the first 100 m (Fig. 7). The high surface-to-volume-ratio of the water flowing in the canal 442
also promotes the processes of degassing and ingassing.
443
Erőss (2010) found that Ca, together with smaller amounts of Si, Mg, Fe and Al, was a main 444
element in the build-up of biofilms in the spring caves in Gellért Hill. In a comprehensive 445
study of the water in spring caves of BTK, S and Sr were found to have the highest 446
concentrations (10–34.5 and 0.705–3.1 µg/l, respectively) among the trace elements (Dobosy 447
29
et al., 2016). In agreement with these findings, in this study S and Si were the main trace 448
elements both in the water and in the suspended solid (Fig. 8d). Al, Be, Cd, Cr, Cu, Fe, Mn, 449
Pb, Ti and Zn prefer the suspension form in the pit (Fig. 8). These elements were found to be 450
in high concentrations in precipitates in the BTK (Dobosy et al., 2016; Erőss, 2010). This 451
observation can be explained by the hydrolysis of the metal ions and their subsequent 452
precipitation as hydroxides. Except for Li, these elements are abundant in the dissolved phase 453
form of soluble oxoions (e.g. UO22+, PO43-, etc.). Thus, the distribution of the trace elements 454
between dissolved and suspended matter can be accounted for.
455
5.3 Comparison of the measured and modelled variations of the parameters 456
The simulated values for dissolved oxygen and 222Rn activity derived from the reactive 457
transport model are in good agreement with the measured values for both the March and April 458
experiments (Fig. 11). The pH values and HCO3- concentrations, on the other hand, do not 459
match those of the model to such a degree. The March and April data show little change in the 460
measured HCO3- concentration over the first 50m of the canal, whereas in the model, HCO3-
461
concentrations decrease almost immediately. For Ca2+, the opposite appears to be the case: the 462
measured concentrations show an almost linear decrease starting immediately, albeit there is a 463
wide scatter of the data points in April, while the modelled Ca2+ decrease along the canal 464
seems to be slow initially, becoming progressively faster further downstream. The model 465
consistently underestimates pH. Obtaining a better fit of the pH by using a faster CO2
466
degassing rate only worsened the fit for Ca2+. Finally, from the measurements it appears that 467
the decrease in HCO3- stabilises after 300–350 m, and this is more clearly apparent in the 468
April data. While the model similarly predicts a lower rate of decrease with downstream 469
distance, the change in the simulated concentration-versus-distance curve is much more 470
gradual, and not as pronounced as for the measured concentrations (Fig. 11).
471
30 472
Fig. 11 The measured and modelled variations of pH, dissolved oxygen, 222Rn activity, and 473
Ca2+ and HCO3- concentrations along the flow path 474
5.4 Indirect and direct indications and evidences for biological and carbonate 475
precipitation 476
According to Eq. (3) one mole of Ca2+ reacts with two equivalent alkalinity (indicated as 477
HCO3-), so the stoichiometric ratio of Ca:alkalinity is 1:2 (Eq. (3)). The blue line in Fig. 12.
478
shows this ratio.
479
2HCO3-+Ca2+→CaCO3+2H+ (3)
480
The variations in the concentrations of the two major ions show that the ratio changes in the 481
way described by Eq. (3) until 150 m from the outflow. After 150 m, less HCO3- or more Ca2+
482
leaves the water (Fig. 12.), what is consumed in calcite precipitation.
483
31 484
Fig. 12 Changes in Ca2+ and HCO3- along the flow path 485
The variations in the concentrations of major ions and specific electric conductivity, the 486
measured Ca:alkalinity ratio and the simulations refer to continuous calcium carbonate 487
precipitation along the flow path. The stoichiometric ratio of Ca:alkalinity of the measured 488
major ions and the reactive transport model shows adverse HCO3- concentration compared to 489
the equation and simulated values. It suggests that after 150 m from the outflow, beside 490
CaCO3 precipitation, the simulated gas exchange, namely CO2 degassing decreases the 491
dissolved HCO3- concentration. However, another process is supposed to further reduce it. A 492
possible explanation is the roughness/shallowing of the canal bed (Hammer et al., 2008).
493
The afore-mentioned changes of physicochemical parameters are the results of the one-day- 494
long experiments, when thermal water was pumped into the canal, where no precipitates were 495
to be found. Though there are indications of CaCO3 precipitation, carbonates could not be 496
observed in the canal after one day. Bacteria arriving with the thermal water also could not 497
form any biofilm during the limited duration of the experiment. Consequently, the effects of 498
the precipitates could not be examined in this part of the study.
499
The increase in pH and the decrease in the concentration of Ca2+ and HCO3- can be observed 500
along the flow path in travertine-depositing streams and springs (Amundson and Kelly, 1988;
501