Allometric Relationships for Estimation of Above-Ground Biomass in Young Turkey Oak ( Quercus cerris L.) Stands
in Albania
Erion I
STREFIa*–Elvin T
OROMANIb– Nehat Ç
OLLAKUba Ministry of Tourism and Environment, Environmental Services Project, Tirana, Albania
bFaculty of Forestry Sciences, Agricultural University of Tirana, Tirana, Albania
Abstract– The study objective was the determination of allometric relationships to estimate aboveground biomass in young Q. cerrisstands growing in various sites in Albania. The equations described here are developed for Q. cerrisforest stands managed as coppice. The total aboveground biomass of sampled trees varied from 10.67 to 19.71 kg with a stem diameter at 1.3 m (DBH) from 7.65 to 9.7 cm, and height from 5.26 to 7.6 m. Stem biomass comprised, on average, 69.6 %, while branch biomass was 24.3 %, and leaf biomass,6% on the total aboveground biomass of the sampled oak trees. Total aboveground biomass was predicted with the highest accuracy from linear and non-linear regression equations. Total aboveground biomass and the biomass of tree compartments were predicted with a notable accuracy from DBH where the allometric model efficiency exceeded 93%. Biomass expansion factors (BEFs) showed a stronger dependency on diameter at breast height and a weaker relationship with age. The age-dependence relationship found in our study was closely related to site productivity. The variability in aboveground biomass among sampled sites indicated that local site conditions cause this difference. These new equations for Q.cerrismight be applicable in the framework of the Albanian National Forest Inventory for estimation of carbon accounting from forest ecosystems and will contribute to the sustainable management of oak forests.
Quercus cerris/ allometric equation / BEFs / tree biomass
Kivonat – Albániai fiatal csertölgy (Quercus cerrisL.) faállományok föld feletti biomasszájának meghatározása allometrikus módszerekkel. $OEiQLDNO|QE|]ĘWHUOHWHLQYpJUHKDMWRWWYL]VJiODWDLQN során olyan allometrikus kapcsolatokat határoztunk meg fiatal, sarj HUHGHWĦ FVHUHV Q. cerris) faállományokra, melyek segítségével azok föld feletti biomasszáját lehet megbecsülni. A megmin- tázott faegyedek föld feletti biomasszája 10,67–NJN|]|WWYiOWR]RWWPtJDPHOOPDJDVViJLiWPpUĘ 7,65–9,70 cm, a magasság pedig 5,26–PN|]|WWYROW$WHOMHVELRPDVV]DPHQQ\LVpJHDN|YHWNH]Ę UpV]HNEĘOWHYĘG|WW|VV]HW|U]ViJDNOHYHOHN$I|OGIHOHWWLELRPDVV]DPHQQ\LVpJpUH a legpontosabb becslést a lineáris és a nemlineáris regressziós egyenletek adták. A teljes föld feletti ELRPDVV]iWLOOHWYHD]HJ\HVIDUpV]HNH]HQEHOOLDUiQ\iWMHOHQWĘVSRQWRVViJJDOPHJOHKHWHWWKDWiUR]QLD PHOOPDJDVViJLiWPpUĘEĘODKROD]DOORPHWULNXVPRGHOOSRntossága meghaladta a 93%-ot. A biomassza iWV]iPtWyWpQ\H]ĘN%()HUĘVHEEHQIJJWHNDPHOOPDJDVViJLiWPpUĘWĘOPLQWDNRUWyO$]HOHP]pVHN során megállapított életkor-IJJĘVpJ V]RURV NDSFVRODWRW PXWDWRWW D] DGRWW WHUPĘKHO\ WHUPĘ- képességével. A mintákban tapasztalt eredmények változatossága arra utal, hogy a föld feletti biomassza menQ\LVpJpEHQWDSDV]WDOWHOWpUpVHNDKHO\V]tQHN N|]|WWLNO|QEVpJHNUHYH]HWKHWĘNYLVV]D A csertölgyre kidolgozott új egyenletek alkalmazhatók az Albán Nemzeti Erdészeti Felmérés keretében, az erdei ökoszisztémák szén-dioxid-elszámolásának becslése során, illetve hozzájárulnak az RWWDQLW|OJ\HUGĘNIHQQWDUWKDWyNH]HOpVpKH].
Quercus cerris/ allelometrikus kapcsolatok / BEF / fás biomassza
*Corresponding author: erion.istrefi@yahoo.com; AL-1001, Blv. Zhan D'Ark No. 23, Tirana, Albania
1 INTRODUCTION
Interest in estimating forest biomass for practical and scientific purposes is currently increasing. There are different approaches to calculate biomass and carbon stocks in forests, with most based on forest inventory information as well as on biomass equations, which transform diameter, height or volume data into biomass estimates (Somogyi et al. 2006).
Biomass calculations can be obtained by direct and indirect methods. The direct method involves destructive biomass weighing, whereas in the indirect method, regression modelling is used to estimate biomass and carbon stocks from more easily measured tree and stand variables such as diameter at breast height (DBH), tree height (H) and tree age (A). Tree-level variables facilitate the development of biomass equations that are applicable to a wider range of sites and stands and can be used to examine the effects of various factors on stand growth and biomass stocking. The ability of allometric equations to predict aboveground biomass and carbon stocking is not only a matter of statistical tools. The errors made throughout the process of formulating these equations – from the fieldwork and modelling to biomass prediction – should be considered (Picard et al. 2012).
Chave et al. (2005) and Brown et al. (1989) pointed out that errors are caused by various sources such as tree measurement, plot sampling, insufficient number of big trees sampled, diameter intervals, selection of average sample trees in each diameter class, and application of unsuitable models. In addition, accuracy and reliability of biomass models should be assessed not only for individual trees, but also for forest stands taking into account the distribution of trees by diameter classes (Ketterings et al. 2001).
In Albania, information on aboveground biomass and carbon stocking is scarce and relevant estimation methods are not very well known. In contrast, information regarding biomass estimation is more plentiful in other Mediterranean countries. From the review of the studies conducted in Albania, we found one study that provides data on biomass and carbon stocking at national level (Agrotec 2004) and two other studies focused on aboveground biomass estimation for some species growing in natural (Omuri 2006) and artificial stands (Toromani et al. 2011). The first study regarding biomass estimation at the country level was conducted in the framework of National Forest Inventory (Agrotec 2004).Biomass was calculated from the inventoried stand volume per hectare where this value was expanded into aboveground components using biomass expansion factor (BEFs). Due to the lack of information on specific BEFs for Albanian forests, data from other studies was used (Louitat et al. 2000, Lowe et al. 2000, Schulze 2000). Omuri (2006) executed the second research study on forest biomass and BEFs and developed several models to estimate biomass. He determined the BEFs for Austrian pine (P. nigra Arn.), Beech (F. sylvatica L.) and Birch (B. pendulaL.) and pointed out that BEFs values vary due to species and age. Thus, in the case of birch, the BEF was 2.1 for the 10 to 20-year age range, 1.4 for Austrian pine in the 20 to 30-year age range and, and 2.3 for beech in 10 to 20-year age range. The third study was conducted by Toromani et al. (2011) in some poplar plantations situated in eastern and central Albania where several allometric equations using tree variables (DBH; squared DBH; H; A) as predictors were developed.
Despite the limited number of published equations, many other forest species growing in Albania are not well represented. Turkey oak (Quercus cerrisL.) is one of the species lacking biomass-related information. Undoubtedly one of Albania’s most important forest species, covering more than 30.8% of the total forest area, Turkey oak grows in Haplic and Chromic Luvisol soil here, in a typical, hilly, Mediterranean climate with a considerable summer drought period (FAO2015). The species is widely distributed all over Albania, from hilly lands along the coastal area to the interior of country. Q. cerris is a significant firewood source and is also a fundamental fodder source for wildlife and livestock (mostly sheep and
goats). The species also provides habitat for small game species such as Brown hare (Lepus europaeusPallas.), Common blackbird (Turdus merulaL.), and Grey partridge (Perdix perdix Brisson.). No information on the aboveground biomass for Albanian Q. cerris forest stands exists, but other Mediterranean countries possess abundant data. Therefore, the aims of this study were: (1) to estimate aboveground biomass of investigated stands, (2) to define the appropriate allometric models for estimation of aboveground biomass using tree variables, and (3) to estimate biomass expansion factors (BEFs) and their dependency. The present study will contribute quantitative data to the current, generally scarce knowledge of this species.
2 MATERIALS AND METHODS 2.1 Study sites
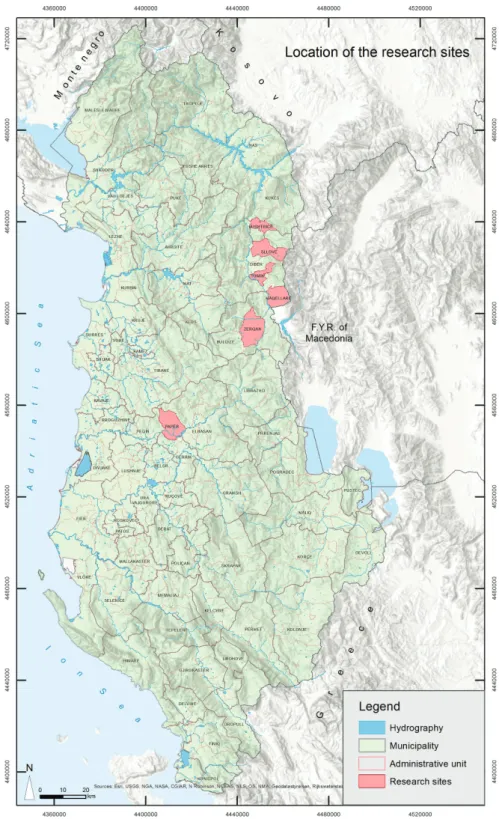
Data used in this study came from measurements carried out in fiveQuercus cerris L. forest stands growing across the country from northeast to central Albania (Figure 1).
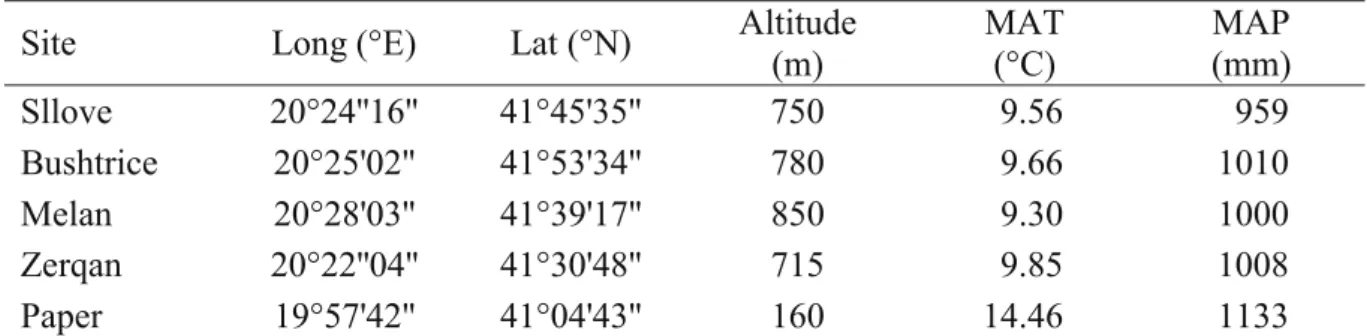
Instrumental climate records are temporally limited in the studied areas; therefore, the updated CRU TS 3.22 0.5°×0.5°- gridded monthly temperature and precipitation data sets were used (Harris et al. 2014). The climate data in the Table 1, were estimated from the database extracted for the region encompassed by the coordinates 40°25’–42°25’N and 19°25’–20°75’E. The Q.cerrisstands grow under the influence of hilly Mediterranean climate with an average annual temperature from 9.30 °C to 14.46 °C and an annual rainfall ranging from 959 to 1133 mm (Table 1). The rainfall is unevenly distributed and the biggest amount falls during the autumn (253 mm) and winter (245 mm). The minimum temperature ranges from –1 to 6.2 °C, while the maximum values vary between 23.7 °C to 30 °C.
Table 1. Site description including location, longitude (long), latitude (lat), altitude above sea level, mean annual temperature (MAT) and mean annual precipitation (MAP) .
Site Long (°E) Lat (°N) Altitude
(m)
MAT (°C)
MAP (mm)
Sllove 20°24''16'' 41°45'35'' 750 9.56 959
Bushtrice 20°25'02'' 41°53'34'' 780 9.66 1010
Melan 20°28'03'' 41°39'17'' 850 9.30 1000
Zerqan 20°22''04'' 41°30'48'' 715 9.85 1008
Paper 19°57'42'' 41°04'43'' 160 14.46 1133
The oak forest stands grow on moderately deep soils formed during the long-term alteration of the clay bedrocks.
Figure 1. Location of the research sites
2.2 Field data
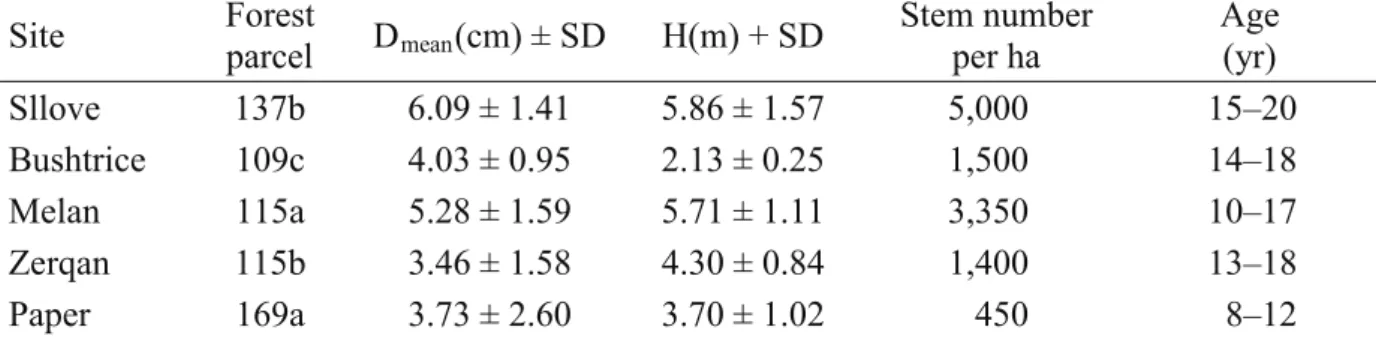
In each sampled site, five circular sample plots with an area of 200 m2(r = 7.98 m) were used to investigate each forest stand (Table 2). In total, 1170 trees were measured inside sample plots. The main tree characteristics measured were diameter at breast height (DBH) with a calliper at 1.3 m from the ground, and tree height (H) with a Vertex 4.
Table 2. Dendrometric characteristics of the studied Q. cerris forest stands
Site Forest
parcel Dmean(cm) ± SD H(m) + SD Stem number per ha
Age (yr)
Sllove 137b 6.09 ± 1.41 5.86 ± 1.57 5,000 15–20
Bushtrice 109c 4.03 ± 0.95 2.13 ± 0.25 1,500 14–18
Melan 115a 5.28 ± 1.59 5.71 ± 1.11 3,350 10–17
Zerqan 115b 3.46 ± 1.58 4.30 ± 0.84 1,400 13–18
Paper 169a 3.73 ± 2.60 3.70 ± 1.02 450 8–12
SD-standard deviation
A subsample of 50 trees was chosen for biomass estimation. The sampled trees were representative of the DBH range and height in each research site. They were felled at ground level, where DBH, H, A (i.e. counting rings in the stem base) and fresh weight was measured for each biomass compartment. Each sampled tree was cut into three compartments – bole (stem), branches, and foliage – for biomass weighing in the field. Plant roots were not investigated in this study. Each biomass compartment was weighed using an electronic balance with a 100 kg capacity and 100 g precision. A subsample was taken from each biomass compartment of sampled trees to determine dry weight in the laboratory.
Three stem discs, with a thickness from 2 to 3 cm, were extracted from the base, middle, and top part of the stem. The same procedure was applied for branches. In this case, the branch discs were extracted from the top and bottom of the branches. Foliage of sampled trees was completely removed from the branches and was measured. These subsamples were measured in the field and then oven-dried at 70°C until a constant weight was reached. Thus, it was possible to determine the dry/fresh weight ratio of each biomass compartment for respective sampled trees.
In those cases where the stem could not be weighed, the diameter was measured at 1 meter intervals from the bottom to the top of the bole. Bole volume of the tree was calculated using Newton í Riecke's equation (Yavuz 1999). Total aboveground biomass of individual trees was calculated by summing the weights of all biomass pools or compartments.
2.3 Regression analysis
In the analysis we used data derived from field and laboratory measurements of 50 sampled Q. cerris individuals. Respective allometric equations between sampled tree variables (DBH, H) and the dry biomass of each compartment were developed. The allometric equations developed were obtained using linear and nonlinear regression without any preliminary transformation of raw data. For all the empirical relationships developed in this study, the predictive variables of dry biomass were DBH, H, or a combination of the two variables. First, the raw data were graphed to visually assess the relationships between aboveground biomass dry weight and predictive tree variables; after this, allometric models were fitted. The best model for each component was chosen based on graphical analysis of residuals and fitting statistics such as coefficient of determination (R2), root mean square error (RMSE), and model efficiency (MEF) (Gadow et al. 2001). In regression, all these coefficients represent a statistical measure of how well the trend line approximates the observed values.
ܯܵܧ =ଵή σ୬୧ୀଵ(yු୧െy୧)ଶ (1)
ܴܯܵܧ = ξܯܵܧ (2) ܯܧܨ = 1െσసభ(୷ି୷ෝഠ)మ
σసభ(୷ି୷ഥഠ)మ (3)
where: ݕെ is the observed value, ݕෝ െ ప is the estimated value, ݕഥ െప is the mean observed value.
2.4 Calculation of Biomass Expansion Factor (BEF)
Based on the values of biomass estimated for all tree components, we derived the aboveground dry biomass and dry biomass of tree bole. Biomass expansion factor (BEF) for sampled trees were calculated using the following equation:
ܤܧܨ =ௐೌ್ೡೝೠ
ௐ್ (4)
where: BEF – biomass expansion factor (dimensionless) Wୟୠ୭୴ୣ୰୭୳୬ୢ= Wcrown + Wtree bole(kg)
Wbole– tree bole dry weight (kg)
2.5 Statistical analysis to test intra-site variability
Correlation and cluster analysis were used to investigate the similarity and differences between biomass data of sampled trees growing in different stands. This analysis is used to quantify the association between pairs of biomass datasets. For that reason, in correlation analysis to quantify the direction and strength of the association between two data sets, we used the correlation coefficient (r). The sign of the correlation coefficient indicates the direction of the association, while the magnitude of the correlation coefficient indicates the strength of the association. Cluster analysis was used to identify homogeneity and similarity in aboveground biomass datasets of sampled trees among research sites. In order to explore the similarity, we used the hierarchical cluster analysis following these procedure: (i) firstly, we specified the distance measuring method (Squared Euclidean Distance) to calculate the distances between variables; (ii) secondly, we linked the clusters using the Ward method because it uses the F-value (like in ANOVA) to maximize the significance of differences between clusters; (iii) thirdly, we selected the right number of clusters (3 clusters).
3 RESULTS
3.1 Biomass equations
The biomass equations were developed for Q. cerris trees, which grow in different sites from northeast to central Albania. Maximum aboveground biomass ranged from 20.82 kg per individual tree in Zerqan to 56.34 kg per tree in Sllove (Table 3). Mean aboveground biomass for sampled trees range from 10.67 kg (Zerqan) to 19.71 kg in Sllove.
Table 3. Minimum, maximum, and mean values for diameter at breast height, tree height, and aboveground biomass weight for the sampled Q. cerris trees in the studied sites Site
Sampled tree number
Diameter at
breast height(cm) Height (m) Age (years) Aboveground biomass (kg/tree) Min Max Mean Min Max Mean Min Max Mean Min Max Mean
Sllove 10 4.0 15.0 9.00 4.1 10 7.60 11 24 17 6.45 56.34 19.71
Bushtrice 9 4.5 13.5 8.30 3.3 9.4 6.30 10 33 20 3.61 23.45 13.10
Melan 8 2.0 15.0 8.80 2.8 8.5 5.71 11 31 21 1.45 27.10 12.98
Zerqan 11 2.5 14.0 7.65 2.2 10.5 6.02 6 25 15 1.52 20.82 10.67
Paper 12 3.0 30.0 9.69 2.8 9.2 5.26 8 48 19 1.78 53.89 15.75
We also found biomass equations for various aboveground components including stem, branches, and foliage using DBH (Table 4), H (Table 5) as predictive variables. The biomass models developed were selected through the statistics for bias and precision (R2, RMSE and MEF) where all parameters were considered significant at the 95% confidence level. In most of the biomass models between DBH and biomass components, the highest model efficiency was attained with the total aboveground biomass exceeding a value of 0.93. Only the biomass model for the Melan site showed the weakest relationship and dependence. Even so, most of the models of stem biomass and aboveground biomass presented efficiency values higher than branches and foliage. Thus, threshold values of model efficiency were respectively 0.74 for stem, 0.63 for branches, and 0.56 for leaves.
In addition, several multiple regression equations were developed using DBH and tree height (H) as well as squared DBH and H as predictor variables of aboveground biomass (Table 6).
Table 4. Allometric equations and statistics between biomass compartments and DBH for Q. cerris
Site Species components Model R2 RMSE MEF
Sllove Stem DW = 1.9848 • DBH0.730 0.71 6.74 0.74
Branches DW = 1.04819 • DBH0.435 0.66 1.52 0.65
Leaves DW = 0.195201 • DBH0.493 0.56 1.08 0.56
Whole tree DW = 2.428 • exp0.207 • DBH 0.96 2.62 0.97
Bushtrice Stem DW = 2.112 • DBH – 7.437 0.95 1.39 0.95
Branches DW = 0.210 • DBH + 0.665 0.68 1.40 0.63
Leaves DW = 0.071 • DBH0.998 0.65 0.2 0.64
Whole tree DW = 2.387 • DBH – 6.691 0.93 1.80 0.93
Melan Stem DW = 0.282 • DBH1.657 0.97 3.82 0.76
Branches DW = 0.335 • DBH + 0.263 0.79 2.15 0.81
Leaves DW = 0.108 • DBH – 0.158 0.96 0.09 0.96
Whole tree DW = 0.927 • DBH1.128 0.65 12.3 0.58
Zerqan Stem DW = 1.325 • DBH – 2.604 0.93 1.28 0.93
Branches DW = 0.346 • DBH – 0.161 0.89 0.42 0.90
Leaves DW = 0.082 • DBH + 0.002 0.91 0.09 0.92
Whole tree DW = 1.755 • DBH – 2.762 0.95 1.45 0.94
Paper Stem DW = 1.489 • DBH – 3.273 0.97 1.78 0.97
Branches DW = 0.368 • DBH – 0.016 0.93 0.43 0.93
Leaves DW = 0.115 • DBH – 0.085 0.95 0.14 0.94
Whole tree DW = 1.973 • DBH – 3.375 0.98 1.90 0.98
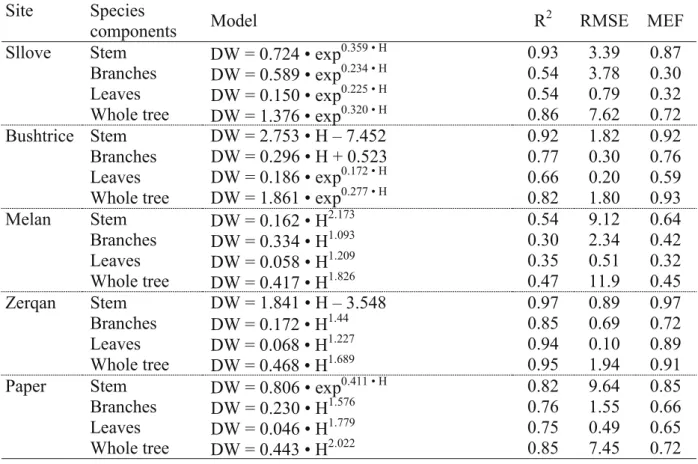
Table 5. Allometric equations and statistics between biomass components and tree height for Q. cerris in studied sites
Site Species
components Model R2 RMSE MEF
Sllove Stem DW = 0.724 • exp0.359 • H 0.93 3.39 0.87
Branches DW = 0.589 • exp0.234 • H 0.54 3.78 0.30
Leaves DW = 0.150 • exp0.225 • H 0.54 0.79 0.32
Whole tree DW = 1.376 • exp0.320 • H 0.86 7.62 0.72
Bushtrice Stem DW = 2.753 • H – 7.452 0.92 1.82 0.92
Branches DW = 0.296 • H + 0.523 0.77 0.30 0.76
Leaves DW = 0.186 • exp0.172 • H 0.66 0.20 0.59
Whole tree DW = 1.861 • exp0.277 • H 0.82 1.80 0.93
Melan Stem DW = 0.162 • H2.173 0.54 9.12 0.64
Branches DW = 0.334 • H1.093 0.30 2.34 0.42
Leaves DW = 0.058 • H1.209 0.35 0.51 0.32
Whole tree DW = 0.417 • H1.826 0.47 11.9 0.45
Zerqan Stem DW = 1.841 • H – 3.548 0.97 0.89 0.97
Branches 0.85 0.69 0.72
Leaves 0.94 0.10 0.89
Whole tree
DW = 0.172 • H1.44 DW = 0.068 • H1.227
DW = 0.468 • H1.689 0.95 1.94 0.91
Paper Stem DW = 0.806 • exp0.411 • H 0.82 9.64 0.85
Branches DW = 0.230 • H1.576 0.76 1.55 0.66
Leaves DW = 0.046 • H1.779 0.75 0.49 0.65
Whole tree DW = 0.443 • H2.022 0.85 7.45 0.72
Table 6. Multiple regression equations using DBH and H as predictor variables of total dry biomass
Site Species
components Model R2 RMSE MEF
Sllove Total
aboveground dry weight (biomass)
DW = –0.839 + 8.43 • DBH – 7.28 • H 0.93 3.69 0.94 DW = 10.35 + 0.301 • DBH2 – 7.28 • H 0.96 2.86 0.96
Bushtrice Total
aboveground dry weight (biomass)
DW = –0.36 + 1.41 • DBH + 1.385 • H 0.95 13.3 0.91 DW = –3.73 + 0.05 • DBH2 + 2.02 • H 0.97 1.69 0.94
Melan Total
aboveground dry weight (biomass)
DW = 22.2 + 4.63 • DBH – 8.952 • H 0.53 6.07 0.55
Zerqan Total
aboveground dry weight (biomass)
DW = –3.56 + 0.69 • DBH + 1.49 • H 0.96 1.18 0.97 DW = –3.24 + 0.01 • DBH2 + 2.19 • H 0.96 1.28 0.96
Paper Total
aboveground dry weight (biomass)
DW = – 6.25 + 1.72 • DBH + 1.016 • H 0.98 1.48 0.98 DW = – 4.05 + 0.04 • DBH2 +2.676 • H 0.99 2.19 0.99
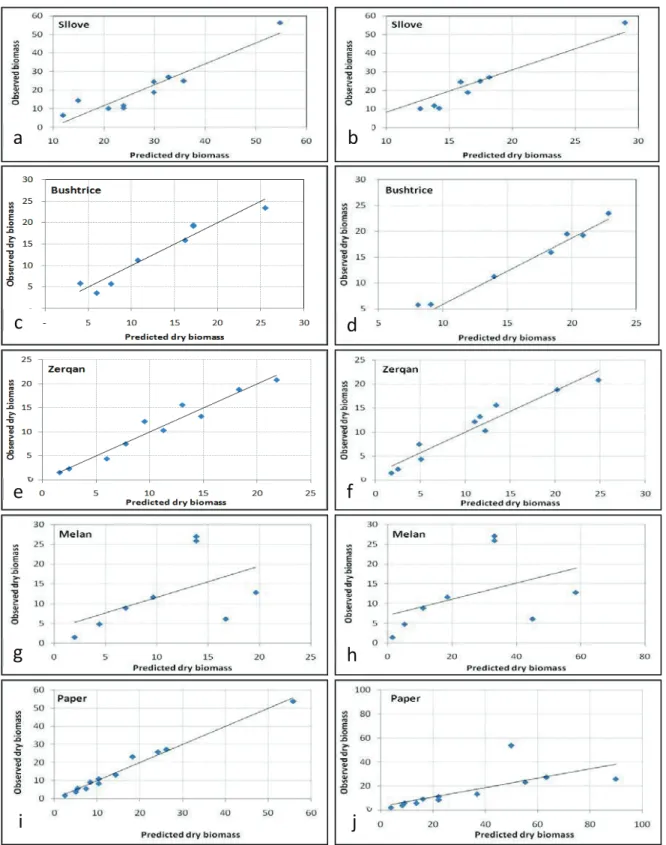
The statistics of biomass equations developed showed that multiple regression equations are more accurate in the prediction of aboveground biomass than simple regression equations are. In addition, the relationships between dry biomass and predictor variables (squared DBH and H) were stronger than equations using only DBH and H as independent variables. Linear regression of the observed (y-axis) against the predicted values were used to examine how well the models fit the observed data (Figure 2).
Figure 2. Observed and predicted values of total aboveground biomass (kg) of Quercus cerris L. using DBH (left side) and H (right side) as predictive variables
g h
i j
a b
c d
e f
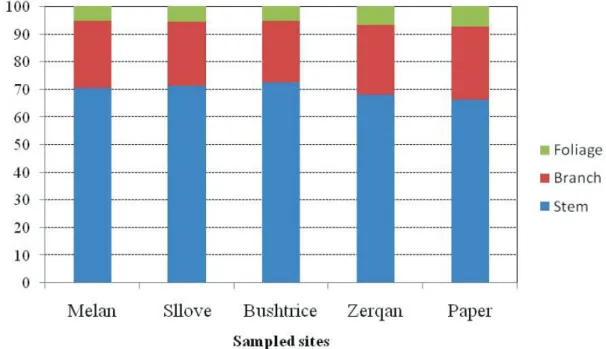
The partitioning of tree biomass into basic fractions as stem and crown (branches of different sizes and foliage when present) is shown in Figure 3. The stem was the biggest fraction ranging from 66.0% in Paper to 72.4 % in Bushtrica. In contrast, sampled trees from Paper had the largest fraction of branch, up to 26.5% of the aboveground biomass, whereas trees from Bushtrica had the lowest value (22.3%). The crown biomass is predominated by branches, which represents 78 to 82 % of the total crown biomass. There is a significant negative relationship between stem biomass and branches (R = –0.98; p < 0.05) and foliage (R = –0.93; p < 0.05) biomass. A positive relationship exists between branch and foliage biomass (R = 0.83; p < 0.05).
Figure 3. Comparison of biomass partitioning in fractions of sampled tree for the studied sites
3.2 Variation in aboveground biomass among sampled sites
Correlation analysis indicated a significant relationship between Bushtrica aboveground biomass data of sampled trees and those from Zerqan and Paper sites. In other cases, the Pearson's correlation coefficients were not significant, indicating the presence of a difference or lack of association in aboveground biomass data sets between the sampled sites (Table 7).
Table 7. Correlation matrix of Pearson's correlation coefficients in aboveground biomass of individual trees among sampled sites
Sites Pearson's correlation coefficients among sampled sites
Melan Sllove Bushtrice Zerqan Paper
Melan 1.00 0.06 0.33 –0.18 –0.11
Sllove 1.00 –0.53 –0.44 –0.37
Bushtrice 1.00 0.72 0.79
Zerqan 1.00 0.72
Paper 1.00
Bold numbers display the significant correlation values for a threshold value of Pearson's correlation coefficient of r = 0.576; p < 0.05.
Cluster analysis grouped the research sites into three clusters based on the similarity of the aboveground biomass data of the fifty sampled trees (Figure 4). The first and second cluster represent the biomass data of sampled trees from the Melan and Sllove sites respectively. These were different from the biomass data for Bushtrica, Zerqan, and Paper, which were grouped in a common cluster. The cluster analysis corresponds well with the results of the matrix of correlation, emphasizing that the populations of sampled trees from Melan and Sllove are different from other sites.
Figure 4. Dendrogram of the studied sites’ clustering using the Ward method incorporating the aboveground biomass data of individual sampled trees
The variability in aboveground biomass among sampled sites denoted that difference is site- specific and caused by differences in local site conditions.
3.3 Biomass expansion factors (BEFs)
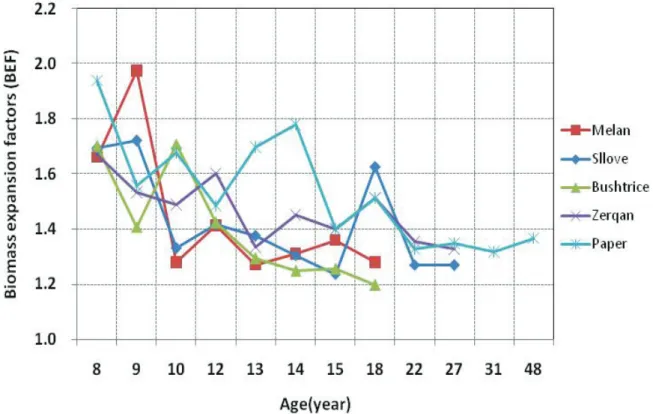
In the present study, BEFs for Q. cerris ranged from 1.2 to 1.97, while the mean value was 1.4. Average BEFs (± SD) for the stem volume conversion into total aboveground biomass were as follows: 1.44 (± 0.25) for Melan, 1.42 (± 0.19) for Sllove, 1.40 (± 0.20) for Bushtrice, 1.47 (± 0.12) for Zerqan and 1.53 (± 0.20) for Paper. The BEFs for this species were age- dependent and the ratio of aboveground biomass to volume over bark decreased as age increased (Figure. 5). A similar negative relationship between BEFs and DBH was noted in all sampled sites where BEFs were slightly decreasing with DBH increasing (Figure 6).
Values of coefficients of determinations for this relationship were much lower than those of allometric biomass models, implying that the relationship of BEFs with tree age is weaker, but statistically significant.
Paper Zerqan
Bushtrice Sllove
Melan 14.30
42.87
71.43
100.00
Variables
Similarity
Dendrogram
Ward Linkage, Correlation Coefficient Distance
Figure 5. Relationship between biomass expansion factors (BEF) and age for the estimation of the total aboveground biomass
Figure 6. Relationship between biomass expansion factors (BEFs) with bole diameter at breast height (DBH)
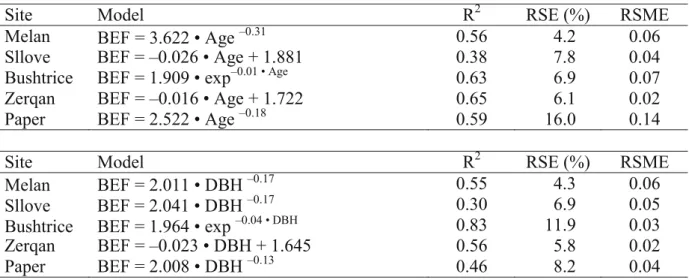
The uncertainty of BEFs models developed with DBH and tree age was tested using coefficient of determination (R2), Relative Standard Error (RSE), and Root Square Mean Error (RMSE) (Table 8). The analysis showed that RSE computed from BEF models varied between 4 and 16% by age as well as from 4 to 12% by DBH. In addition, the RSME estimated showed a lower value when BEFs were predicted by DBH and an opposite result was obtained when age was the predictor variable.
Table 8. Coefficient of determination (R2), relative standard errors (RSE) and Root Mean Square Errors (RSME) of respective models of BEF using DBH and age as predictive variables
Site Model R2 RSE (%) RSME
Melan BEF = 3.622 • Age –0.31 0.56 4.2 0.06
Sllove BEF = –0.026 • Age + 1.881 0.38 7.8 0.04
Bushtrice BEF = 1.909 • exp–0.01 • Age
0.63 6.9 0.07
Zerqan BEF = –0.016 • Age + 1.722 0.65 6.1 0.02
Paper BEF = 2.522 • Age –0.18 0.59 16.0 0.14
Site Model R2 RSE (%) RSME
Melan BEF = 2.011 • DBH –0.17 0.55 4.3 0.06
Sllove BEF = 2.041 • DBH –0.17 0.30 6.9 0.05
Bushtrice BEF = 1.964 • exp –0.04 • DBH 0.83 11.9 0.03
Zerqan BEF = –0.023 • DBH + 1.645 0.56 5.8 0.02
Paper BEF = 2.008 • DBH –0.13 0.46 8.2 0.04
4 DISCUSSION
The results presented in this article complement tree biomass allometry for Q. cerrisgrowing in Albania. New allometric models developed for this species provides a good basis to obtain consistent and accurate biomass estimation. Diameter at breast height and total height are well correlated with aboveground biomass, which are considered as independent variables in all developed biomass models. The use of tree height as an explanatory variable not only affects the accuracy of biomass estimation (Bi et al. 2004, Joosten et al. 2004), but provides the opportunity to compare the developed models in other stands because tree height offers valuable information regarding growth and site conditions (Wirth et al. 2004). For a given DBH and H, there was considerable intra-specific variability and this was greater for the shorter lived components such as foliage and branches than for longer lived components like stems. This finding is consistent with previous studies (Wirth et al. 2004, Saint-André et al.
2005, António et al. 2007, Genet et al. 2011, Xiang et al. 2016, Clough et al. 2016).
The inclusion of squared DBH and tree height as predictor variables in aboveground biomass estimation resulted in a notable improvement of the biomass models, as indicated by the increase of R2 and reduction of RMSE, improving the precision of the estimations (Antonio et al. 2007). DBH, as one of the many dendrometric parameters, falls into the category of easily measurable ones and is widely used in forest inventory. Allometric relationships between DBH and aboveground biomass or tree components biomass take the form of different functions, i.e. from linear to power or exponential functions with one or many covariates. In presented data, the highest R2, RMSE and MEF coefficients were found between DBH and total tree aboveground biomass. We noted that stem models showed a
greater ability for predicting biomass than models of other biomass components, possessing a higher value of R2and model efficiency (MEF) ranging from 64 to 97%.
Many researchers have proposed several models for fitting the relationship between tree variables and aboveground biomass in oak species. Some of these models, found in the international web platform (GlobAllomeTree), were: (i) multiple regression models built by Giurgiu (1974) in Romania for Quercus spp., (ii) linear regression equations for Q. ilex in Italy (Susmelt et al.1976); (iii) logarithmic models between DBH and aboveground biomass for Q. coccinea in United States of America (Martin et al.1998) and Q. ilex from Spain (Canadell et al.1988).
In most of the studied sites, the biomass models developed for estimation of branch biomass presented a lower predictive ability. The most representative cases belong to Sllove and Melan sites. The variability observed in this component might be caused from the differences in stand density (Table 2) and tree competition (Návar 2009).
Biomass partitioning showed that in Q. cerris sampled trees, the stem represents over 65%, implying that this biomass pool is the biggest fraction in the aboveground biomass. Figure 3 showed that Q. cerris allocates 28 to 34% of its aboveground biomass in the crown; these findings are consistent with those reported for other species of the same genus like Q. ilex (Canadell – Roda 1991), Q. suberand Q. canariensis found in other Mediterranean countries (Peinado et al. 2012).
The tree organ-biomass proportions are closely related to age, competition, health status and growing conditions (e.g. Johansson 1999). Specifically, we noted that these proportions changed significantly during the first twenty years of growth from those in 20-year successive period. Thus, stem biomass increases, whereas branches and foliage biomass decrease (Table 9).
Previous studies have reported that in middle-aged and mature stands, stem biomass increases continuously, whereas branch and leaf mass do not vary much (Kantola – Makela 2006).
Table 9. Variability of tree organ-biomass proportions due to age in oak stands
Site
Biomass proportions (%) by age class
0–20 year 21–40 year
Stem Branches Foliage Stem Branches Foliage
Melan 67 27 6 77.5 18.5 4
Sllove 69 25 6 79 17 4
Bushtrice 66 28 6 80 15 5
Zerqan 68 25 7 75 20 5
Paper 63 29 8 74 20 6
Average value 66.6 26.8 6.6 77.1 18.1 4.8
Concerning the effect of age on BEFs, we found a strong age-dependence increase from the Sllove site (r = –0.62; P < 0.05) to Zerqan (r = –0.80; P < 0.05). The significant age- dependence relationship is also closely related with site productivity (all forest stands belong to the fifth production class). Previous studies have reported higher, age-dependent BEFs in broadleaf and conifer forest stands growing on sites with lower productivity (Wirth et al.
2004). This is because trees growing in poor sites are characterized by a higher degree of branches and modification of stem shape (presence of fork etc.), which increases the value of BEF. This age and site dependence of BEF was also reported in earlier studies (e.g. IPCC 2006, Levy et al. 2004). Our results related to the relationship between BEFs and DBH of sampled trees and agreed with those presented by (Teobaldelli et al. 2009). Such trends of BEFs with increasing DBH were found to be under statistical significance (p < 0.05).
Differences in correlation and cluster analysis between aboveground biomass values of
individual Q. cerris trees growing in different sites implies that developed biomass models are site-specific. Such differences between biomass models are increasing due to the variability of age, site conditions, and stand density of the studied forest stands; these findings are consistent with those earlier reported finding (Pilli et al. 2006, Teobaldelli et al. 2009). This highlights the risk of applying site-specific biomass equations to stands other than the ones for which the equations were developed.
Recently, the Albanian government has finalised the third National Communication on Climate Change in which the responsible authorities have reported the situation of GHG inventory covering all sources including the five main sectors of energy, industrial processes, agriculture, waste, and land use change and forestry. Estimation of greenhouse gases (GHG) in the framework of GHG inventory as well as the stocking rate of forest resources at the country level requires suitable BEFs and accurate allometric equations. Therefore, allometric equations developed for many other species in Albania, as well as suitable biomass expansion factors for estimating total biomass and carbon stocks at different spatial and temporal scales, are needed.
5 CONCLUSIONS
Allometric equations for estimating aboveground biomass and BEFs from five oak forest stands were developed based on DBH, H and A. The accuracy of estimates of aboveground biomass has been improved by using squared DBH and H as predictor variables. This study emphasizes that, for a given DBH and H, variability in biomass was greater for the short living tree components. The difference tested statistically showed that biomass models developed were site-specific and that this variability increases due to age, site productivity, and stand density.
REFERENCES
AGROTEC(2004): Albanian National Forest Inventory. Final Report. 140 p.
ANTONIO, N. – Tomé, M. – Tomé, J. – Soares, P. í)RQWHV/Effect of the tree, stand and site variables of the allometry of Eucalyptus globulus tree biomass. Canadian Journal of Forest Research í.https://doi.org/10.1139/X06-276
Bi, H íTurner, J íLambert, M.J.(2004): Additive biomass equations for native eucalypt forest trees of temperate Australia. Trees 18: 467–479.https://doi.org/10.1007/s00468-004-0333-z BROWN6íGILLESPIE$-5íLUGO, A.E. (1989): Biomass estimation methods for tropical forests
ZLWKDSSOLFDWLRQVWRIRUHVWLQYHQWRU\GDWD)RUHVW6FLHQFHí
CANADELL,-íRODA, F. (1991): Root biomass of Quercus ilexin a montane Mediterranean forest.
Canadian Journal of Forest Research 21: 1771–1778.https://doi.org/10.1139/x91-245
CHAVE,-íANDALO, &í%URZQ6íCAIRNS,0$íCHAMBERS,-4íEAMUS'íFÖLSTER, +íFROMARD)íHIGUCHI,1íKIRA, T.íLESCURE,-3íNELSON,%:íOGAWA, H . í PUIG, + íRIÉRA, % íYAMAKURA, T. (2005): Tree allometry and improved estimation of carbon stocks and balance in tropical forests. 2HFRORJLDí
https://doi.org/10.1007/s00442-005-0100-x
CLOUGH%-íRUSSELL0%íDOMKE*0íWOODALL, C.W. (2016): Quantifying allometric model uncertainty for plot-level live tree biomass stocks with a data-driven, hierarchical framework. Forest Ecology and Management 372: 175–188.
https://doi.org/10.1016/j.foreco.2016.04.001
FAO (2015): World Reference Base for Soil Resources 2014, update 2015 International soil classification system for naming soils and creating legends for soil maps. World Soil Resources Reports No. 106. FAO, Rome. IUSS Working Group WRB. ISBN 978-92-5-108369-7 (print).
GADOW, K von. íREAL, 3íALVAREZ-GONZALEZ, J.G. (2001): Modelizacion del crecimiento y la evolucion de los bosques. IUFRO World Series Vol. 12, Vienna.
GENET$íWERNSDÖRFER+íJONARD, M.. íPRETZSCH+íRAUCH0íPONETTE4íNYS,
& íLEGOUT $ íRANGER - íVALLET 3 íSAINT-ANDRÉ, L. (2011): Ontogeny partly explains the apparent heterogeneity of published biomass equations for Fagus sylvatica in central Europe. Forest Ecology and Management 261: 1188–1202.
https://doi.org/10.1016/j.foreco.2010.12.034
HARRIS, ,íJONES,3'íOSBORN, 7-íLISTER, D.H. (2014): Updated high-resolution grids of monthly climatic observations - the CRU TS3.10 dataset. International Journal of Climatology 34 íhttps://doi.org/10.1002/joc.3711
JOHANSSON, T. (1999): Biomass production of Norway spruce (Picea abies[L.] Karst.) growing on abandoned farmland. Silva Fennica 33 (4): í
JOOSTEN, 5 íSCHUMACHER, - íWIRTH, & íSCHULTE, A. (2004): Evaluating tree carbon predictions for beech (Fagus sylvatica L.) in western Germany. Forest Ecology and Management íhttps://doi.org/10.1016/j.foreco.2003.07.037
KANTOLA$íMAKELA, A. (2006): Development of biomass proportions in Norway spruce (Picea abies[L.] Karst.). Trees í
KETTERINGS, 40 íCOE, 5 íVAN NOORDWIJK, 0 íAMBAGAU, < íPALM, C.A. (2001):
Reducing uncertainty in the use of allometric biomass equations for predicting above-ground tree biomass in mixed secondary forests. Forest Ecology and Management 120:
í https://doi.org/10.1016/S0378-1127(00)00460-6
LAITAT, E. í KARJALAINEN, T. í LOUSTAU, D. í LINDNER, M. (2000): Introduction: Towards an integrated scientific approach for carbon accounting in forestry–COST E21 workshop on Contribution of forests and forestry to mitigate greenhouse effects. 28-30 September, 2000 Joensuu, Finland – Biotechnology, Agronomy, Society and. Environment 4 (4): 241í251.
LEHTONEN$íCIENCIALA(íTATARINOV)íMAKIPAA, R. (2007): Uncertainty estimation of biomass expansion factors for Norway spruce in the Czech Republic. Annals of Forest Science 64íhttps://doi.org/10.1051/forest:2006097
LOWE, H. í SEUFERT, G. í RAES, F. (2000): Comparison of methods used within Member States for estimating CO2 emissions and sinks according to UNFCCD and EU Monitoring Mechanism:
forest and other wooded land. Biotechnology, Agronomy, Society and Environment 4 (4):
315í319.
OMURI, I. (2006): Studim mbi perllogaritjen e nivelit te sekuestrimit te karbonit ne komunen Shishtavec bazuar ne rigjenerimin e vegjetacionit autokton pyjor dhe menaxhimin e qendrueshem e shumfunksional te pyjeve [A study over the calculations on carbon sequestration level in Shishtavec commune based on the native forest vegetation regeneration and sustainable management and multifunctionality of the forests]. Master Thesis, 71 p. (in Albanian)
PEINADO, R.R. íMONTERO, G. íDEL RIO, M. (2012): Biomass models to estimate carbon stocks for KDUGZRRGWUHHVSHFLHV)RUHVW6\VWHPVíhttps://doi.org/10.5424/fs/2112211-02193 PICARD, N. í SAINT-ANDRÉ, L. í HENRY, M. (2012): Manuel de construction d´equations
allométriques pour l’estimation du volume et la biomasse des arbres. Centre de Coopération Internationale en Recherche Agronomique pour le Développement [Handbook for the development of allometric equations for estimating the volume and biomass of trees. Center for International Cooperation in Agronomic Research for Development]. Food and Agriculture Organization of the United Nations, Rome, Italy, pp. 211. (in French)
PILLI5íANDOFILLO, 7íCARRER, M. (2006): Towards a functional and simplified allometry for estimating forest biomass. Forest Ecology and Management 237 (1–í
https://doi.org/10.1016/j.foreco.2006.10.004
SAINT íANDRE, L, M’BOU,$7íMABIALA$íMOUVONDY:íJOURDAN&íROUPSARDO.
íDELEPORTE3íHAMEL,2íNOUVELLON, Y. (2005): Age-related equations for above- and belowground biomass of a Eucalyptus hybrid in Congo. Forest Ecology and Management 205:íhttps://doi.org/10.1016/j.foreco.2004.10.006
SCHULZE, D.E. (2000): Carbon and nitrogen cycling in European forest ecosystems. Ecological Studies Vol. 142, Springer Verlag, Berlin/Heidelberg.
SOMOGYI, Z. í CIENCIALA, E. í MAKIPA, A.R. í MUUKKONEN, P. í LEHTONEN, A. í WEISS, P.
(2006): Indirect methods of large-scale forest biomass estimation. European Journal of Forest Research 126 (2):197–207.
TEOBALDELLI, 0 íSOMOGYI, = íMIGLIAVACCA, 0 íUSOLTSEV, V.A. (2009): Generalized functions of biomass expansion factors for conifers and broadleaved by stand age, growing stock and site index. Forest Ecology and Management 257: 1004í1013.
TOROMANI, ( íSANXHAKU, 0 íSALLAKU, 0 íSHAHO, E. (2011): Biomass production and carbon storage of Populus ×canadensis Guinier I-214 plantations grown at Pogradeci region in Albania, Southern Forests: Journal oI)RUHVW6FLHQFHí
https://doi.org/10.2989/20702620.2011.610877
WIRTH,&íSCHUMACHER,-íSCHULZEE.D. (2004): Generic biomass functions for Norway spruce in Central Europe - a meta-analysis approach toward predictionand uncertainty estimation. Tree 3K\VLRORJ\íhttps://doi.org/10.1093/treephys/24.2.121
XIANG : íZHOU - íOUYANG 6 íZHANG 6 íLEI 3 íLI - íDENG ; íFANG, X. í FORRESTER ', íBAUHUS, J. (2016): Species-specific and general allometric equations for estimating tree biomass components of subtropical forests in southern China. European Journal of Forest Research 135: 963–979.https://doi:10.1007/s10342-016-0987-2
YAVUZ, H. (1999): Comparison of the Centroid Method and Four Standard Formulas for Estimating Log Volumes. Turkish Journal RI$JULFXOWXUHDQG)RUHVWU\í