The biophysics of a critical phenomenon: colonization and sedimentation of the photosynthetic bacteria Rubrivivax gelatinosus
Mariann Kis1, Gábor Sipka1, Ferhan Ayaydin2 and Péter Maróti1*
1Institute of Medical Physics, University of Szeged, Hungary
2Cellular Imaging Laboratory, Biological Research Centre, Hungarian Academy of Sciences
The publisher's version: Kis, M., Sipka, G., Ayaydin, F. et al. Eur Biophys J (2017).
https://doi.org/10.1007/s00249-017-1236-4
*Corresponding author
Rerrich Béla tér 1, Szeged 6720, Hungary e-mail: pmaroti@sol.cc.u-szeged.hu phone: 36-62-544-120
Keywords: photosynthesis, planktonic cells, sedimentation, diffusion, biofilm Abbreviations: Rubrivivax – Rvx. ;EPS - exopolysaccharide
Abstract
In response to environmental changes, the photosynthetic bacterium Rubrivivax gelatinosus (Rvx.) can switch from a planktonic lifestyle to a phototrophic biofilm. Like in critical phenomena, the colonization and sedimentation of the cells is abrupt and hard to predict causally, and the underlying biophysics of the mechanisms involved is not known. Herein, we report basic experimental observations and quantitative explanations as keys to understanding microbial turnover of aggregates. (1) The moment of sedimentation can be controlled by the height of the tube of cultivation, by the concentrations of externally added Ficoll (a highly branched polymer) and/or of internally produced polysaccharides (constituents of the biofilm).
(2) The observed translational diffusion coefficient of the planktonic bacteria is the sum of diffusion coefficients coming from random Brownian and twitching movements of the bacteria and amounts to 14 (μm)2/s. (3) This value drops hyperbolically with the association number of the cell aggregates and with the concentration of the exopolysaccharides in the biofilm. In the experiments described herein, their effects could be separated. (4) The critical conditions of colonization and sinking of the cells will be achieved if the height of the tube meets the scale height that is proportional to the ratio of the diffusion coefficient and the net mass of the bacterium. The decisive role of the web-like structure of a biofilm, the organization of bacteria from loose cooperativity to solid aggregation, and the possible importance of similar controls in other phototrophic microorganisms are discussed.
Introduction
Some bacteria have two life forms during growth and proliferation. In planktonic lifestyle, they exist as single, independent cells, whereas in biofilm form, as sessile aggregates embedded within a self-produced matrix of extracellular polymeric substance (Lear and Lewis 2012;
Bjarnsholt 2013) and adhere to each other and/or to a surface (Costerton and Lappin-Scott 1989;
Hall-Stoodley et al. 2004; Flemming and Wingender 2010). The development of biofilms occurs in multiple stages controlled through the excretion of quorum sensing signal molecules that induce transcriptional changes in the recipient cells (Williams et al. 2007; McDougald et al. 2012). Biofilms may form on living or non-living surfaces and can be prevalent in natural, industrial and hospital settings. Bacteria in a biofilm show much higher resistance to heavy metal ions (Kis et al. 2017) and antibiotics (Høiby et al. 2010) than planktonic bacteria due to the physical protection afforded by the extracellular matrix. As biofilms protect the bacteria, they are often more resistant to traditional antimicrobial treatments, making them a serious health risk. They can cause persistent bacterial infections like the opportunistic pathogen Pseudomonas aeruginosa in the lungs of cystic fibrosis patients (Hassett et al. 2010).
Photosynthetic microorganisms (diatoms, algae and cyano-, purple- and green bacteria) in terrestrial and aquatic environments can grow either as plankton or aggregates in phototrophic biofilms (mats) produced usually on surfaces when exposed to light (De Philippis et al. 2005; Roeselers et al. 2008; Nadell et al. 2009). The phototrophic biofilms have been used in widespread applications as wastewater treatment in constructed wetlands, bioremediation, aquaculture and biohydrogen production (Roeselers 2007; Liao et al. 2010). The laboratory based cultivation of phototrophic biofilms provides a valuable alternative for natural systems by allowing experimental manipulation of the entire microbial systems.
Given sufficient resources for photosynthetic or respiratory growth, the biofilm will quickly grow to be macroscopic followed by a remarkable switch from planktonic to biofilm lifestyle of the bacteria (Steunou et al. 2013). Neither the biophysics nor the molecular and regulatory mechanisms of the transition have been elaborated to a large extent. Most progress was achieved in studies of nonsulfur purple bacterium Rvx. gelatinosus by genetic analyses of the two-component regulatory system (EmbR and EmbS) with signal transduction cascade (Steunou et al. 2013). The inactivation of EmbRS resulted in enhanced biofilm production and fast-sinking cell aggregates in liquid. The operation of the regulatory system is exposed to environmental stresses which make the manifestation of the switch of lifestyles highly unpredictable.
Here we investigated the aqueous culture of Rvx. gelatinosus cells in test tubes where the biofilm formation could easily be evoked resulting in colonization and sinking of the uniformly distributed planktonic cells. The process took place collectively, suddenly and unpredictably, like critical phenomena of phase transitions well known in physics. The comprehensive description and interpretation of sinking of the bacteria are lacking in the literature. The present work focuses on the biophysical aspects and is devoted to deeper analysis and understanding of the planktonic–biofilm transition.
Materials and methods Growing conditions
The photosynthetic purple bacterium Rubrivivax (Rvx.) gelatinosus were inoculated from a dense batch culture (1:100) into Siström’s medium (Siström 1962) and were illuminated by tungsten lamps of 13 W∙m-2 irradiance on the surface of the vessel (Asztalos et al. 2010). The bacteria were grown at 30°C temperature in light anaerobically in filled and sealed tubes. The planktonic cells were harvested at early exponential phase. The bacteria in biofilm lifestyle were harvested at late stationary phase of the growth where the cells were strongly connected by the extracellular matrix. When there was a need to remove the cells from the airtight culture
for external measurements, the sample was bubbled with nitrogen for 15 min to preserve the anaerobic conditions. The cell density (concentration) of the culture was estimated by counting the number of individual cells with calibrated Bürker chamber under light microscope.
Chemicals
Ficoll 400 (Sigma) of different concentrations (1-10 w/v%) was used to planktonic cells. Ficoll is a highly branched polymer formed by the copolymerization of sucrose and epichlorohydrin.
It is completely non-ionic, very hydrophilic and extremely water-soluble. Separations in Ficoll normally result in better preservation of cell function and morphology (Georgalis et. al 2012).
Polygalacturonic acid (PGA) (Sigma), a major component of cell wall polysaccharides (pectins) of land plants was used here in 1 w/v% concentration.
Optical assay for sugars
As the bacterial exopolysaccharides are composed of monosaccharides including rhamnose, galacturonic acid, N-acetylglucosamine and Nacetylfucosamine (Allen et al. 2004) and glucose at low levels, colorimetric method for carbohydrates was applied. The soluble carbohydrates content of the biofilm was efficiently extracted by 95% ethanol in 1:1 (v:v) ratio with bacterial culture at room temperature. The yield of extraction by ethanol was significantly greater than from samples extracted with a methanol:chloroform:water solution (Chow and Landhäusser 2004). After extraction, the ethanol should be removed as the residual ethanol can interfere with the phenol-sulfuric acid analysis. After 1 hr of ethanol treatment, the sample was dried out at 40–45 oC temperature followed by rapid addition of reagent solution of 1 mL distilled water, 1 mL 2% phenol and 5 mL concentrated sulfuric acid (DuBois et al. 1956). Waiting 10 min for color development in the dark and cooling in a water bath at 22 °C, optical absorbance was measured by a single beam spectrophotometer (Thermo Spectronic Helios) at 488 nm wavelength. For quantitative determination of the total soluble-glucose concentration, the colorimetric method was calibrated by a series of glucose solutions of known concentrations.
To avoid possible interferences with other substances different from glucose, corrections were made by running a parallel assay without phenol. The procedure was replicated five times. By assaying the same number of planktonic cells as biofilm, the sucrose content of the
“biofilm+cell” system was subtracted from that of “cells only” system to obtain the production of biofilm during the growth of the bacteria.
Time lapse video, optical microscopy
The different phases of cell development, aggregation and sinking of purple bacterium Rvx.
gelatinosus in cultivation tube were tracked by a commercial web-camera.
Video recording (20 fps) and images of the intact cells were captured by Olympus IX81 inverted microscope with Cell R software (Olympus Life Science Europa GmbH, Hamburg, Germany) using UPlanSApo 60x oil immersion objective (numerical aperture 1.35), F-View CCD camera and differential interference contrast (Nomarski) optics.
Determination of the translational diffusion constant of the bacteria
In recorded video images, arbitrary cells of Rvx. gelatinosus were selected for diffusion measurement. Using Image Java software, 500 individual positions of the target cell (xi, i = 1,…,500) were marked manually during a period of 25 s. The mean displacement of the random walk of the cell (Σxi = 0) is expected to be zero. Absence of drift or oriented swimming (which may interfere with diffusion measurements) was checked in each occasion. The mean- square displacement (<xi2>) were calculated and found to increase linearly in time (Fig. 1). This was a clear indication of random walk (diffusion) nature of the movement. The constant of proportionality (slope of the straight line) is 4·D (6·D) if the random movement occurs in plane (in space). The procedure was repeated with 5–10 cells and the D was obtained from the slope of the straight line fitted to the mean-square displacement (<xi2>) vs. time function. The value of D thus found did not depend on the elapsed time t.
Fig. 1. Time-dependence of mean-square displacement (<xi2>) of planktonic cells Rvx.
gelatinosus from the initial (t = 0) position x0 = 0. The dots represent the average (<xi2>) for 10 walks, each having 500 steps. In the case of random (statistical or Brown) motion of the cells in two dimension (in plane), the data are expected to fit on a straight line <xi2> = 4·D·t, whose slope is determined by the translational diffusion coefficient D.
Determination of the macroviscosity of the bacterial culture
Before sterilization and sealing of the glass tube for cultivation, a steel ball is placed in the vessel without air bubbles. As a Höppler-type viscometer, the thermostated setup can be used to determine the viscosity of the aqueous culture () from the time of fall (t) of the ball between to two marks on the wall of the tube and from the difference of the densities of the steel ball (ball) and aqueous culture (cult): = K·(ball – cult)·t, where K is the ball constant determined from calibration of the setup for water of known viscosity. This arrangement permitted the measurement of the viscosity of the culture in different states of the development of the photosynthetic bacteria without perturbation of the growth conditions.
Results
Growth curves of Rvx. gelatinosus
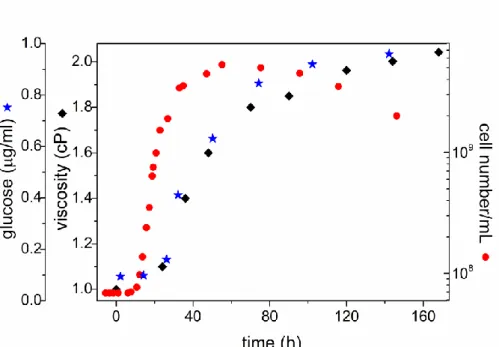
The inoculated cells grow photosynthetically in the illuminated anaerobic culture and undergo different phases of development. After about 15 hours in lag phase, the bacteria start to grow exponentially. The exponential phase terminates and turns to stationary phase with no net change of cell number after about 60 hours of the inoculation under our conditions. The stationary state is followed by a slow and prolonged phase of destruction of the cells.
Fig. 2. Different phases of photosynthetic growth of Rvx. gelatinosus under anaerobic conditions. The development of glucose content () and macroviscosity () of the culture due to biofilm formation is delayed to that of cell concentration (). After about 60 hours, the critical conditions for sudden sedimentation (sinking) are established.
The purple nonsulfur bacterium Rvx. gelatinosus is able to produce extracellular polymeric substances that form the matrix of the biofilm which plays determining role of sinking of the cells (Steunou et al. 2013). The polysaccharides start to form at the early exponential phase of the cell growth. The production increases in exponential manner and does not come to an end at the stationary phase of cell development. Due to the viscous nature of the polysaccharides, the biofilm enhances the viscosity of the culture.
Sudden and collective sinking of bacteria
In the stationary phase of the cell growth, the uniformly distributed cells start to be clumped.
The homogenous suspension becomes heterogeneous and sedimentation of coagulated particles can be observed. The configuration leading to sinking of the cells is established within short period of time and its occurrence is hard to predict. The process resembles the critical phenomena well known in physics such as second order phase transitions, fractal behaviour or ergodicity breaking. Here, we try to describe experimental observations of the critical phenomenon.
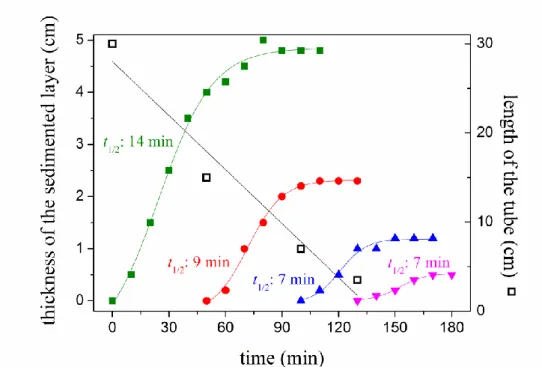
An important property of the collective sinking of the bacteria is its dependence on the length of the tube of cultivation (Fig. 3). Bacteria grown under otherwise identical conditions start to coagulate and sediment first in the longest tube and later in the shorter tubes. The shorter is the vessel the larger is the time delay. For a quantitative evaluation, the height of the sediment was measured as a function of time as it characterizes the beginning and the initial speed of the sedimentation (Fig. 4). Depending of the length of the tubes, the sedimentation starts at different moments and saturates after about 10 minutes. As not all bacteria settle down at once, the successive sedimentation will cause the layers to pile at the bottom of the tube.
Fig. 3. Sudden sinking of Rvx. gelatinosus due to biofilm formation as a function of length of the culture tubes. The bacteria were grown photosynthetically to the early stationer phase (65- 70 hours after inoculation) and then they were distributed into tubes of different lengths (30, 15, 7, 3.5 and 1cm from left to right). Only the lower part of the longest tube (30 cm) can be seen.
The sedimentation occurred spontaneously according to the lengths of the tubes; first in the longest tube (after 1 hour following the transfer) and later (indicated on the pictures) in the shorter vessels.
Fig. 4. Quantitative analysis of the sedimentation experiment presented on Fig. 3: the increase of the thickness of the sedimented loose layer as a function of time in tubes of four different lengths: 30 cm (green); 15 cm (red); 7 cm (blue) and 3.5 cm (magenta). The ratio of tube length and thickness of the sedimented layer is constant (~6). The half times of sedimentation are indicated.
The process can be described by a simple model. Within time t, the bacteria of constant sinking velocity v will cover a distance of v·t and fill up a layer of length X on the bottom of the tube. If c0 and A·c0 denote the initial cell concentration in the tube and the cell concentration in the sedimented layer (A is a “factor of compression”), respectively, then the equation (v·t +
X)·c0 = A·c0·X can be derived from the conservation of the mass of the bacteria. The height of the sedimented layer, X(t) = v·t/(1+A) increases linearly with the time and the maximum (saturation) value Xmax = h/A will be reached after t1/2 = h/v·(1–1/A). Although the model could have been made more realistic by taking Boltzmann distribution (see below) instead of uniform spatial distribution of the cells, even this simple treatment can rationalize the results in Figs. 3 and 4. The function of delay of the initiation of the sedimentation on the length of the tube can be approximated by a straight line whose slope is 30 cm/120 min 42 μm/s. This value estimates the initial velocity of decrease of the scale height (H) or of the diffusion coefficient (D) leading to the collective sinking of the bacteria (see Discussion).
Effect of artificial extracellular polysaccharides
The sudden and collective sinking of the cells was induced by extracellular polysaccharides:
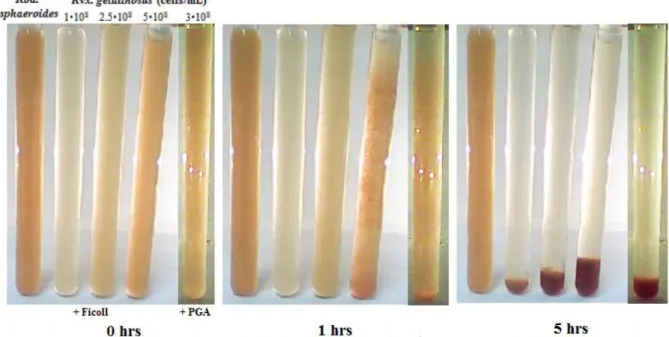
Ficoll 400 and polygalacturonic acid (PGA) (Fig. 5). The higher are the concentrations of the Ficoll and the cell suspension, the earlier will the critical phenomenon take place. At 1% (w/v) PGA and 5% Ficoll (3·108 and 5·108 bacteria/mLcell concentrations, respectively) gradual aggregation formation and sedimentation could easily be followed by visual inspection as shown in Fig. 5. The observed similar behaviors of extracellular polysaccharides and biofilm support the assumption of common cause of collective sinking. The Ficoll and particularly the PGA may have structural and functional analogy to the extracellular polysaccharidesproduced by the bacteria. The cells of Rvx. gelatinosus are not only able to produce the polymers but also to catch the polymer chains produced by the neighbours. That makes the bacterial system able to form web-like structures with all of the known consequences including the switch from planktonic to biofilm lifestyles. Similar phenomena are not observed with other purple photosynthetic bacteria even if a branch-forming agent is present. The PGA and Ficoll has proved to be ineffective in coagulation and sinking of the Rba. sphaeroides cells (see the leftmost tube of Fig. 5).
Fig. 5. Sedimentation of bacteria Rvx. gelatinosus induced by 5% Ficoll 400 and 1%
polygalacturonic acid (PGA) in cultures of different cell concentrations. For comparison, the leftmost tube contains Rba. sphaeroides of 5·108 cell/mL concentration which does not sediment upon addition of 5% Ficoll. After 1 hour, the aggregation and subsequent sedimentation begin in the tube of largest cell concentration and in the tube of PGA.
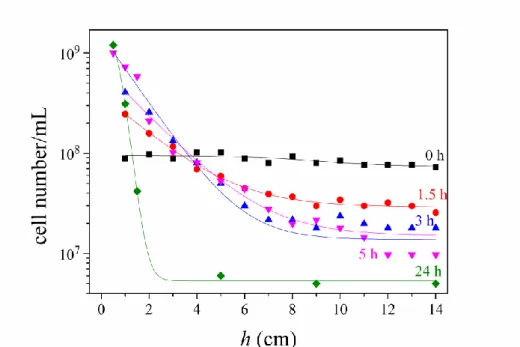
It is interesting to follow the temporal and spatial change of cell concentration in the test tube during the sedimentation process. Figure 6 represents the spatial distribution of the bacteria along the 14 cm long tube at selected times after addition of 5% Ficoll. While the mean value of the distribution (point of mass of the bacteria) shifts downwards progressively, the integral of the curves (total mass of the bacteria) remains constant.
Fig. 6. Spatial distribution of cells Rvx. gelatinosus along a h = 14 cm long test tube at different time points (0, 1.5, 3,5 and 24 hours) after start of colonization and sedimentation by 5% Ficoll.
The initial cell concentration of uniformly distributed bacteria was 1·108 cells/mL. The cell concentrations at different heights (points on the graph) were determined by measurement of the optical absorption followed by calibration using known aliquots of the bacterial culture. The curves are the best fits of the Boltzmann distribution (Eq. (1)) to the points with scale heights H of the major (87%) component:(0 hrs), 5.3 cm (1.5 hrs), 2 cm (3 hrs), 1 cm (5 hrs) and 0.4 cm (24 hrs).
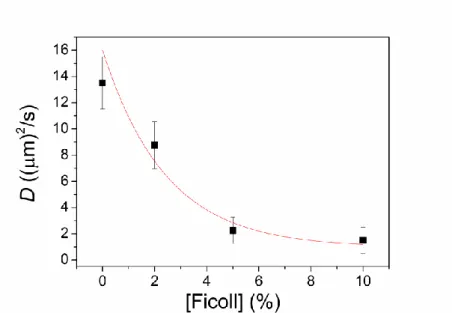
A different aspect of the Ficoll treatment of the bacterial culture can be experienced by measurement of the translational diffusion coefficient (D) of the individual cells in planktonic lifestyle where the effect of biofilm is negligible (Fig. 7). The measurement was carried out after addition of Ficoll to the culture but long before the appearance of signs of collective sinking. Significant drop of D of intact cells Rvx. gelatinosus can be seen with increase of the concentration of the Ficoll. Qualitatively, the cells become more and more connected at higher and higher Ficoll concentrations with consequence of decrease of the mobility of the individual cells. The decrease of D can be attributed to the increase of the (macro)viscosity of the solution and to the increase of the Stokes (hydrodynamic) radii of the cells. The former is not essential.
While 10% Ficoll causes about one order of magnitude drop of the diffusion coefficient, the (macro)viscosity of the 10% Ficoll solution ( 2 cP) is only about twice as large as that without Ficoll ( 1 cP) in good analogy with that of biofilm (see Fig. 2). The branched polymer Ficoll produces similar web-like structure in planktonic cell culture as cells experience in biofilm and causes significant increase of the Stokes radius of the bacterium. One can say that not the (somewhat) increased viscosity of the culture but the connectivity among the cells can be responsible for the decrease of the mobility.
Fig. 7. Decrease of the translational diffusion coefficient of intact planktonic cells of Rvx.
gelatinosus as a function of Ficoll concentration (expressed in w/v%) of the culture at room temperature (25 oC). The cell concentration is 1·108 bacteria/mL. The curve is the least square best fit of Eq. (8) to the data points.
Diffusion coefficients in biofilm
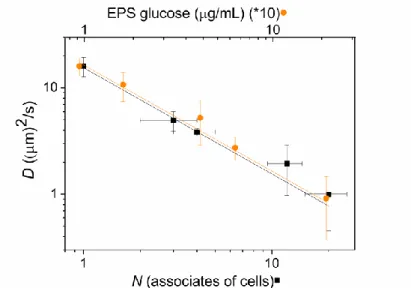
The mobility of the bacteria depends on its lifestyle: while the cells in planktonic form are monomeric and highly independent, in biofilm they tend to colonize aggregates (Fig. 8). Both the association and the increased exopolysaccharide (EPS) content of the solution will decrease the mobility of the cells (Fig. 9). As these factors appear usually together (biofilm formation), the separation of their overlapping effects is challenging. If we selected different bacterium associates with about the same association number (N) in the view field of the microscope, and tracked their pathways, then the sole effect of aggregation on the diffusion coefficients (D) would be obtained (the EPS content remained constant). The aggregation will affect the measured diffusion coefficient due to increased Stokes radius: the higher the degree of association is, the smaller is the diffusion coefficient. On the other hand, if only monomeric bacteria were marked in samples of different evaluation state of the culture, and the corresponding EPS content was determined, then the sole effect of biofilm on the diffusion coefficient would be granted because the degree of association would not change (it would remain monomeric). We see that the produced biofilm affects the measured diffusion coefficient due to the increased viscosity of the culture: the higher the EPS content is, the smaller is the measured diffusion coefficient. Because of the statistical nature of the determination of all quantities (EPS content, N and D), the standard errors of the means are necessarily large. In double logarithm representations, the corresponding data sit on straight lines which cross the error ellipsis of the mean values.
Fig. 8. Microscopy images of Rvx.
gelatinosus cells in the exponential (4 h) and stationary phase (50 h) of growth.
During exponential growth, 2–4 μm long planktonic cells are exclusively in single celled form (A), cells of stationary phase, however, tend to colonize and form doublets, triplets and higher orders of aggregates (B). Scalebars are 10 μm.
Fig. 9. Translational diffusion coefficient (D) of cells Rvx. gelatinosus as a function of number of aggregates (N) and amount of exopolysaccharide (EPS) produced by the cells during growth.
The standard errors of the means are indicated.
Discussion
During the late phases of growth of photosynthetic bacterium Rvx. gelatinosus, sudden colonization and sinking of the cells occur. While the basics of the molecular mechanism, the regulatory pathways and the physiological impact (switch of the lifestyle from planktonic to biofilm) have been largely revealed (Steunou et al. 2013), the biophysics of the process remained completely obscure. In the present study, we have attempted to address this issue. The critical phenomena are used to describe by highly advanced methods of statistical physics (Nishimori and Ortiz 2010) but here an elementary and descriptive analysis based on causal relations of physics will be presented.
Distribution of bacteria in vertical tubes
A thin test tube of length h in horizontal position is uniformly filled with cell culture of concentration c0. Long after turning the tube into vertical position, sedimentation equilibrium in the gravitational field will be established with vertical profile of cell density c(x) described by the Boltzmann relation:
H h H
x H
c h x c
exp 1
exp )
( 0 . (1)
Here x denotes the height from the bottom of the vertical tube and H is defined as the scale height:
g m
T H k
net
B . (2)
The buoyant correction of the mass of the cell reduces m to mnet = m·(1–w/bac), where ρw and
bac are the mass density of water and bacterium, respectively, g is the gravitational acceleration and kBT is the Boltzmann term. The scale height H is inversely proportional to the net mass of the bacterium: the larger the mnet is, the smaller is H. The pre-exponential factor in Eq. (1) is calculated from the conservation of the bacterial mass in both positions of the test tube. The set of sedimentation distributions of the cells induced by Ficoll could be well approximated by the Boltzmann equation with progressively decreasing scale heights as the duration of the treatment increases (Fig. 6).
The Boltzmann distribution shows that, for settling to occur, the gravitational potential energy mnet∙gh between the top and bottom must be bigger than the thermal energy. In other words, the cells float when h H but start to settle down when h > H. By changing of the scale height H to the length of the tube h, transition from uneven (Boltzmann-) distribution (partial (h > H) or complete (h >> H) sedimentation) to uniform distribution (h H) will be obtained.
Due to the exponential function in Eq. (1), the sinking or floating is highly sensitive to the ratio of h/H around 1. Similar abrupt changes are observed in critical phenomena of the statistical physics like phase transitions (Domb and Lebowitz 2001).
The simple conclusion from the Boltzmann distribution is manifested in experiments where the sedimentation is induced by increase of the length of the tube (Fig. 3) or by addition of Ficoll (Fig. 5). If the length of the tube exceeds the scale height (h > H), then indeed, colonization and sinking of the bacteria will occur. In contrast, the distribution of the cells remains uniform and no sedimentation can be observed in shorter tubes (h < H). In a parallel experiment, the length of the tube was kept constant and the scale height was modified by the branched polymer Ficoll of different concentrations. Here again, the simple principle operates:
the Ficoll (mainly through colonization) will increase the net mass of the bacterium and
therefore decrease the scale height (see Eq. (2)). As soon as H becomes as small as h, sedimentation will take place.
Further experiments are required to identify the factors and mechanisms that contribute to modification of the scale height that leads to either suspension or sedimentation of the bacterium Rvx. gelatinosus. We anticipate that the active motion of the bacteria should play decisive role.
Random and slow motion of Rvx. gelatinosus in planktonic lifestyle
The bacteria showed slightly curved and rod-shaped morphology (Fig. 8), as well as Gram- negative staining and motility in accordance with literature data (Imhoff and Trüper 1989). In the absence of long polar flagella, however, the bacteria possess very slow motility thanks to the small thin filamentous hair-like appendages (pili and fimbriae) on the cell surface. Similar (twitching) motility on moist solid surfaces is routinely observed in other microorganisms like Pseudomonas aeruginosa (Henrichsen, 1983). Therefore, the observed motion of the planktonic cell is composed of passive (Brownian) and active (twitching) random movements. It can be shown (Appendix 1) that the superposition of two independent random walk of diffusion coefficients D1 and D2 results in also a random motion whose diffusion coefficient D is the sum of those of the components: D = D1 + D2. Applying to the composed motion of the active bacteria:
D = DBrown + Dtwitch. (3)
To characterize the biologically active form of movement, the Brownian diffusion should be separated from the random movement of twitching. It can be done by fixing the bacteria Rvx.
gelatinosus in 10% formaldehyde. The treatment kills the physiological activity and thus the self-movement of the cell without significant distortion of the hydrodynamics. The diffusion coefficient of the immobilized bacteria can be estimated from the small rate of the sedimentation or directly from the Einstein-Smoluchowski relation of diffusion:
s
BT D 6 R
k , (4)
with reasonable choice of the hydrodynamic parameters of the cell (macroviscosity 1·10-3 kg·s2and Stokes radius Rs 2 μm). The procedures render a limiting (Brownian) diffusion coefficient of DBrown 0.1 (μm)2/s, that is significantly (more than one order of magnitude) smaller than the measured diffusion coefficient D of intact cells (see Figs. 7 and 9). This means that primarily the active movement of the bacteria can be made responsible for the observed larger displacement.
Active random motion of Rvx. gelatinosus prohibits the cells from sinking
The calculated value of the scale height is usually much less than the heights of tubes (water columns). The difference of the mass densities is (bac–w) 80 kg/m3 for most of the microorganisms but can be as small as 10 kg/m3 for phototropic cells (Overmann et al. 1991).
The replacement of these values and the approximate 1 μm linear size of the bacterium into Eq.
(2) will give H = 5 μm and 40 μm scale heights which are much below the possible tubes heights (H << h). Therefore, the bacteria without active motion sink to the bottom of the tubes. After agitation, the bacterial culture kept for longer period of time (for weeks) in the dark refrigerator performs slow sedimentation. The active random motion of the bacterium should results in the increase of H above h that condition assures the even distribution (buoyancy) of the bacteria in the tube of culture.
Replacing Eqs. (3) and (4) into Eq. (2), a more general form of the scale height can be obtained which contains both the passive Brownian and the active (twitching) random motions:
Brown twitch net
B 1
D D g
m T
H k . (5)
It is worthwhile to analyze the thermal equilibrium. In the absence of active movement of the bacterium, the cell carries out a Brownian walk only and is thermal equilibrium with the culture.
If, however, the bacterium has additional (active) movement, then the temperature of the ensemble of the cells will be by a factor of Dtwitch/DBrown higher than the temperature T of the bulk (aqueous culture). The energy flow driven by the temperature-difference is compensated always by the free energy production accompanied by the active motion. Therefore the temperature difference is conserved as long as the bacterium remains active. If, however, the active motion terminates, then the temperatures will be equilibrated between the bulk and the cells. In this case, the increase of the temperature of the bulk will be not significant because the number of the cells (and thus their heat capacity) is negligible to the number (to the heat capacity) of water molecules of the culture.
Based on Eq. (5), two factors can be made responsible for changes of H: 1) diffusion coefficient Dtwitch derived from the active motion of the bacterium and 2) the net mass mnet of the bacterium. Whereas the active motion increases, the net mass decreases the scale height and thus the probability to get even distribution of the cells in the tube. Both quantities may change during growth of the bacteria (Fig. 2). In the lag phase or in the early exponential phase, the cells are in low concentrations, do not aggregate (the mnet is small) and move independently (planktonic lifestyle) with high diffusion coefficient (Dtwitch is high compared to DBrown). In late exponential and stationer phases, however, web of EPS is formed, the cells tend to associate and the aggregates act as single particles with increased mnet. Simultaneously, the movement of the cells (or aggregates) will be slowed down due to the network whose tendency can be formally expressed as decrease of the Dtwitch/DBrown ratio. The two effects are unidirectional and favour the sedimentation by decrease of H. We managed to introduce experimental techniques for possible separation of the two effects and to study the critical conditions around H/h =1 which serves as a gate leading to collective and sudden sinking of the cells.
Separation of decrease of diffusion and increase of net mass of the cells
1) The decrease of the diffusion was studied under two different conditions where one of the two variables was held constant.
1.1) Planktonic cells treated by Ficoll. As in planktonic lifestyle the cells do not associate, the sole effect of Ficoll was manifested in decrease of the diffusion coefficient (Fig. 7). A simplified binding model of multiple and independent binding sites can account for the decrease of the observed diffusion constant.
If [P] and [B] denote the concentrations of the polysaccharide (polymer) and bacterium, respectively, and P has n binding sites with all identical K binding constant for B, then
2
4 1 1
1 1
tot 2
tot tot
tot tot
tot
free B K B K B
n P B
K B
n P
B
B
. (6)
The total amount of bacteria and the amount of cells not bound to P are denoted by lower cases
„tot” and „free”, respectively. Whereas the random walk of the free (planktonic) bacteria is characterized by the maximum diffusion constant Dfree, the bound bacteria have much reduced
mobility with small diffusion constant Dbound. The observed diffusion constant is the average of the limiting diffusion constants Dfree and Dbound weighted by the corresponding concentrations:
freefree
boundbound
boundfree
B B
B D
B D D
. (7)
By use of [Btot] = [Bfree] + [Bbound], we get
tot bound freefree bound
B D B
D D
D . (8)
The concentration and the binding constant should be measured in number/volume and volume/number, respectively. The range of cell concentration used here is [Btot] = 109–1012 cell/L, and that of Ficoll should be calculated from the molecular mass (4∙105 g/mol): 10% (w/v) Ficoll corresponds to [P] = 0.1 g/mL = 0.25 mM = 1.5∙1020 molecules/L. In our experiment represented by Fig. 7, [Btot] was 1·1011 cells/L and the concentration of Ficoll increased from 0% to 10%. The values predicted by the model satisfactorily fit the observed data. The choice of n = 1 has proved to be a reasonable value because of the sizes of the partners: the Stokes radii of the bacterium and the polymer are 2 μm and 10 nm, respectively. The binding constant amounts K = 10-19.3 L/number of molecules and the limiting diffusion coefficients are Dfree = 16.5 (μm)2/s and Dbound 0. We discussed above, that the diffusion constant of the Brownian movement of the cell is very small ( 0.1 (μm)2/s).
Additionally, the cell is bound to the polymer, which decreases further the diffusion constant of the bound bacterium.
1.2) Bacteria in biofilm life style. In different states of the development, the amount of biofilm (the produced EPS) was measured and only the monomeric cells were selected for diffusion measurement (Fig. 9). Towards the late log/stationary phase of the culture, the biofilm production increased steadily while the diffusion coefficient of the monomeric cells decreased progressively. In double logarithm representation, a straight line of slope –1 was obtained that reflected inverse proportionality between the amount of biofilm in the culture and diffusion coefficient of the monomeric cells. This is quite a reasonable result: in lack of other changes, the diffusion coefficient should be in inverse relationship with the microviscosity of the culture modified by the biofilm (see Eq. (4)).
2) Increase of the net mass of the cells. While the amount of biofilm (EPS) was kept constant, cell-aggregates of different association numbers (N) were selected. Due to the adjusted experimental conditions, the sizes of the aggregates did change only and not the microviscosity of the suspension as the biofilm concentration remained unchanged. Therefore the observed changes in the diffusion could be attributed solely to the aggregation of the cells. We obtained that the diffusion coefficients decreased sharply upon increase of N (Fig. 9). In double logarithm scale, the plot could be approximated by a straight line of slope –1 which indicated inverse proportionality between the diffusion coefficient and the aggregation number on wide ranges of the variables. This observation can be supported by the conclusion of a simple model based on one-dimensional random walk (Appendix 2): the diffusion coefficient of an N-meric aggregate is inversely proportional to the association number.
The critical phenomenon of collective sinking of bacteria Rvx. gelatinosus comes to pass when the decrease of the scale height meets the tube length. The drop of H is evoked both by the
increase of the net mass of the bacteria and by the increase of microviscosity of the culture due to biofilm formation. According to Eq. (5), their effects interfere and initiate the sudden change of lifestyle of the bacteria from planktonic to biofilm advantageous in case of stresses such as limited light or nutrients (Jarrell and McBride 2008; Yildiz and Visick 2009).
Acknowledgment We are grateful to Prof. James Smart, University of Tennessee, Martin, USA for discussions and careful reading of the manuscript. Thanks to COST (CM1306), GINOP- 2.3.2-15-2016-00001, OTKA-K 112688 and K-17(P.M.) and EFOP-3.6.2-16-2017-00001 for financial support.
References
Allen MS, Welch KT, Prebyl BS, Baker DC, Meyers AJ, Sayler GS (2004) Analysis and glycosyl composition of the exopolysaccharide isolated from the floc-forming wastewater bacterium Thauera sp. MZ1T. Environmental microbiology 6(8):780–790
Asztalos E, Italiano F, Milano F, Maróti P, Trotta M (2010) Early detection of mercury contamination by fluorescence induction of photosynthetic bacteria. Photochem Photobiol Sci 9:1218-1223
Bjarnsholt T (2013) The role of bacterial biofilms in chronic infections. APMIS Suppl. 136:1- 51
Chow PS, Landhäusser SM (2004) A method for routine measurements of total sugar and starch content in woody plant tissues. Tree Physiology 24:1129–1136
Costerton JW, Lappin-Scott HM (1989) Behavior of bacteria in biofilms. Am. Soc. Microbiol.
News 55: 650–654
De Philippis R, Faraloni C, Sili C, Vincenzini M (2005) Populations of exopolysaccharide- producing cyanobacteria and diatoms in the mucilaginous benthic aggregates of the Tyrrhenian Sea (Tuscan Archipelago). Sci. Total Environ. 353:360–368
Domb C, Lebowitz JL (2001) Phase Transitions and Critical Phenomena, Vol. 19, Academic Press, San Diego.
DuBois M, Gilles KA, Hamilton JK, Rebers PA and Smith F (1956) Colorimetric Method for Determination of Sugars and Related Substances. Anal. Chem. 28 (3): 350–356.
Flemming HC, Wingender J (2010) The biofilm matrix. Nat Rev Microbiol 8:623-633
Georgalis Y, Philipp M, Aleksandrova R, Krüger JK (2012) Light scattering studies on Ficoll PM70 solutions reveal two distinct diffusive modes. Journal of Colloid and Interface Science 386 (1):141-147
Hall-Stoodley L, Costerton JW, Stoodley P (2004) Bacterial biofilms: from the natural environment to infectious diseases. Nat Rev Microbiol 2:95-108
Hassett DJ, Korfhagen TR, Irvin RT, Schurr MJ, Sauer K, Lau GW, Sutton MD, Yu H, Hoiby N (2010) Pseudomonas aeruginosa biofilm infections in cystic fibrosis: insights into pathogenic processes and treatment strategies. Expert Opin Ther Targets 14:117-130 Henrichsen J. (1983) Twitching Motility. Annual review of microbiology 37:81-93
Høiby N, Bjarnsholt T, Givskov M, Molin S, Ciofu O (2010) Antibiotic resistance of bacterial biofilms. Int J Antimicrob Agents 35(4):322-32
Imhoff JP, Trüper HG (1989) Purple nonsulfur bacteria. In: Bergey's Manual of Systematic Bacteriology. Williams and Wilkins, Baltimore. pp. 1635-1709
Jarrell KF, McBride MJ (2008) The surprisingly diverse ways that prokaryotes move. Nat. Rev.
Microbiol. 6:466–476
Kis M, Sipka G, Asztalos E, Rázga Zs, Maróti P (2015) Purple non-sulfur photosynthetic bacteria monitor environmental stresses. J Photochemistry Photobiology B: Biology 151, 110–117
Kis M, Sipka G, Maróti P (2017) Stoichiometry and kinetics of mercury uptake by photosynthetic bacteria. Photosynth Res. 132(2):197-209.
Lear G, Lewis GD, eds. (2012) Microbial Biofilms: Current Research and Applications. Caister Academic Press, ISBN 978-1-904455-96-7.
Liao Q, Wang Y-J, Wang Y-Z, Zhu X, Tian X, Li J (2010) Formation and hydrogen production of photosynthetic bacterial biofilm under various illumination conditions. Bioresource Technology 101: 5315–5324
McDougald D, Rice SA, Barraud N, Steinberg PD, Kjelleberg S (2012) Should we stay or should we go: mechanisms and ecological consequences for biofilm dispersal. Nat Rev Micro 10:39-50
Nadell CD, Xavier JB, Foster KR (2009) The sociobiology of biofilms. FEMS Microbiology Reviews 33(1): 206–224
Nishimori H, Ortiz G (2010) Elements of Phase Transitions and Critical Phenomena. Oxford University Press
Overmann J, Lehmann S, Pfennig N (1991) Gas vesicle formation and buoyancy regulation in Pelodictyon phaeoclathratiforme (Green sulphur bacteria). Arch Microbiol 157:29-37 Roeselers G, Loosdrecht MC, Muyzer G (2008) Phototrophic biofilms and their potential
applications. J. Appl. Phycol. 20:227–235
Steunou AS, Liotenberg S, Soler M-N, Briandet R, Barbe V, Astier Ch, Ouchane S (2013) EmbRS a new two-component system that inhibits biofilm formation and saves Rubrivivax gelatinosus from sinking. MicrobiologyOpen 2(3): 431–446
Williams P, Winzer K, Chan WC, Camara M (2007) Look who's talking: communication and quorum sensing in the bacterial world. Philos Trans R Soc Lond B Biol Sci 362:1119-1134 Yildiz FH, Visick KL (2009) Vibrio biofilms: so much the same yet so different. Trends
Microbiol. 17:109–118
Appendix
1. The overlap of two independent random movements results in random movement
Thesis: If two particles are undergoing two independent random motions simultaneously, then the observed (resultant) motion is also random motion. If the diffusion coefficients of the components are D1 and D2, then the diffusion coefficient of the resultant motion is the sum of those of the components: D = D1 + D2.
Proof: The probability density function of a particle carrying out one-dimensional random movement along a straight line (x axis) starting from point x = 0 can be described by a Gauss function of standard deviation of the mean σ:
. 2 2 exp
) 1
( 2
2
x x
f (A1)
The function offers the probability of finding the particle in interval dx around x. The density function is normalized to unity:
1 ) (x dx
f , as the particle can be in any case found somewhere on the x axis. If the particle accomplishes two random motions of σ1 and σ2 standard deviations simultaneously and independently, then density function of the resultant movement F(x) is given by the convolution of the density functions of the component movement f1(x) and f2(x):
( ') ( ') ' )
(x f1 x f2 x x dx
F . (A2)
If the particle gets to an arbitrary position x’ due to the first type of random movement, then the second type of random motion has to bring the particle to the final position x. The coordinate x’
scans the whole axis. This is the meaning of the convolution in Eq. (A2).
After insertion of the corresponding Gauss functions of Eq. (A1) for f1 and f2, and calculation of the integration, we will get a normalized Gauss function for the density function of the resultant motion:
) (
2 exp 2
) 1
( 2
2 2 1
2 2
2 2
1
x x
F . (A3)
This means that the resultant motion is also random motion whose variance (square of the standard deviation) is the sum of the variances of the components:
2 2 2 1
2
. (A4)
Because the variance is proportional to the diffusion coefficient (σ2 = 2D∙t in straight line (one dimension), σ2 = 4D∙t in plane (two dimensions) and σ2 = 6D∙t in space (three dimensions), where t is the time of random walk), the diffusion coefficients add up independently on the dimension of the space where the diffusion takes place:
D = D1 + D2. (A5)
2. Diffusion coefficient of N-meric aggregate
Consider the particle executing one-dimensional random walk of step size a. It steps either to left or to right with probability p = ½. Assume that N particles form an associate (N-meric aggregate). If k members of the associate step to right and the remaining (N–k) members to left, then the displacement of the N-meric aggregate will be a
N N k
2 occurring with probability
of k pk
p
N kk
P N
1 . This is a binominal distribution with zero mean value and we get
22 1 4 1
1 p p a
N
N
for the standard deviation of the mean after elementary calculations. As the diffusion coefficient D is proportional to 2 and p = ½, the diffusion coefficient of the N-meric aggregate is N times smaller than D0, the diffusion coefficient of the monomer:
N
D D0 . (A6)
Supporting Information
Additional supporting information may be found in the Supplement of this MS:
Movie 1. Time lapse video of colonization and sedimentation of Rvx. gelatinosus cells in cultivation tubes of different lengths. The critical phenomena occur in the leftmost (longest) tube first followed by the cultures in subsequently shorter tubes (see Fig. 3).
Movie 2. Time lapse video (50 fps) of fast sinking of Rvx. gelatinosus cells induced by 5%
Ficoll 400.
Movie 3. Time lapse video (30 fps) of sinking of Rvx. gelatinosus cells induced by 5% Ficoll 400 in cultures of different cell concentrations: 1·108 cell/mL, 2.5·108 cell/mL and 5·108 cell/mL (from left to right). For comparison, the leftmost tube contains Rba. sphaeroides of 5·108 cell/mL concentration which does not sediment upon addition of 5% Ficoll at all. The aggregation and subsequent sedimentation begin in the rightmost tube of largest cell concentration (5·108 cell/mL, see Fig. 5).