53
Introduction
Ethiopia has traditionally been perceived as the water tower of Africa (Ingebretsen, 2015) and is endowed with a favourable physiographic setting for sugarcane growth and productivity. The country has identified more than half mil- lion hectares of land suitable for sugarcane growth with an average productivity of 130 tons per hectare (ESC, 2010).
In recent years, the government of Ethiopia has been mak- ing considerable investments to boost the sugar sector after observing its immense potential and the dynamic behaviour of domestic demand for sugar and ethanol (USDA, 2015).
Between 2009 and 2019, the government has had a plan to expand the area covered with state-run sugarcane cultiva- tions by 333,630 hectares by means of setting aside the land allocated for private farms (ESC, 2010).
This enormous diversion of tracts of land for sugarcane production has been subject of controversy for the last 8 years and will continue to be contentious in the future.
Some considered land grabs by the government as a new style of imperialism and appropriation in the name of eco- nomic development, while others refer to abuses of the basic human rights of native people. In contrast, advocators of the programme claim that this practice of land use change will not be detrimental and will not lead to the deracination of those indigenous people who were relocated and displaced.
They rather argue that those displaced households will have enhanced access to better livelihood and development oppor- tunities (Ingebretsen, 2015).
The shaky argument between proponents and oppo- nents of the programme was lent further support by the contradictory empirical evidence of earlier studies in differ- ent countries. Studies by Kennedy and Cogill (1988), Rist et al. (2010), Akoth (2016) and Rocca (2016) have found that replacing land for sugarcane cultivation has not jeop-
ardised the income and food security status of households.
In contrast, studies by Terry and Ryder (2007), Sparovek et al. (2009), Amrouk et al. (2013), Hughes et al. (2016) and Mwavu et al. (2018) reported that land diversion for sugar- cane expansion has had detrimental effects on the income and livelihood of households. Similarly, previous studies in Ethiopia by Mengistu et al. (2016) and Ingebretsen (2015) predicted adverse results and contradicted the findings of Timkete (2017), who found a positive but small change in GDP.
The mixed results of empirical studies, coupled with human rights abuses reported by different human rights organisations, have led many to ask of whether the policy of reallocating land for sugarcane production should be regarded as an opportunity or instead, a tragedy. This arti- cle therefore aims to measure and quantify the impact of the expansion of sugarcane production in Ethiopia by using a computable general equilibrium model, covering the period 2009 to 2019.
The article is structured as follows. The next section briefly reviews the empirical literature on sugarcane pro- duction and welfare. Data and methodological issues are described in section three. Section four analyses and dis- cusses the findings, while the conclusions and policy impli- cations are presented in section five.
Review of empirical literature
There is a limited amount of literature about the economic modelling of sugarcane and ethanol production coinciding with cogeneration. Amrouk et al. (2013) used an econometric model of a matching technique to analyse structural transfor- mation of sugar market and its implications for smallholder sugarcane farmers in Ethiopia and Tanzania. Their results
Short communication
Timkete ALEME*
Expansion of Sugarcane Production in Ethiopia: Welfare Opportunity or Devastation?
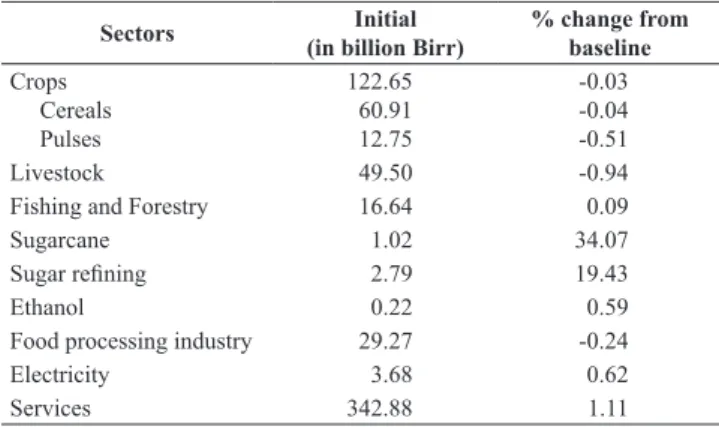
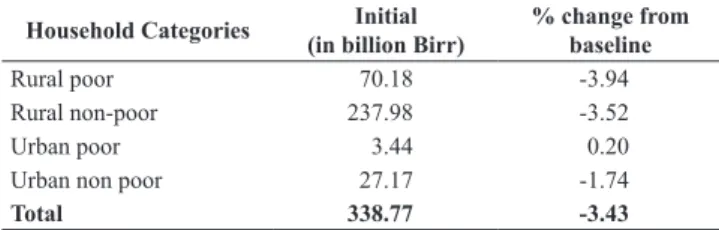
The government of Ethiopia is aiming to boost sugarcane and ethanol production, together with cogeneration. To achieve this goal, enormous sugarcane production strategies have been undertaken without there being concrete evidence as to theirs benefits or detriments to the welfare of households. Here, we used a computable general equilibrium model and SAM dataset to provide useful insights into this story. The results of the study indicate that the average aggregate income and consumption expenditure of households compared to the baseline scenario are negative, although the magnitude of the loss is small. We further find strong evidence that the average aggregate economic welfare of households has deteriorated by 3.43 percent and we conclude that the strategies that the government has been implementing are detrimental to welfare and devastating. Thus, we suggest that the government should cease sugarcane expansion that succeeds at the expense of food crops and policies that favour the use of marginal and barren lands for upcoming sugarcane projects should instead be implemented.
Keywords: Sugarcane, economic welfare, household, general equilibrium, Ethiopia JEL classifications: I31, I38, Q16, R13
* Department of Economics, Mizan-Tepi University, Mizan Teferi, Ethiopia. timketetask@gmail.com Received: 25 January 2019, Revised: 14 March 2019, Accepted: 20 March 2019.
Timkete Aleme
54
indicated that a 1% increase in sugar acreage share leaded to a 0.3% reduction in the income of households. Moreover, Mengistu et al. (2016) empirically investigated the effects of the public sugarcane growers scheme in Ethiopia and found that participating in these schemes produced significantly negative effects on the income as well as asset stocks of pro- ducers and decreased food security in associated villages.
Hughes et al. (2016) investigated the effects of large scale sugarcane production on households’ food security in El Salvador and their findings implied that farmers involved in commercial sugarcane farming were driven out of busi- ness and were vulnerable to food insecurity. A recent study on the expansion of commercial sugarcane production and its impacts on households’ food security in Uganda by Mwavu et al. (2018) meanwhile found that sugarcane production was among the main causes of food insecurity for households who were engaged in this sector. They also reported that the increased use of land for sugarcane cultivation had reduced the availability of arable fields designated for food crops production. Earlier, Terry and Ryder (2007) also reached the conclusion that converting lands into sugarcane cultivation was the major cause of food insecurity in Swaziland. Simi- larly, Hartley et al. (2018) analysed the economic impacts of developing a biofuel industry in Mozambique using CGE analysis and showed that enlargement of sugarcane farm- ing displacing normal agricultural activities decreased the amount of agricultural food crops produced as well as the welfare of households.
Regarding environmental impacts, Akoth (2016) showed that sugarcane farming reduced grazing fields and forest coverage in Kenya by 12 percent. Similarly, the study by Mwavu and Witkowski (2008) reported that enlarging sugar- cane cultivation in Uganda resulted in 8.2% loss of forests.
In the study of Sparovek et al. (2009), the impact of sug- arcane expansion was analysed and a significant reduction of pastures and livestock was reported. Filho and Horridge (2011) estimated the effects of indirect land use change on sugarcane production and found that the expansion of sugar- cane cultivation for ethanol production would lead to a fall of pasture land by 0.21%, planted forest land by 0.65% and unused land by 0.02%.
Conversely, some studies reached different conclusions.
Akoth (2016), for instance, analysed the socio-economic impacts of sugarcane farming in Kenya and found that sug- arcane farming had significantly improved the households’
access to income and consequently increased their standards of living. Rocca (2016) meanwhile studied the impacts of commercial sugarcane production in Zambia and found that household income, consumption level and food security of household engaged had improved.
Data and the CGE model
The main dataset generally used in CGE analysis is the Social Accounting Matrix (SAM). This study uses an updated version of 2005/2006 SAM for Ethiopia which was constructed by the Ethiopian Development Research Insti- tute (EDRI). It was updated in 2009. The original SAM dis- aggregated the economy into 113 activities, 64 commodities
and 16 factors. It also has 13 institutions including 12 house- hold groups. Household groups are disaggregated by loca- tion as rural zones and urban centres. They are also divided based on poverty status as poor and non-poor households.
The rural households are further distinguished based on four main agro-ecological zones (humid, high land cereals, drought prone and pastoralist zones).
In the original SAM, there were no ethanol and cogenera- tion (bioelectricity) sectors. Ethanol can be produced either from sugarcane through direct conversion or from sugar cane molasses. Ethiopia uses the latter as the sole source of ethanol production yet. Bagasse is another by-product of sugar pro- duction used to generate heat and electricity and such tech- nology is known as cogeneration. Thus, omission of these sectors from analysis would understate the aggregate picture of the sugar sector. Therefore, ethanol and cogeneration were included in the SAM and data were collected from four old sugar factories in Ethiopia. By doing so, the SAM has been thoroughly modified to grasp different level of aggregations.
It is now disaggregated into 115 activities and 65 commodi- ties, thereby ensuring the originality of the study.
As partial models generally fail to consider the welfare implication of policy changes (Gohin and Moschini, 2006;
Hosny, 2013), a multi-sectoral and economy-wide Comput- able General Equilibrium (CGE) model is used here. The recursive dynamics of the CGE model applied was devel- oped by the International Food Policy Research Institute (IFPRI) as described in Lofgren et al. (2002), which is an extension of the IFPRI static model developed by Thurlow (2008). The recursive model basically comprises of two components: the within-period component and the between- period component. The within-period component describes a one-period static CGE model with a total of 46 equations, while the between-period component involves the dynamic part of the model with 6 additional equations. The within- period component consists of four blocks: prices, produc- tion and trade, institutions, and system constraints (Lofgren et al. 2002). Since the detailed mathematical description of the four blocks would include the description of sets, param- eters, variables and equations, we concentrate here on the institutions block for the sake of brevity, and examine how households’ income and expenditure equations are specified.
In the CGE model, institutions consists of households, government, enterprise and the rest of the world. Equation 1 represents the total income of each factor.
;
( ) ( )
( )
( )
;
(
)
; ;
YF WF WFDIST QF f F
YIF shif YF trnsfr EXR i INSD f F
YI YIF TRII
trnsf CPI trnsf EXR i INSDNG
EH shii MPS
TINS YI h H
PQ QH PQ EH PQ
PXAC c C h H
PXAC QHA PXAC
EH PQ
PXAC a A c C h H
1 1
1
f A f f f
if if f row f
i f F if i INSDING ii
i gov i row
h i INSDNG ih h
h h
c ch c chm
chm
h c
c C
c hm
ac
c C
a A
ac hh
ac ach ac achh
achh
h c
c C
c hm
ac
c C
a A
ac hh
$ $
d
$ $
d d
$ d
$ $
$ $
d
$ $ $ $
$ $
d d
$ $
$ $
$ $
d d d
c b
c c
c b
c c
=
= -
= + +
+ +
= - -
-
= + -
-
= +
+ -
-
d
d d
d
d d
a a
ae
e e
e
l l
l l
l l
l
l
l l
l l
l
l
6 @
/
/ /
/
/ /
/
/ / /
is total factor income,
;
( ) ( )
( )
( )
;
(
)
; ;
YF WF WFDIST QF f F
YIF shif YF trnsfr EXR i INSD f F
YI YIF TRII
trnsf CPI trnsf EXR i INSDNG
EH shii MPS
TINS YI h H
PQ QH PQ EH PQ
PXAC c C h H
PXAC QHA PXAC
EH PQ
PXAC a A c C h H
1 1
1
f A f f f
if if f row f
i f F if i INSDING ii
i gov i row
h i INSDNG ih h
h h
c ch c chm
chm
h c
c C
c hm
ac
c C
a A
ac hh
ac ach ac achh
achh
h c
c C
c hm
ac
c C
a A
ac hh
$ $
d
$ $
d d
$ d
$ $
$ $
d
$ $ $ $
$ $
d d
$ $
$ $
$ $
d d d
c b
c c
c b
c c
=
= -
= + +
+ +
= - -
-
= + -
-
= +
+ -
-
d
d d
d
d d
a a
ae
e e
e
l l
l l
l l
l
l
l l
l l
l
l
6 @
/
/ /
/
/ /
/
/ / /
is average price of factor,
;
( ) ( )
( )
( )
;
(
)
; ;
YF WF WFDIST QF f F
YIF shif YF trnsfr EXR i INSD f F
YI YIF TRII
trnsf CPI trnsf EXR i INSDNG
EH shii MPS
TINS YI h H
PQ QH PQ EH PQ
PXAC c C h H
PXAC QHA PXAC
EH PQ
PXAC a A c C h H
1 1
1
f A f f f
if if f row f
i f F if i INSDING ii
i gov i row
h i INSDNG ih h
h h
c ch c chm
ch m
h c
c C
c h m
ac
c C
a A
ac h h
ac ach ac achh
ach h
h c
c C
c h m
ac
c C
a A
ac h h
$ $
d
$ $
d d
$ d
$ $
$ $
d
$ $ $ $
$ $
d d
$ $
$ $
$ $
d d d
c b
c c
c b
c c
=
= -
= + +
+ +
= - -
-
= + -
-
= +
+ -
-
d
d d
d
d d
a a
ae
e e
e
l l
l l
l l
l
l
l l
l l
l
l
6 @
/
/ /
/
/ /
/
/ / /
is the wage distortion for factor f from activity a, and
;
( ) ( )
( )
( )
;
(
)
; ;
YF WF WFDIST QF f F
YIF shif YF trnsfr EXR i INSD f F
YI YIF TRII
trnsf CPI trnsf EXR i INSDNG
EH shii MPS
TINS YI h H
PQ QH PQ EH PQ
PXAC c C h H
PXAC QHA PXAC
EH PQ
PXAC a A c C h H
1 1
1
f A f f f
if if f row f
i f F if i INSDING ii
i gov i row
h i INSDNG ih h
h h
c ch c chm
chm
h c
c C
c hm
ac
c C
a A
ac hh
ac ach ac achh
achh
h c
c C
c hm
ac
c C
a A
ac hh
$ $
d
$ $
d d
$ d
$ $
$ $
d
$ $ $ $
$ $
d d
$ $
$ $
$ $
d d d
c b
c c
c b
c c
=
= -
= + +
+ +
= - -
-
= + -
-
= +
+ -
-
d
d d
d
d d
a a
ae
e e
e
l l
l l
l l
l
l
l l
l l
l
l
6 @
/
/ /
/
/ /
/
/ / /
is the quantity demanded of factor f from activity a.
;
( ) ( )
( )
( )
;
(
)
; ;
YF WF WFDIST QF f F
YIF shif YF trnsfr EXR i INSD f F
YI YIF TRII
trnsf CPI trnsf EXR i INSDNG
EH shii MPS
TINS YI h H
PQ QH PQ EH PQ
PXAC c C h H
PXAC QHA PXAC
EH PQ
PXAC a A c C h H
1 1
1
f A f f f
if if f row f
i f F if i INSDING ii
i gov i row
h i INSDNG ih h
h h
c ch c chm
chm
h c
c C
c hm
ac
c C
a A
ac hh
ac ach ac achh
achh
h c
c C
c hm
ac
c C
a A
ac hh
$ $
d
$ $
d d
$ d
$ $
$ $
d
$ $ $ $
$ $
d d
$ $
$ $
$ $
d d d
c b
c c
c b
c c
=
= -
= + +
+ +
= - -
-
= + -
-
= +
+ -
-
d
d d
d
d d
a a
ae
e e
e
l l
l l
l l
l
l
l l
l l
l
l
6 @
/
/ /
/
/ /
/
/ / /
Eq.(1)
The factor income of the institution is divided among domestic institutions in the form of fixed shares after the payment of direct taxes and transfers to the rest of the world.
;
( ) ( )
( )
( )
;
(
)
; ;
YF WF WFDIST QF f F
YIF shif YF trnsfr EXR i INSD f F
YI YIF TRII
trnsf CPI trnsf EXR i INSDNG
EH shii MPS
TINS YI h H
PQ QH PQ EH PQ
PXAC c C h H
PXAC QHA PXAC
EH PQ
PXAC a A c C h H
1 1
1
f A f f f
if if f row f
i f F if i INSDING ii
i gov i row
h i INSDNG ih h
h h
c ch c chm
chm
h c
c C
c hm
ac
c C
a A
ac hh
ac ach ac achh
achh
h c
c C
c hm
ac
c C
a A
ac hh
$ $
d
$ $
d d
$ d
$ $
$ $
d
$ $ $ $
$ $
d d
$ $
$ $
$ $
d d d
c b
c c
c b
c c
=
= -
= + +
+ +
= - -
-
= + -
-
= +
+ -
-
d
d d
d
d d
a a
ae
e e
e
l l
l l
l l
l
l
l l
l l
l
l
6 @
/
/ /
/
/ /
/
/ / /
Eq. (2)