Meta-analytic approach for
transcriptome profiling of herpes simplex virus type 1
Dóra tombácz 1, Gábor torma1, Gábor Gulyás1, Norbert Moldován 1, Michael Snyder 2 &
Zsolt Boldogkői 1 ✉
In this meta-analysis, we re-analysed and compared herpes simplex virus type 1 transcriptomic data generated by eight studies using various short- and long-read sequencing techniques and different library preparation methods. We identified a large number of novel mRNAs, non-coding RNAs and transcript isoforms, and validated many previously published transcripts. Here, we present the most complete HSV-1 transcriptome to date. Furthermore, we also demonstrate that various sequencing techniques, including both cDNA and direct RNA sequencing approaches, are error-prone, which can be circumvented by using integrated approaches. This work draws attention to the need for using multiple sequencing approaches and meta-analyses in transcriptome profiling studies to obtain reliable results.
Introduction
Second-generation short-read sequencing (SRS) technology -launched in the mid-2000s-, has revolutionized both genomic and transcriptomic research because of its ability to sequence millions of nucleic acid fragments simultaneously at a relatively low expenditure per base. Third generation long read sequencing (LRS) approaches have emerged in recent years. Currently, two LRS methods are in use: single-molecule real-time technology and nanopore-based sequencing developed by Pacific Biosciences (PacBio) and by Oxford Nanopore Technologies (ONT), respectively.
LRS can overcome several shortcomings of SRS in transcriptome analysis mainly based on the ability of LRS techniques to read full-length RNA molecules. However, similarly to SRS, LRS techniques often produce spurious transcripts owing to issues such as template switching and mispriming in reverse transcription (RT) and PCR. The major problem is that no efficient bioinformatic tools are currently available to detect these errors. Direct RNA (dRNA) sequencing is considered superior to cDNA sequencing because dRNA sequencing does not involve RT, second strand synthesis and amplification by PCR, which are prone to generate artefacts (however, notably, direct cDNA sequencing without PCR amplification is also possible using both LRS platforms). Nonetheless, dRNA-Seq has also limitations, such as low throughput, 15–30 bases and missing from the transcription start site. Moreover, errors produced by, for example the ligation used for the attachment of adapters, single-strand cDNA formation, or the potential slippage of RNA molecules during their passage across the nanopore as a result of temporary improper functioning of the ratcheting enzyme are also noteworthy drawbacks of dRNA-seq. The low throughput of dRNA-Seq makes both transcript identification and the annotation of nucleic acid sequences at base-pair resolution difficult, which is especially critical in species with large genomes. LRS has already been applied for the transcriptome analysis of various organisms1,2, including viruses3–9. This approach has revealed extremely complex transcriptome profiles in every examined species. LRS techniques can be used in analyses that are challenging for SRS approaches, such as the detection of multi-spliced transcripts, parallel transcriptional overlaps, low-abundance transcripts, very long RNA molecules and embedded transcripts, including 5′-truncated ORF-containing mRNAs and non-coding transcripts. A single technique may fail to detect certain transcripts or transcript isoforms, and to precisely map transcript ends or intron boundaries. Additionally, platform- and library preparation-dependent sequencing errors may produce false isoforms. A meta-analysis including mul- tiplatform approaches, such as various LRS and SRS techniques, as well as different auxiliary methods, such as cap selection, and 5′- and 3′-ends mapping can circumvent the aforementioned problems, especially if different
1Department of Medical Biology, Faculty of Medicine, University of Szeged, Somogyi B. u. 4., 6720, Szeged,
Hungary. 2Department of Genetics, School of Medicine, Stanford University, 300 Pasteur Dr, Stanford, California,
USA. ✉e-mail: boldogkoi.zsolt@med.u-szeged.hu
aNalySIS
OPEN
library preparation protocols are used. Furthermore, the comparison of various datasets provides a tool for iden- tifying novel transcripts, validating already-described RNA molecules or removing putative transcripts if not confirmed by other techniques.
Herpes simplex virus type 1 (HSV-1) is a member of Alphaherpesvirinae subfamily of the Herpesviridae fam- ily. According to estimates by the WHO, more than 3.7 billion people are infected with this virus worldwide10. HSV-1 has a 152-kbp linear double-stranded DNA genome, which is transcribed by the host RNA polymerase in a cascade-like manner producing three kinetic classes of transcripts and proteins: immediate-early (IE), early (E), and late (L)11. IE genes code for transcription activators required for the expression of E and L genes. The viral E genes primarily specify proteins playing a role in DNA synthesis, whereas L genes encode structural proteins. The identification of HSV-1 transcripts faces an important challenge due to the polycistronic and overlapping nature of viral transcripts. However, polycistronic units of herpesviruses are different from those of bacterial operons, in that only the most upstream genes are translated due to the use of cap-dependent translation initiation12. The herpesvirus genes are organized into tandem clusters generating transcripts with co-terminal transcription end sites (TESs). Previous studies have revealed several novel mRNAs, long non-coding RNAs (lncRNAs)13–17 and microRNAs18.
Results
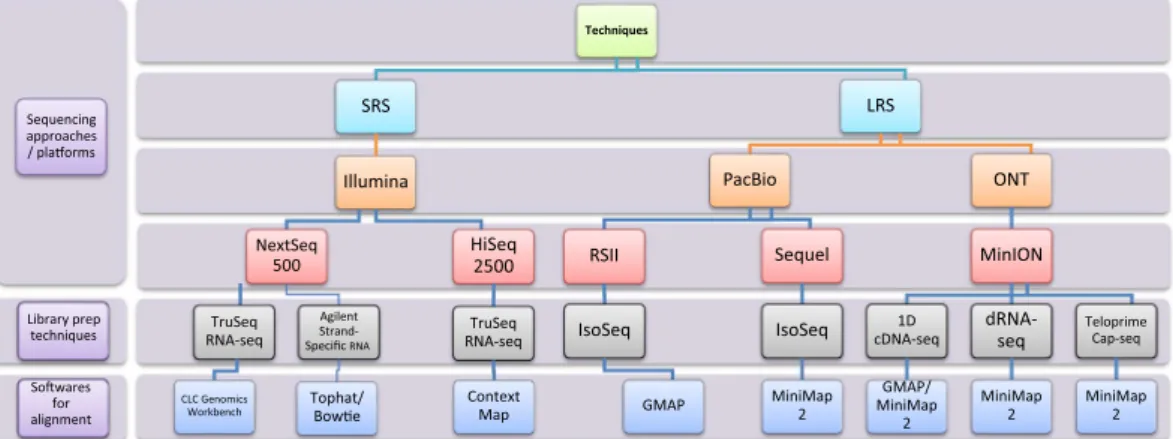
In this study, we employed an integrated approach based on the meta-analysis of the HSV-1 transcriptome data published by Depledge and colleagues (using ONT dRNA-Seq and Illumina RNA-Seq)19, Tang et al. (using Illumina SRS)20, Rutkowski et al. (using Illumina SRS)21, Wishnant et al. (using Illumina SRS)22,23, Pheasant et al. (using Illumina SRS)24 and our laboratory (Tombácz and colleagues using PacBio RSII25, as well as Boldogkői et al.26, and Tombácz et al.27 using PacBio Sequel, ONT dRNA-Seq and cDNA sequencing with multiple library preparation methods; Fig. 1, Supplementary Table 1). Our investigations led to the discovery of several novel transcripts, especially of novel multigenic RNA molecules (Fig. 2), and novel splice sites (Figs. 3–5; Tables 1 and 2, and Supplementary Tables 2 and 3). As Figs. 3 and 4 show, a relatively high percentage of introns identified in a study were not detected in other studies, probably due to the varying strictness of criteria used for the anno- tations. Another possible reason for the large number of unique introns may derive from the variance between the methodologies (e. g. viral titre of infection, virus strain, etc.) used for dataset generation. We note that a large number of unique introns share the splice donor and/or acceptor sites with other introns, which suggests the existence of these splice sites.
Techniques
SRS
Illumina NextSeq
500 TruSeq RNA-seq
CLC Genomics Workbench
Agilent Strand- Specific RNA
Tophat/
Bowe
HiSeq 2500 TruSeq RNA-seq Context Map
LRS PacBio
RSII IsoSeq
GMAP
Sequel IsoSeq
MiniMap 2
ONT
MinION cDNA-seq1D
GMAP/
MiniMap 2
dRNA- seq MiniMap
2
Teloprime Cap-seq
MiniMap 2 Sequencing
approaches / plaorms
Library prep techniques Sowares alignmentfor
Fig. 1 Methodological workflow shows a detailed overview of the various techniques used in the studies chosen for this meta-analysis. SRS: short-read sequencing; LRS: Long-read sequencing; PacBio: Pacific Biosciences;
ONT: Oxford Nanopore Technologies.
Genome ORFs
Super- long RNAs
ORFs and transcripts on the forward strand ORFs and transcripts on the reverse strand
LAT-c Rectangles intersect the Ori overlapping
(ra)RNAs Center of OriL Center of OriSs
RL1 RL2 UL1 UL5 UL7 UL9 UL11 UL15 UL18 UL20 UL22 UL25 UL27 UL29 UL30 UL32 UL36 UL37 UL39 UL41 UL43 UL46 UL48 UL50 UL54 RL2 RS1 US1 US4 US7 US9 RS1 UL2 UL6 UL10 UL14 UL17 UL24 UL26.5 UL31 UL53 US8A
20 kb 40 kb 60 kb 80 kb 100 kb 120 kb 140 kb
Fig. 2 Super-long transcripts of herpes simplex virus type 1. These large (≥4 kbps) RNA molecules were identified using ONT MinION dRNA-Seq and PacBio Sequel techniques. Many of them have uncertain TSSs, especially those ones which were detected by dRNA-Seq. Only the longest transcripts are illustrated at a certain genomic region, except for overlapping transcripts which are complementary to each other.
a b
c d
e f
g
DT DD*
ST AW DD* & ST
ST & AWDD*, ST & AW
TOMBÁCZ ET AL. 2017, 2019
DD*
DT ST DT & ST
ST & AWDEPLEDGE ET AL. 2019*DT, ST & AW
ST DT
DD* AW DT & DD*DT & AW DD* & AW
DT, DD* & AW
TANG ET AL. 2019 - ALL PUBLISHED
ST DT
AW
DT & DD*
DT, DD* & AW DD* & AW
TANG ET AL. 2019 -FILTERED
AW
DT ST DT & ST DD* & ST
DT, DD* & ST
WHISNANT ET AL. 2020
DT DD*
DT & DD*
LRS DATASETS
Unique
DD_S & ST_S DD_S & AR_S DD_S & KP_S ST_S & AR_S
ST_S & KP_S
AR_S & KP_S
DD_S, ST_S & AR_S DD_S, ST_S
& KP_S DD_S, AR_S
& KP_S ST_S, AR_S &
KP_S DD_S,
ST_S, AR_S &
KP_S Validated
ILLUMINA DATASETS
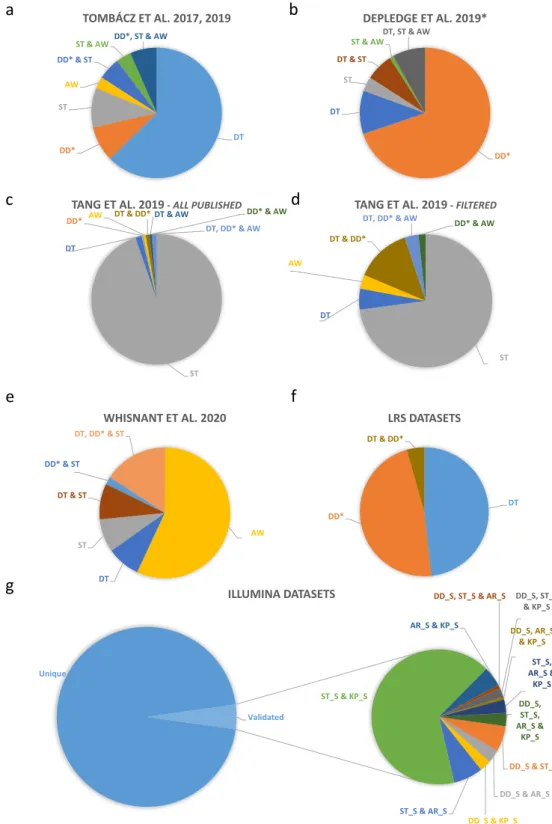
Fig. 3 Herpes simplex virus type 1 (HSV-1) introns identified using different sequencing platforms. The 378 putative introns identified in our earlier study25,27 are already multiplatform-based (various combinations of library preparation techniques of Pacific Biosciences RSII and Sequel, and Oxford Nanopore Technologies MinION sequencing). These datasets were compared with the intron datasets generated by Tang et al.20 and Whisnant et al.22. We also used raw sequencing reads from Depledge’s direct RNA-Seq study19. The obtained data were aligned to the HSV-1 genome and then analysed using LoRTIA. This analysis detected 214 introns.
Four large raw Illumina datasets19–22,24 were also mapped and reanalysed. Only the introns that were present in at least two independent datasets were accepted and plotted. We obtained 3,848 additional potential introns from this part of the work (see in Supplementary Table 2). (a) Introns identified by Tombácz and colleagues.
Altogether, 44.7% of these introns have been validated by the other studies. (b) Introns identified in Depledge and co-workers’ dataset using the LoRTIA tool. Our analysis of the raw dRNA-Seq reads detected 309 potential introns, from which 104 were also found in the other studies. The LoRTIA tool did not identify the previously
published intron within the RNA encoding the fusion protein RL2–UL119; however, it was verified by the dataset from Tang and colleagues’ publication20. (c) Introns published by Tang and colleagues. These authors published a large number of potential introns (2352), but only 5% of them were validated in the other datasets.
(d) High-coverage introns from Tang and co-workers’ publication. 59 out of 2,352 detected introns were identified as highly abundant by the authors. From these 59, only 16 (27%) were detected in at least one of the other three published intron datasets. (e) Introns from Whisnant and colleagues’ publication. They have published 79 introns, 84% of which were also found in other datasets. The authors have analysed our previous dataset22 and found that seven of the eleven published introns are low-abundance isoforms. Therefore, they considered them as unconfirmed. We found and validated five out of these seven introns in our novel dataset, which were also present in Tang’s and/or Depledge’s datasets. (f) Distribution of the introns identified only in LRS dataset(s). Our analysis identified more than 400 potential introns which were not validated by the analysis of either Illumina dataset. Five per cent of these introns were found in both LRS data. (g) Reanalysis of HSV datasets from various Illumina sequencing experiments. This work yielded 4,180 introns which were detected in at least two of the datasets. DT: Tombácz et al. 2017 & 2019; DD: Depledge et al. 2019; ST: Tang et al. 2019;
AW: Whisnant et al. 2019 & 2020; AR_S: dataset from Rutkowski et al. 2019 analysed by STAR; DD_S: Illumina dataset from Depledge et al. 2019 analysed by STAR; KP_S: dataset from Pheasant et al. 2018; ST_S: dataset from Tang et al. 2019 analysed by STAR.
Intron positions DNA
strand Intron motif Intron length
2318 3082 + GT/AG 764
3750 3885 + GT/AG 135
3750 3888 + GT/AG 138
12179 12299 − CT/AC 120
12429 12971 + GT/AG 542
13449 13931 − CT/AC 482
29068 29661 − CT/AC 593
30049 33634 + GT/AG 3585
41710 42245 + GT/AG 535
46772 48031 + GT/AG 1259
46772 48074 + GT/AG 1302
46772 48812 + GT/AG 2040
48251 48812 + GT/AG 561
81034 81192 − CT/AC 158
81034 85774 − CT/AC 4740
81034 88414 − CT/AC 7380
88553 88816 − CT/AC 263
91080 91413 + GT/AG 333
91123 91413 + GT/AG 290
91247 91390 − CT/AC 143
91318 91390 − CT/AC 72
91553 92535 + GT/AG 982
91553 97949 + GT/AG 6396
91654 92433 − CT/AC 779
97724 97949 + GT/AG 225
97843 97949 + GT/AG 106
1E + 05 1E + 05 + GT/AG 1949
1E + 05 1E + 05 + GT/AG 2426
1E + 05 1E + 05 + GT/AG 358
1E + 05 1E + 05 − CT/AC 138
1E + 05 1E + 05 − CT/AC 135
1E + 05 1E + 05 − CT/AC 764
1E + 05 1E + 05 + GT/AG 167
1E + 05 1E + 05 + GT/AG 609
1E + 05 1E + 05 + GT/AG 202
1E + 05 1E + 05 − CT/AC 211
1E + 05 1E + 05 − CT/AC 230
1E+05 1E + 05 − CT/AC 826
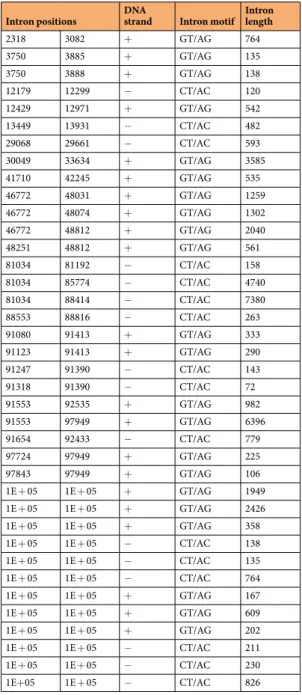
Table 1. Introns identified in all datasets.
Additionally, we confirmed putative RNA molecules and transcript isoforms which were previously unpub- lished because of inadequate evidence supporting their existence (Supplementary Table 3). This meta-analysis also revealed that practically all HSV-1 genes contain at least one shorter transcript variant with 5′-truncated in-frame ORFs (Fig. 6). Loosening the annotation criteria probably would lead to the identification of truncated genes in every canonical gene. We also identified several fusion genes with relatively long introns spanning across gene boundaries (Supplementary Table 3b). We confirmed the RL2–UL1 and UL52–UL54 fusion transcripts described by Depledge and colleagues19 but the longer intron of the RL2–UL1 transcript was only present in a very low abundance in the remapped Illumina dataset published by Tang end co-workers20. However, it was unde- tected in the re-mapped, LoRTIA-filtered Depledge-dataset. In most fusion genes, only introns were identified but not precise transcript termini. Additionally, a large number of low-abundance transcript isoforms -including splice and length variants- were detected in this and other studies28 also. Whether these molecules have functional significance, or are merely the result of transcriptional noise remains to be ascertained. The general functions of embedded and fusion genes are also unknown. This work also revealed longer transcription start site (TSS) iso- forms of several RNA molecules (Supplementary Table 3c). For example, we discovered longer TSS variants for the replication-associated RNAs (raRNAs)29 that overlap OriL or OriS (Fig. 2), and for latency-associated tran- scripts (LATs) (Fig. 2). The meta-analytic approach is also suitable for the elimination or addition of unconfirmed transcripts into the “putative” category. For example, a minor fraction of 5′- and 3′-truncated RNA molecules sequenced by the PacBio RS II platform25, were undetectable by other techniques, therefore they were removed from the latest list of HSV-1 transcripts.
Direct RNA sequencing is considered to be the golden standard of transcriptome analysis due its apparent lack of errors. However, we demonstrated here that this technique produces a relatively high level of errors. The fact that we could not detect a large number of dRNA introns in either cDNA database (205 introns in Depledge’s
33486 33634 + GT/AG 148 x x x x x
41710 42239 + GT/AG 529 x x x x x
47542 48031 + GT/AG 489 x x x x x
53824 53869 + GT/AG 45 x x x x x
69670 69923 + GT/AG 253 x x x x x
79884 80090 + GT/AG 206 x x x x x
81034 81383 − CT/AC 349 x x x x x
81034 81642 − CT/AC 608 x x x x x
81034 83364 − CT/AC 2330 x x x x x
87740 88414 − CT/AC 674 x x x x x
88553 90069 − CT/AC 1516 x x x x x
89111 90069 − CT/AC 958 x x x x x
91553 93625 + GT/AG 2072 x x x x x 91553 94382 + GT/AG 2829 x x x x x 123289 123507 − CT/AC 218 x x x x x 123289 124570 − CT/AC 1281 x x x x x 124151 124570 − CT/AC 419 x x x x x 131183 132009 + GT/AG 826 x x x x x 131183 132128 + GT/AG 945 x x x x x 132354 132540 + GT/AG 186 x x x x x 132373 132543 + GT/AG 170 x x x x x 132640 133321 − CT/AC 681 x x x x x 133903 135434 + GT/AG 1531 x x x x x 134699 135211 − CT/AC 512 x x x x x 134699 135814 − CT/AC 1115 x x x x x 134699 136483 − CT/AC 1784 x x x x x 134699 136600 − CT/AC 1901 x x x x x 134699 137651 − CT/AC 2952 x x x x x 135232 135339 + GT/AG 107 x x x x x 137810 138985 − CT/AC 1175 x x x x x 139059 139171 + GT/AG 112 x x x x x 139059 139197 + GT/AG 138 x x x x x 141330 141476 + GT/AG 146 x x x x x 141330 142097 + GT/AG 767 x x x x x 145646 145860 − CT/AC 214 x x x x x 146105 147050 − CT/AC 945 x x x x x
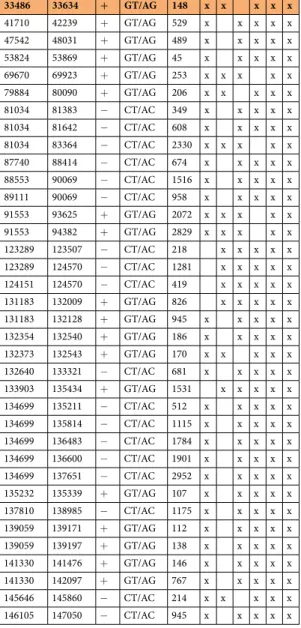
Table 2. Introns detected in five independent experiments.
dataset and a single intron in our dRNA-Seq dataset) indicates lower than expected fidelity rate of dRNA-seq. In this study, the dRNA dataset produced the shortest average intron length. This dissimilarity in the two datasets is explained by the differences in the depths of coverage. However, the most abundant introns were present in databases of both approaches. Our meta-analysis confirmed the existence of an extremely complex meshwork of transcription overlaps (described by Tombacz and co-workers27), which is produced by transcriptional read- throughs between tandem and convergent genes and by the head-to-head overlap between divergent genes. Here, we identified several very long readthrough RNAs, including complex transcripts (containing at least two genes
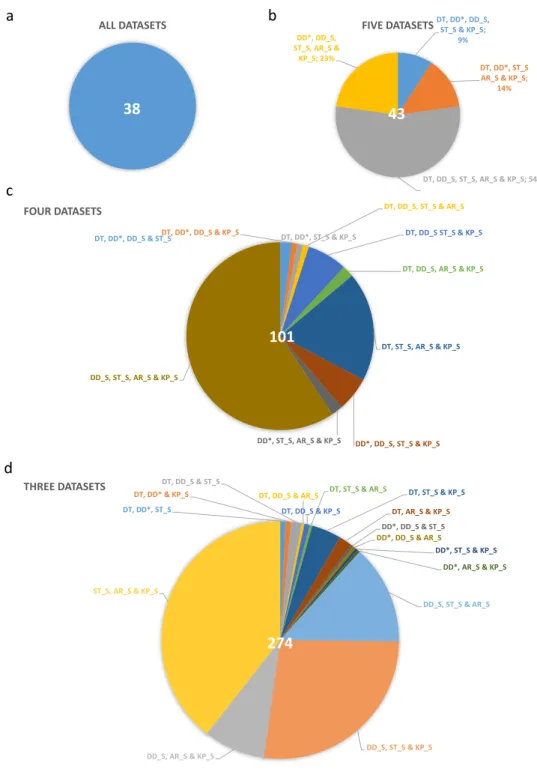
38 43
101
274
a b
c
d
ALL DATASETS
38
DT, DD*, DD_S, ST_S & KP_S;
9%
DT, DD*, ST_S AR_S & KP_S;
14%
DT, DD_S, ST_S, AR_S & KP_S; 54%
DD*, DD_S, ST_S, AR_S &
KP_S; 23%
FIVE DATASETS
43
DT, DD*, DD_S & ST_SDT, DD*, DD_S & KP_S DT, DD*, ST_S & KP_S
DT, DD_S, ST_S & AR_S DT, DD_S ST_S & KP_S
DT, DD_S, AR_S & KP_S
DT, ST_S, AR_S & KP_S
DD*, DD_S, ST_S & KP_S DD*, ST_S, AR_S & KP_S
DD_S, ST_S, AR_S & KP_S
FOUR DATASETS
101
DT, DD*, ST_S DT, DD* & KP_S
DT, DD_S & ST_S
DT, DD_S & AR_S DT, DD_S & KP_S
DT, ST_S & AR_S DT, ST_S & KP_S DT, AR_S & KP_S DD*, DD_S & ST_S DD*, DD_S & AR_S
DD*, ST_S & KP_S DD*, AR_S & KP_S
DD_S, ST_S & AR_S
DD_S, ST_S & KP_S DD_S, AR_S & KP_S
ST_S, AR_S & KP_S
THREE DATASETS
274
Fig. 4 Introns, identified in at least three independent experiments. (a) Thirty-eight introns were detected in all six datasets. (b) Introns validated by five experiments. The largest “five-dataset” combination (56%) contains introns which were detected in the four Illumina datasets and the dataset from our laboratory. (c) Five dataset validated introns. 59% of these introns were detected within the four Illumina datasets. (d) 274 introns were shown in 3 independent experiments. DT: Tombácz et al. 2017 & 2019; DD: Depledge et al. 2019; ST: Tang et al. 2019; AW: Whisnant et al. 2019 & 2020; AR_S: dataset from Rutkowski et al. 2019 analysed by STAR; DD_S:
Illumina dataset from Depledge et al. 2019 analysed by STAR; KP_S: dataset from Pheasant et al. 2018; ST_S:
dataset from Tang et al. 2019 analysed by STAR.
in opposite orientations), and transcript isoforms with long 5′-untranslated regions (5′-UTRs) (Supplementary Table 3c). Except for most parallel and some convergent overlaps, the majority of transcription readthroughs generate low-abundance transcripts the function of which, if any, is currently unknown. Transcriptional read- throughs might be the by-products of a genome-wide interference mechanism operating via the collision and competition of various elements of the transcription machinery30. This hypothesis does not exclude the possibility that the generated RNA strands also have functions of their own. Our comparative study clearly demonstrates the need for multiplatform and meta-analytic approaches for transcriptome profiling to obtain reliable results.
We assembled the sequence of HSV-1 transcripts using ReadConsensus script SeqTools (https://github.com/
moldovannorbert/seqtools) and our previously published LRS data27. We found 157 transcripts after removing those with a read depth less than 30 × (Supplementary Table 4) Their sequence consensus can be found in CITE.
We note here that de novo or reference-guided transcriptome annotation is more challenging than genome anno- tation due to the fact that the same DNA region generally codes for multiple RNA isoforms, including splice, TSS and TES variants. Higher read depths and multiple biological replicates are needed for such analyses.
Discussion
In this study, we re-analysed and compared the datasets on HSV-1 transcriptome generated by eight studies19–27. Here, we provide the most complete transcriptome of HSV-1 to date. We identified a number of novel RNA molecules and transcript isoforms, including intron and length variants. We also confirmed the existence of previously published transcripts. This multiplatform study also identified and confirmed several low-abundance transcripts, such as mono- and multi-spliced transcripts, 5′-truncated mRNAs with short in-frame ORFs, and very long TSS variants, polycistronic and complex transcripts. The functions of these RNA molecules (if any)
Genome
Introns
ORFs and introns on the forward strand ORFs and introns on the reverse strand
ORFs RL1 RL2 UL1 UL5 UL7 UL9 UL11 UL15 UL18 UL20 UL22 UL25 UL27 UL29 UL30 UL32 UL36 UL37 UL39 UL41 UL43 UL46 UL48 UL50 UL54 RL2 RS1 US1 US4 US7 US9 RS1 UL2 UL6 UL10 UL14 UL17 UL24 UL26.5 UL31 UL53 US8A
20 kb 40 kb 60 kb 80 kb 100 kb 120 kb 140 kb
Fig. 5 Integrative Genomics Viewer representation of the intron positions.
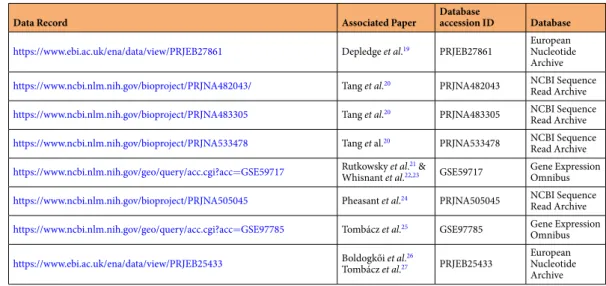
Data Record Associated Paper Database
accession ID Database https://www.ebi.ac.uk/ena/data/view/PRJEB27861 Depledge et al.19 PRJEB27861 European
Nucleotide Archive https://www.ncbi.nlm.nih.gov/bioproject/PRJNA482043/ Tang et al.20 PRJNA482043 NCBI Sequence
Read Archive https://www.ncbi.nlm.nih.gov/bioproject/PRJNA483305 Tang et al.20 PRJNA483305 NCBI Sequence
Read Archive https://www.ncbi.nlm.nih.gov/bioproject/PRJNA533478 Tang et al.20 PRJNA533478 NCBI Sequence
Read Archive https://www.ncbi.nlm.nih.gov/geo/query/acc.cgi?acc=GSE59717 Rutkowsky et al.21 &
Whisnant et al.22,23 GSE59717 Gene Expression Omnibus https://www.ncbi.nlm.nih.gov/bioproject/PRJNA505045 Pheasant et al.24 PRJNA505045 NCBI Sequence
Read Archive https://www.ncbi.nlm.nih.gov/geo/query/acc.cgi?acc=GSE97785 Tombácz et al.25 GSE97785 Gene Expression
Omnibus https://www.ebi.ac.uk/ena/data/view/PRJEB25433 Boldogkői et al.26
Tombácz et al.27 PRJEB25433 European Nucleotide Archive
Table 3. Data records that were used in this study.
have to be demonstrated experimentally. Furthermore, we also demonstrated that various sequencing techniques, including dRNA-Seq, are error-prone, which can be circumvented by using integrated approaches. This study showed that using different reference genomes for mapping, the same transcripts can lead to somewhat different results with respect to the splice sites, especially in SRS. Taken together, employing multiplatform approaches with distinct library preparation methods is especially important in transcriptome research, because of the high error-rate and variance in the results obtained using various library preparation, sequencing and annotation methods. Furthermore, meta-analyses can account for the potential errors derived from using different kits and protocols, as well as from dissimilar work styles and conditions in different laboratories.
Methods
Datasets In this study, several datasets (Depledge et al.19, Tombácz et al.25,27; Tang et al.20; Rutkowski et al.21, Whisnant et al.22,23 and Pheasant et al.24) were reanalysed to define the complete HSV-1 transcriptome. The data- sets from our laboratory are filtered from data derived from PacBio and ONT cDNA sequencing, and various ONT library preparation approaches including cDNA-, Cap-selected cDNA and dRNA sequencing26,27. The wet- lab and in silico protocols are detailed in the above mentioned studies. The SRS datasets were used only for the Fig. 6 We have earlier published 63 embedded HSV genes (Tombácz et al. 2017). Sixty-one of them were validated using the dataset from Depledge’s publication. (a) Bar chart representation of the embedded ORFs.
Many of the embedded ORFs have multiple length isoforms (Supplementary Table 2). (b) An example for an embedded ORF-containing transcript detected by various techniques. Visualization of the UL2 transcript and one of its truncated transcripts (ul2.5) using Integrative Genomics Viewer. The sequencing reads are from long-read (LRS) sequencing and short-read sequencing (SRS) datasets including direct RNA (dRNA) and cDNA sequencing. It can be seen that the dRNA-seq and the two LRS cDNA techniques detected the same TSS (note that dRNA sequencing produces shorter 5’-UTRs [on average, 23 bp are missing]). The figure also shows that SRS without a specialized library preparation method (e.g., CAGE) is not sufficient to identify 5’-ends of transcripts.
Tombácz et al.
2017
Tombácz et al.
2017 Boldogkői et al.
2018 Depledge et al.
2019
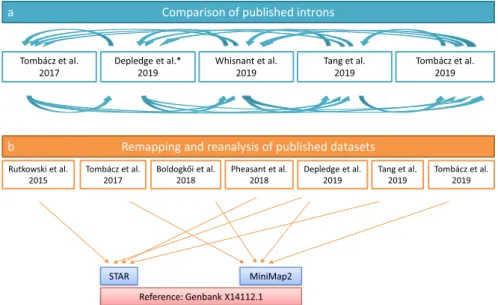
Comparison of published introns
Tombácz et al.
Tang et al. 2019 Whisnant et al. 2019
Depledge et al.* 2019 2019
Remapping and reanalysis of published datasets
Rutkowski et al.
2015 Tang et al.
2019 Tombácz et al.
2019
STAR MiniMap2
Reference: Genbank X14112.1
a
b
Pheasant et al.
2018
Fig. 7 The network of datasets used for this meta-analysis study.
0 10 20 30 40 50 60 70 80 90 100
PacBio RSII PacBio Sequel MinION cDNA-seq 1h MinION cDNA-seq 2h MinION cDNA-seq 4h MinION cDNA-seq 6h MinION cDNA-seq 8h MinION cDNA-seq 10h MinION cDNA-seq 12h MinION cDNA-seq 24h MinION cDNA-seq (mixed) MinION cDNA-seq (random) MinION CAP-seq (Lexogen) MinION CAP-seq (Terminator) MinION dRNA-seq
Distribuon of polyA tails which supported the annotated transcripts (Tombácz et al., 2017, Boldogkői et al., 2018, Tombácz et al., 2019)
% % % % % % % % % % %
0 10 20 30 40 50 60 70 80 90 100
MinION dRNA-seq 1 MinION dRNA-seq 2 MinION dRNA-seq 3 MinION dRNA-seq 4 MinION dRNA-seq 5 MinION dRNA-seq 6 MinION dRNA-seq 7 MinION dRNA-seq 8 MinION dRNA-seq 9 MinION dRNA-seq 10
Distribuon of polyA tails which supported the annotated transcripts (Depledge et al., 2019)
0 10 20 30 40 50 60 70 80 90 100
PacBio RSII PacBio RSII (random) PacBio Sequel MinION cDNA-seq 1h MinION cDNA-seq 2h MinION cDNA-seq 4h MinION cDNA-seq 6h MinION cDNA-seq 8h MinION cDNA-seq 10h MinION cDNA-seq 12h MinION cDNA-seq 24h MinION cDNA-seq (random) MinION cDNA-seq (random) MinION CAP-seq (Terminator) MinION CAP-seq (Lexogen) MinION CAP-seq (Lexogen random) MinION cDNA-seq (mixed)
Distribuon of 5' adapters which supported the annotated transcripts (Tombácz et al., 2017, Boldogkői et al., 2018, Tombácz et al., 2019)
% % % % % % % % % % %
% % % % % % % % % % %
a
b
c
Fig. 8 Distribution of LRS reads used for validation of TSS and TES positions. The horizontal bar graph shows the proportion of high quality/low quality adapter sequences of the LRS reads. (a) Proportion of the 3′-adapters within our dataset derived from various sequencing approaches utilised in our study25,27. The lowest ratios were obtained from MinION dRNA sequencing, and only a small amount (<10%) of the reads were used for the annotation/validation of TES positions; whereas the highest ratios were produced by the PacBio sequencing.
identification of intron donor and acceptor sites, whereas the LRS data were used to detect novel splice variants and TES- and TSS-isoforms.
Data analysis Detection of introns was carried out by a two-step analysis (Fig. 7). First, we compared pub- lished introns19,20,22,26 with each other, then we remapped the raw data and used them to identify potentially novel introns. We also analysed the effect of the selected reference genome and the aligner on the obtained results19–27 (Table 3). The adapter sequences from raw reads of each SRS run were removed using the Cutadapt v2.6 software.
The fastp tool was used for validation. Next, we aligned the sequencing reads to the HSV-1 reference genome (GenBank: X14112.1) using minimap2 or STAR mapper for the LRS or the SRS data, respectively. The LoRTIA tool (https://github.com/zsolt-balazs/LoRTIA) was used to annotate introns, TSSs, and TESs from the LRS data (Fig. 8); whereas we used the STAR software to detect introns from the SRS samples. The previously published introns (Tang et al.20, Wishnant et al.22, and Tombácz et al.25,27) were compared with each other, reanalysed, and validated using the datasets from all of the aforementioned publications.
In this work, we assembled the sequence of HSV-1 transcripts with SeqTools/ReadConsensus scripts using our previously published LRS data27. The alignment of a transcript’s sequencing reads annotated by LoRTA to the sec- tion of the reference genome overlapped by the annotation was performed using minimap2. This was followed by variant calling using bcftools’ mpileup and call functions, and consensus sequence generation using bcftools’ con- sensus function. Read depth for each transcript was calculated by LoRTIA. To avoid sequencing errors, transcripts with a coverage of less than 30x were eliminated. This read depth is standard for MinION genome assembly31–33.
Data availability
The datasets used in this work were publicly available and were obtained from the original publications (Table 3):
Depledge et al.19, Whisnant et al.22,23, Tang et al.20, Rutkowski et al.21, Pheasant et al.24, Boldogkői et al.26, and from Tombácz et al.25,27. All data generated in this study are included in Supplementary Tables 2 and 3. The data of introns plotted in this study were obtained from Tang et al.20, Rutkowski et al.21, and from Tombácz et al.25,27. The sequence of assembled transcripts was deposited under in Figshare34: https://doi.org/10.6084/
m9.figshare.12057966.v2.
Code availability
The codes for the LoRTIA and SeqTools (the toolkits developed by our laboratory) analysis are available at:
https://github.com/zsolt-balazs/LoRTIA and https://github.com/moldovannorbert/seqtools, respectively.
Received: 21 January 2020; Accepted: 9 June 2020;
Published: xx xx xxxx
References
1. Tombácz, D. et al. Dynamic transcriptome profiling dataset of vaccinia virus obtained from long-read sequencing techniques.
Gigascience 7 (2018).
2. Sharon, D., Tilgner, H., Grubert, F. & Snyder, M. A single-molecule long-read survey of the human transcriptome. Nat. Biotechnol.
31, 1009–14 (2013).
3. Tombácz, D. et al. Full-Length Isoform Sequencing Reveals Novel Transcripts and Substantial Transcriptional Overlaps in a Herpesvirus. PLoS One 11, e0162868 (2016).
4. O’Grady, T. et al. Global transcript structure resolution of high gene density genomes through multi-platform data integration. 44 (2016).
5. Balázs, Z. et al. Long-Read Sequencing of Human Cytomegalovirus Transcriptome Reveals RNA Isoforms Carrying Distinct Coding Potentials. Sci. Rep. 7, 15989 (2017).
6. Prazsák, I. et al. Long-read sequencing uncovers a complex transcriptome topology in varicella zoster virus. BMC Genomics 19, 873 (2018).
7. Moldován, N. et al. Third-generation Sequencing Reveals Extensive Polycistronism and Transcriptional Overlapping in a Baculovirus. Sci. Rep. 8, 8604 (2018).
8. Moldován, N. et al. Multi-platform analysis reveals a complex transcriptome architecture of a circovirus. Virus Res. 237, 37–46 (2017).
9. Boldogkői, Z., Moldován, N., Balázs, Z., Snyder, M. & Tombácz, D. Long-Read Sequencing - A Powerful Tool in Viral Transcriptome Research. Trends Microbiol. 27, 578–592 (2019).
10. Looker, K. J. et al. Global and Regional Estimates of Prevalent and Incident Herpes Simplex Virus Type 1 Infections in 2012. PLoS One. 10, e0140765 (2015).
11. Harkness, J. M., Kader, M. & DeLuca, N. A. Transcription of the herpes simplex virus 1 genome during productive and quiescent infection of neuronal and nonneuronal cells. J. Virol. 88, 6847–6861 (2014).
12. Merrick, W. C. Cap-dependent and cap-independent translation in eukaryotic systems. Gene 332, 1–11 (2004).
13. Rajčáni, J., Andrea, V. & Ingeborg, R. Peculiarities of Herpes Simplex Virus (HSV) transcription: an overview. Virus Genes 28, 293–310 (2004).
14. McGeoch, D. J., Rixon, F. J. & Davison, A. J. Topics in herpesvirus genomics and evolution. Virus Res. 117, 90–104 (2006).
15. Macdonald, S. J., Mostafa, H. H., Morrison, L. A. & Davido, D. J. Genome sequence of herpes simplex virus 1 strain KOS. J. Virol. 86, 6371–6372 (2012).
16. Lim, F. HSV-1 as a model for emerging gene delivery vehicles. ISRN Virol. 2013, 1–12 (2013).
17. Hu, B., Huo, Y., Chen, G., Yang, L., Wu, D. & Zhou, J. Functional prediction of differentially expressed lncRNAs in HSV-1 infected human foreskin fibroblasts. Virol. J. 13, 137 (2016).
(b) Proportion of the 3′-adapters in the dRNA-seq dataset from Depledge’s publication. Some of the parallel dRNA-seq experiments show a higher ratio compared to our dRNA-seq data. Still, the quality of adapters is substantially worse than the other approaches. (c) Proportion of the 5′-adapters within our dataset. The PacBio adapter reads 5′-end quality significantly better than any of the MinION methods.
18. Du, T., Han, Z., Zhou, G., Roizman, B. & Roizman, B. Patterns of accumulation of miRNAs encoded by herpes simplex virus during productive infection, latency, and on reactivation. Proc. Natl. Acad. Sci. 112, E49–E55 (2015).
19. Depledge, D. P. et al. Direct RNA sequencing on nanopore arrays redefines the transcriptional complexity of a viral pathogen. Nat.
Commun. 10, 754 (2019).
20. Tang, S., Patel, A. & Krause, P. R. Hidden regulation of herpes simplex virus 1 pre-mRNA splicing and polyadenylation by virally encoded immediate early gene ICP27. PLOS Pathog. 15, e1007884 (2019).
21. Rutkowski, A. J. et al. Widespread disruption of host transcription termination in HSV-1 infection. Nat. Commun. 6, 7126 (2015).
22. Whisnant, A. W. et al. Integrative functional genomics decodes herpes simplex virus 1. bioRxiv 603654 (2019).
23. Whisnant, A. W. et al. Integrative functional genomics decodes herpes simplex virus 1. Nat. Commun. 11, 2038 (2020).
24. Pheasant, K., Möller-Levet, C. S., Jones, J., Depledge, D., Breuer, J. & Elliott, G. Nuclear-cytoplasmic compartmentalization of the herpes simplex virus 1 infected cell transcriptome is co-ordinated by the viral endoribonuclease vhs and cofactors to facilitate the translation of late proteins. PLoS Pathog. 14, e1007331 (2018).
25. Tombácz, D. et al. Long-Read Isoform Sequencing Reveals a Hidden Complexity of the Transcriptional Landscape of Herpes Simplex Virus Type 1. Front. Microbiol. 8, 1079 (2017).
26. Boldogkői, Z. et al. Transcriptomic study of Herpes simplex virus type-1 using full-length sequencing techniques. Sci. Data 5, 180266 (2018).
27. Tombácz, D. et al. Multiple Long-Read Sequencing Survey of Herpes Simplex Virus Dynamic Transcriptome. Front. Genet. 10, 834 (2019).
28. Tombácz, D., Balázs, Z., Csabai, Z., Snyder, M. & Boldogkői, Z. Long-Read Sequencing Revealed an Extensive Transcript Complexity in Herpesviruses. Front. Genet. 9, 259 (2018).
29. Boldogkői, Z., Balázs, Z., Moldován, N., Prazsák, I. & Tombácz, D. Novel classes of replication-associated transcripts discovered in viruses. RNA Biol. 16, 166–175 (2019).
30. Boldogkői, Z. Transcriptional interference networks coordinate the expression of functionally related genes clustered in the same genomic loci. Front. Genet. 3, 122 (2012).
31. Goldstein, S., Beka, L., Graf, J. & Klassen, J. L. Evaluation of strategies for the assembly of diverse bacterial genomes using MinION long-read sequencing. BMC Genomics. 20, 23 (2019).
32. Minei, R., Hoshina, R. & Ogura, A. De novo assembly of middle-sized genome using MinION and Illumina sequencers. BMC Genomics. 19, 700 (2018).
33. Giordano, F. et al. De novo yeast genome assemblies from MinION, PacBio and MiSeq platforms. Sci. Rep. 7, 3935 (2017).
34. Tombacz, D., Boldogkői, Z. & Moldovan, N. HSV transcript annotation. figshare, https://doi.org/10.6084/m9.figshare.12057966.v2 (2020).
Acknowledgements
This study was supported by grants from the National Research, Development and Innovation Office K 128247 to ZBo and National Research, Development and Innovation Office FK 128252 to DT.
author contributions
D.T. and Z.B. conceived the idea. D.T., G.T., G.G., N.M., and Z.B. conducted the analysis. D.T., M.S., and Z.B.
designed the methodology. D.T. and G.T. prepared the Figures. Z.B. and D.T. wrote the manuscript with feedback from all co-authors. Z.B. and M.S. coordinated the project.
Competing interests
The authors declare no competing interests.
additional information
Supplementary information is available for this paper at https://doi.org/10.1038/s41597-020-0558-8.
Correspondence and requests for materials should be addressed to Z.B.
Reprints and permissions information is available at www.nature.com/reprints.
Publisher’s note Springer Nature remains neutral with regard to jurisdictional claims in published maps and institutional affiliations.
Open Access This article is licensed under a Creative Commons Attribution 4.0 International License, which permits use, sharing, adaptation, distribution and reproduction in any medium or format, as long as you give appropriate credit to the original author(s) and the source, provide a link to the Cre- ative Commons license, and indicate if changes were made. The images or other third party material in this article are included in the article’s Creative Commons license, unless indicated otherwise in a credit line to the material. If material is not included in the article’s Creative Commons license and your intended use is not per- mitted by statutory regulation or exceeds the permitted use, you will need to obtain permission directly from the copyright holder. To view a copy of this license, visit http://creativecommons.org/licenses/by/4.0/.
© The Author(s) 2020