Vol. 9, No. 4, 2019 pp. 112-128 http://doi.org/10.24368/jates.v9i4.106 17 112
http://jates.org
Journal of Applied
Technical and Educational Sciences jATES
ISSN 2560-5429
EMC Measurement with GTEM Cell
Patrik Eltera, Anita Sabob, Tibor Szakállc, Bojan Kuljićd
aFaculty of Engineering and Information Technology, Boszorkány street 2, Pécs 7624, Hungary, elter.patrik@mik.pte.hu
bFaculty of Engineering and Information Technology, Boszorkány street 2, Pécs 7624, Hungary,
saboanita@gmail.com
cSubotica Tech, Marka Oreskovica 16, Subotica 24000, Serbia, szakall.tibor@gmail.com
dSubotica Tech, Marka Oreskovica 16, Subotica 24000, Serbia, bojan.kuljic@gmail.com
Abstract
Abstract: Nowadays, electromagnetic compatibility plays an increasingly important role in the development of a new equipment. When developing, attention should not only be paid to how noisy the equipment itself is, but also to how immune it is to the noise coming from the surroundings. The purpose of this article is to present an instrument used in EMC measurement on a training model and evaluate the measured results according to the given standards. In the measurements a low noise power supply panel TPS54560EVM-515 by Texas Instruments was used to power a RF absorber and a GTEM cell. The obtained results clearly showed the advantages and disadvantages of the cell construction compared with other EMC measurement procedures.
Keywords: EMC; Electromagnetic compatibility; GTEM cell
1. Introduction
One of the crucial steps in developing a device is acquiring the EMC certification. This certification can be obtained from accredited laboratories using a variety of measurement procedures.
The simplest EMC measurement procedure is to perform an Open Area Test Site (OATS) (Herr, 2013). In this case, the obtained values can immediately be compared to the standards.
A major disadvantage of this method is the environmental noise, since there is no absorbent surface in the test area, but in return, it is cheap to build (Kenneth, 2004).
Figure 1. Intel EMC test measurement(www.intel.com/content/www/us/en/design/test-and-validate/platform- testing-services/electromagnetic-testing.html)
Another method is the use of a completely or semi-echoic and electromagnetically shielded test chamber (anechoic chamber) (Hemming, 2002). Here, the test device is located in a closed or semi-open but shielded test chamber during the measurement. The great advantage of the measurement process is that there is no external noise from the environment, whereas the disadvantage is the high construction cost (Chung, 2015).
The third method uses a so-called GTEM or TEM cell (Weiss, 1991). In this method, the test device is placed in a specially crafted metal box and measured after it is sealed. Its great advantage is its small size and low price, but due to its size it can only accommodate much smaller devices (Streitwolf, 2007). It is worth mentioning that the bandwidth is smaller than the TEM cell. A major disadvantage is, when comparing it with other procedures, the correlation equation must be applied (Morgan, 2010), (Soo-Hyung, 2004).
1.1 The GTEM cell
The GTEM (Gigahertz Transversal Electromagnetic Mode) cell is suitable for measuring the radiation and immunity of electrical equipment to noise. The cell is part of a tapered,
rectangular coaxial tube feed line in which the inner and outer conductors are of equal length.
Figure 2. GTEM Cell(www.theemcshop.com/used-gtem-cells/1678-ets-lindgren-5407-gtem-test-cell.html)
At the input end, the cell is equipped with a standard 50 ohm coaxial connector for connecting the measuring RF absorber. There are usually several more coaxial connectors on the side, one or more interference-protected electrical outlets, a door, as well as various ventilation openings and possibly a fan.
The imaginary cross section of the cell is shown in Figure 3:
Figure 3. Structure of GTEM cell (by Patrik Elter)
The inside of the cell is non-reflective, which is achieved by an absorbent surface on the side opposite the apex. This surface consists of two layers. The first layer consists of ferrite tiles covering the entire side, while the second layer is made of conductive coated spikes.
Due to the absorption layer and the physical design, planar waves can be assumed in the cell with good approximation and the field strength decreases by 1/r from the input.
In the cell, the antenna acts as the septum, a rectangular asymmetric conductor.
One side of the septum has a coaxial connector and the other one has a resistance network.
The function of the resistance network in the septum is to ensure uniform current distribution and 50 ohm impedance.
Since the test area, located in the midsection of the cell (indicated as the green area in Figure 3), can be regarded as a plane capacitor with good approximation, i.e. the electric field is homogeneous in that range, the nominal field strength can be calculated as follows:
𝐸 =𝑈𝑖𝑛𝑡𝑒𝑟𝑛𝑎𝑙−𝑈ℎ 𝑒𝑥𝑡𝑒𝑟𝑛𝑎𝑙 (1)
Where: Uinternal voltage Uexternal voltage
h distance between lower shell and inner conductor.
The input power P required for immunity testing can be determined using the voltage U and the impedance Z0 = 50 , thus it is not necessary to know value of the current:
𝑃 =𝑈𝑍2
0 (2)
Thus, the required input power at the h height of the cell is:
𝑃ℎ =(𝐸∙ℎ)𝑍 2
0 (3)
For emission measurement, it is necessary to know the position of the device being measured within the cell. For this purpose, the cell has a computer-controlled manipulator that can be used to change the position of the device.
In order to be able to compare the values measured with the GTEM cell using another EMC measurement method, the emission must be measured in three positions:
• pointing towards the pointed half of the cell (z),
• upward direction (y),
• to the right of the cell (x).
Figure 4. Different measuring positions of the device to be measured (http://www.compliance- club.com/archive/old_archive/030317.htm)
Multiple positioning points (EUTs) can be added for measurement along the z-axis, such as 6, 9, and 12, so as to fine-tune the measurement. In such a case, the conversion to other measurement methods, e.g. OATS, changes.
The radiated power of a measured device can be calculated from three measured values:
𝑃 =3𝜋𝜂 ∙𝑒𝑘22𝑍
𝑐𝑆2 [𝑊] (4)
Where:
𝑆 [𝑉] = √𝑉𝑋2+ 𝑉𝑌2+𝑉𝑍2 (5)
𝑆 [𝑉|𝑑𝐵 𝑑𝐵(𝜇𝑉)] = √10𝑉𝑋|𝑑𝐵−12010 + 10𝑉𝑌|𝑑𝐵−12010 + 10𝑉𝑍|𝑑𝐵−12010 (6)
𝑘 =2𝜋𝜆 (7)
𝜂 = √𝜇𝜀 ≅ 377𝛺 (8)
VX, VY, VZ: voltages measured at different EUT positions,
S: squared sum of the measured voltages,
k: wave number 1 / m (wave number),
𝜂: the impedance of the air,
Zc: impedance of the cell,
e: cell TEM field factor in √𝛺𝑚.
The GTEM cell field factor can be determined analytically and experimentally (standard).
1.2 Conversion to open field EMC (OATS) measurement
Most of the EMC standards used in the industry have OATS limits (standard), therefore the measured values of the GTEM cell need to be converted to this measurement method (Soo- Hyung, 2004). The correlation equation below is implemented for conversion.
1.1.1. Correlation equation:
𝐸𝑚𝑎𝑥= 𝑔𝑚𝑎𝑥∙ √𝐷𝑚𝑎𝑥4𝜋𝜂𝑃 (9)
𝐸𝑚𝑎𝑥= 𝑔𝑚𝑎𝑥∙2∙𝜋∙𝑒𝜂∙𝑘 ∙√𝑍𝑠 (10)
gmax: The antenna geometry for horizontal (Formula 9) and Vertical (Formula 10) polarization.
Dmax: maximum antenna orientation, which varies from chamber to chamber with worst case value 3.
𝑔𝑚𝑎𝑥 = {
|𝑒𝑗∙𝑘∙𝑟1𝑟
1 −𝑒𝑗∙𝑘∙𝑟1𝑟
1 |
𝑚𝑎𝑥= |𝑟1
1𝑟2[𝑟22+ 𝑟12− 2𝑟1𝑟2𝑐𝑜𝑠𝑘(𝑟2− 𝑟1)]12|
𝑚𝑎𝑥
|𝑟𝑠2
12 𝑒𝑗∙𝑘∙𝑟1
𝑟1 −𝑟𝑠2
22 𝑒𝑗∙𝑘∙𝑟2
𝑟2 |
𝑚𝑎𝑥= |𝑟𝑠2
13𝑟23[𝑟26+ 𝑟16− 2𝑟13𝑟23𝑐𝑜𝑠𝑘(𝑟2− 𝑟1)]12|
𝑚𝑎𝑥
} (11)
Distance between septum and EUT:
𝑟1 = √𝑠2+ (𝑅𝑔− ℎ𝑔)2 (12)
Distance between the virtual EUT and the receiving antenna:
𝑟2 = √𝑠2+ (𝑅𝑔− ℎ𝑔)2 (13)
Figure 5. Different measuring positions of the device to be measured (IEC 61000-4-20)
S: receiver antenna distance from EUT: 30m, 10m, 3m;
hg: height from bottom of cell to EUT;
Rh: height of septum from bottom of cell generally: 1m to 4m;
To obtain the result for Emax in dB [7]:
𝐸𝑚𝑎𝑥[𝑑𝐵𝜇𝑉𝑀] = 20 𝑙𝑔(𝑔𝑚𝑎𝑥) + 10 𝑙𝑔(𝑃) + 139.5 (14) From measured voltages:
𝐸𝑚𝑎𝑥[𝑑𝐵𝜇𝑉
𝑀] = 20 𝑙𝑔(𝑔𝑚𝑎𝑥) + 20 𝑙𝑔 (|2𝜋𝑒𝜂𝑘|) + 10 𝑙𝑔 (𝑠2
𝑍) + 120 (15)
The 20 lg(𝑔𝑚𝑎𝑥)formula can be calculated at each point, or conversely, a table of pre-
calculated values for standard geometry can be used.
Following these steps, it is still possible to refine the measurement given the small test equipment and uncertainty due to the three axes. Small test devices are devices whose size is of the same order of magnitude at a given frequency.
𝑐𝑓 = 𝑥̅̅̅ − 𝑑𝑓 𝑠,𝑓− 𝑡 (16)
Where:
𝑥𝑓
̅̅̅: average difference between TEM and OATS field strength;
𝑑𝑠,𝑓: the difference between the standard deviations of multiple TEM and OATS readings;
t: radiation factor uncertainty due to rotation.
𝑥𝑓
̅̅̅ = (1𝑛∑𝑛𝑖=1𝑔𝑖,𝑓−𝑚1 ∑𝑚𝑘=1𝑜𝑘,𝑓) (17) gi,f: the recalculated value of the TEM electric field to the open space;
i: number of measurements;
n: the number of TEM waveguide measurements;
m: the number of OATS measurements;
ok,f: OATS electric field strength;
f: frequency.
𝑑𝑠,𝑓 = 𝑆𝑇𝐸𝑀,𝑓− 𝑆𝑂𝐴𝑇𝑆,𝑓 (18)
𝑆𝑇𝐸𝑀,𝑓 = √∑ (𝑔𝑖,𝑓−𝑔̅̅̅̅)𝑓
𝑛 2 𝑖=1
𝑛−1 (19)
𝑂𝑇𝐸𝑀,𝑓= √∑ (𝑜𝑘,𝑓−𝑜̅̅̅̅)𝑓
𝑚 2 𝑘=1
𝑚−1 (20)
𝑔𝑓
̅̅̅ =1𝑛∑𝑛𝑖=1𝑔𝑖,𝑓 (21)
𝑜̅ =𝑓 𝑚1 ∑𝑚𝑘=1𝑜𝑘,𝑓 (22)
If the aim is to fine-tune the measurement, the test device ought to be measured at multiple angles, such as 0°, 45°, 90°, 135 °, 180°, 225°, 270°, and 315° (standard). This leads to 8x3 measurement results, for which the electric field E for each measuring angle is as follows:
𝐸0
̅̅̅ =(𝐸0°+𝐸2 90°), . . , 𝐸̅̅̅̅̅̅ =225 (𝐸225°+𝐸2 315°) (23) For the Emax the larger one is selected, for example:
E0max= max (E0°, E90°).
Standard calculation:
𝑡90,𝑓 = √∑225°∩315°𝑘=1 (𝐸𝑙−1𝛼,𝑚𝑎𝑥−𝐸̅̅̅̅)𝛼 2 (24)
l: the number of starting positions.
The uncertainty factor for the final radiation pattern is t their average, or:
𝑡 =𝑛1∑𝑛𝑖=1(𝑡90°,𝑓) (25)
2. Measurement with the GTEM cell
There are two types of instruments to measure when measuring:
• small test instrument, the largest size of which is smaller than the maximum wavelength of the signal to be measured,
• a large or medium test device with at least one output wire or a wireless device with a maximum size greater than the wavelength of the highest frequency to be measured.
These two tools need to be distinguished because the correlation equation is to some degree uncertain for small test tools (Bozec, 2004). The inaccuracy stems from the three axial measurement procedures.
To adjust the measured value:
𝑐𝑓 = 𝑥̅̅̅ − 𝑑𝑓 𝑠,𝑓− 𝑡 (26)
where:
𝑥𝑓
̅̅̅: average difference between TEM and OATS field strength;
𝑑𝑠,𝑓: the difference between the standard deviations of multiple TEM and OATS readings;
t: the uncertainty factor of the radiation factor resulting from the rotation;
𝑥𝑓
̅̅̅ = (1𝑛∑𝑛𝑖=1𝑔𝑖,𝑓−𝑚1 ∑𝑚𝑘=1𝑜𝑘,𝑓) (27) 𝑔𝑖,𝑓: the recalculated value of the TEM electric field to the open space;
i: number of measurements;
𝑜𝑘,𝑓: OATS electric field strength;
f: frequency.
𝑑𝑠,𝑓 = 𝑆𝑇𝐸𝑀,𝑓− 𝑆𝑂𝐴𝑇𝑆,𝑓 (28)
𝑆𝑇𝐸𝑀,𝑓 = √∑ (𝑔𝑖,𝑓−𝑔̅̅̅̅)𝑓
𝑛 2 𝑖=1
𝑛−1 (29)
𝑂𝑇𝐸𝑀,𝑓= √∑ (𝑜𝑘,𝑓−𝑜̅̅̅̅)𝑓
𝑚 2 𝑘=1
𝑚−1 (30)
𝑔𝑓
̅̅̅ =1𝑛∑𝑛𝑖=1𝑔𝑖,𝑓 (31)
𝑜̅ =𝑓 𝑚1 ∑𝑚𝑘=1𝑜𝑘,𝑓 (32)
The radiation pattern uncertainty factor (t) results from the fact that the mentioned three axial measurements can be made from multiple angles, e.g., 0°, 45°, 90°, 135°, 180°, 225°, 270°, and 315° (standard). This will lead to 8x3 measurement results, for which the electric field E for each measuring angle:
𝐸0
̅̅̅ =(𝐸0°+𝐸2 90°), . . , 𝐸̅̅̅̅̅̅ =225 (𝐸225°+𝐸2 315°) (33) For Emax, the larger one from each section is selected, e.g.:
E0max= max (E0°,E90°).
Standard calculation:
𝑡90,𝑓 = √∑ (𝐸𝛼,𝑚𝑎𝑥−𝐸̅̅̅̅)𝛼
225°∩315° 2 𝑘=1
𝑙−1 (34)
l: the number of starting positions.
The uncertainty factor for the final radiation pattern is t their average, or:
𝑡 =𝑛1∑𝑛𝑖=1(𝑡90°,𝑓) (35)
3. Measuring DC / DC converter with GTEM cell
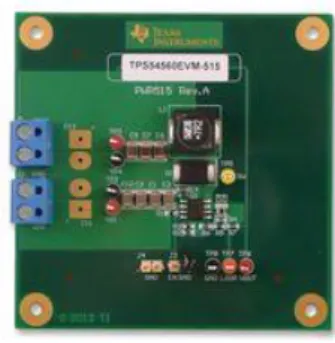
The investigation of DC-DC converters is crucial as these circuits produce the most EMC noise in the human environment. This is the underlying reason for selecting the Texas Instruments TPS54560EVM-515 Training Model. The used model aims to demonstrate the operation of the TPS54560 Step-Down converter. It allows various measurements to be made at the outgoing measuring points.
Figure 6. The TPS54560EVM-515 Demo Page (http://www.ti.com/tool/TPS54560EVM-515)
A Rohde & Schwarz ESCI (ESCI) probe and an ETS-Lindgren 5411 (GTEM) GTEM cell were used to measure the device. Rohde & Schwarz ESCI complies with EMC standards and is therefore well-suited for EMC test ratings in the 9 kHz-3 GHz range. Further, it can also be used as a conventional spectrum analyzer in addition to EMC measurements.
The GTEM cell is capable of measuring emissions and immunity. It is capable of detecting emissions in the 9 kHz - 5 GHz range and immunity can be used in the DC-20GHz range with up to 1 kW radiated power.
Rohde & Schwarz EMC32 software (EMC32) was used for measurement evaluation. This allows the comparison of different measured results. If some parameters are set for the GTEM cell, it will perform the calculations, as well.
The device was measured in three positions (Figure 4):
• laid (X axis),
• opposite the cell's edge (Y-axis),
• facing the top of the cell with its face (Z axis).
The instrument settings were as follows:
• Starting frequency: 30MHz
• final frequency: 1GHz,
• increments of 40kHz
• resolution: 120kHz
• measuring time: 100µs,
• pre-amplification: none,
• auto pre-amplification: none.
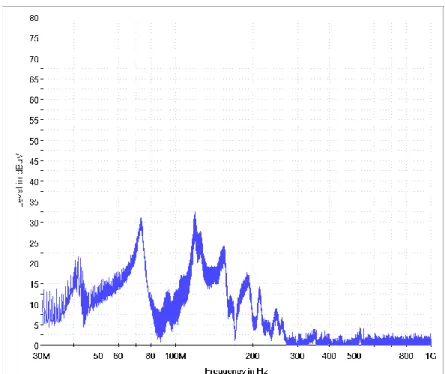
Measured values:
Figure 7. X-axis measurement result (by Patrik Elter)
Figure 8. Y-axis measurement result (by Patrik Elter)
Figure 9. Z axis measurement result (by Patrik Elter)
The three measurements are plotted in the graph below:
Figure 10. X, Y, Z Combined Measurement Results (by Patrik Elter)
Figure 10 shows that there is some difference between the measured values. The difference is caused by the fact that various metal components shield electromagnetic emissions in some directions. But it is also possible that the wires connected to the device will act as antennas at certain positions. The latter case results in highly surprising measurements.
Applying the correlation equation and converting the measured values to open field measurements presents the following graph:
By reading the values of the OATS graph (Figure 11), it can determined for a given test device whether or not it meets the requirements of the standard.
Conclusion
This paper presented the construction of small GTEM cell with low noise power supply module for measuring levels of the radiation from the electronic devices. Test performed in the accredited EMC laboratory confirmed the validity of the performed measurements. GTEM cell performed almost identical to the equipment in the accredited EMC laboratory, but was much smaller and cheaper to construct.
Presented GTEM cell has the advantage of simplifying EMC measurement which could make it valuable in developing and testing of the electronic devices.
Summary
After the measurement, the results were sent to an accredited EMC laboratory where the test instrument was weighed in an echo free EMC chamber. The results obtained were compared with those measured by the authors, presenting only a slight difference, presumably due to measurement inaccuracies.
Since the authors’ measured results matched the results of an accredited laboratory, the results were further compared to different standards in order to determine if the test tool matches them.
Two standards were tested on the test device, one for home use and one for the automotive industry.
3.1. EN 55022 classB 10m OATS
The standard specifies measurement procedures and limits set by the European Union for household appliances such as computers in the 9 kHz - 3 GHz range.
The limits prescribed by the standard are given here:
Frequency range (MHz) Field strength limit (dBmV/m)
30 - 88 39
88 - 216 43.5
216 - 960 46.5
over 960 49.5
Table 1 EN 55022classB 10m limit values (standard)
The current test device fully complied with the limits for home use devices and even had a reserve of 5dBmV / m.
3.2. CISPR 12
The standard describes EMC limits for different vehicles. This standard already sets much stricter values because electrical noise may cause malfunctions in equipment that could even lead to accidents.
Frequency range (MHz) Field strength limit (dBmV/m)
30 - 230 30
230 - 1000 37
Table 2 CISPR 12 limit values (IEC publication)
At the given limit, the test device does not meet the standard because it exceeds the limit around 110MHz. At the time of measurement, this value may be due to the connecting cables or may actually exceed the limit in the 110MHz environment of the test device.
Measurements have shown that the GTEM cell is highly valuable in developing its own electrical device and can be tested before it is released for sale. Although the presented cell has disadvantages over other EMC measurement procedures, it also features the advantage of greatly simplifying EMC measurement.
Future plans at the University of Pécs Faculty of Engineering and Information Technology include the involvement of electrical engineers and engineering IT students in EMC measurements, as well as the testing of various PCB designs, high-speed communication buses, and power electronics using the GTEM cell.
References
Morgan, 2010 - D. Morgan: A Handbook for EMC Testing and Measurement, Iet Electrical Measurement Series, 2010, ISBN 0863417566, 9780863417566
Soo-Hyung, 2004 - Soo-Hyung Kim, Jun-Young Nam, Hyun-Goo Jeon, Sung-Kook Lee: An Advanced Correlation Algorithm between GTEM and OATS for Radiated Emission Tests, Electromagnetic Compatibility, 2004, International Symposium, Volume: 1, DOI:
10.4218/etrij.95.0195.0033
Bozec, 2004 - D. Bozec, Leslie Mccormack, A.C. Marvin, A. Nothofer, M.J. Alexander: A good practice guide for the use of GTEM cells in EMC measurements according to IEC61000-4-20, Electromagnetic Compatibility, 2004, International Symposium, Volume:
2 DOI: 10.1109/ISEMC.2004.1349878
Alan Herr, Getting EMC design right first time, EMC FastPass, 2013
Kenneth L. Kaiser, Electromagnetic Compatibility Handbook, CRC Press, ISBN 0849320879, 2004
L. H. Hemming, “Electromagnetic Absorbing Materials,” in Electromagnetic Anechoic Chambers: A Fundamental Design and Specification Guide, 1st ed., NJ, USA, Wiley-IEEE Press, 2002, pp. 27-48.
B. k. Chung, “Anechoic Chamber Design,” Springer Singapore, Singapore, 2015
D.Weiss, "A user's insight into radiated emission testing with GTEM cells", IEEE International Symposium on Electromagnetic Compatibility, CherryHill, August 1991, pp.157-162.
H. Streitwolf, R. Heinrich, H. Behnke, L. Dallwitz, U Karsten, "Comparison of radiated immunity tests in different EMC test facilities", 18 th Int. Zurich Symposium on EMC.
Munich 2007, pp. 229-232.
standard: IEC61000-4-20 Electromagnetic compatibility (EMC) - Part 4-20: Testing and measurement techniques – Emission and immunity testing in transverse electromagnetic (TEM) waveguides, International Electrotechnical Commission, 2009
ESCI: https://www.rohde-schwarz.com/sg/product/esci-productstartpage_63493-11628.html GTEM: http://www.ets-lindgren.com/products/tem-devices/gtem-test-cells/13001/1300104 EMC32: https://www.rohde-schwarz.com/us/product/emc32-productstartpage_63493-8674.html IEC publication: CISPR 22 (2005-4)
Short CVs
Patrik Elter holds a degree in electrical engineering from the Faculty of Engineering and Informatics at the University of Pécs, where he currently works as a department engineer. He participated in the 2017 National Scientific Student Conference as a lecturer. He is also a regular active participant in programs organized by the Faculty. His research area is conducted and transmitted noise.
Dr. habil. Anita Szabó, professor at Subotica Tech - College of Applied Sciences and associate professor at the University of Pécs - Faculty of Engineering and Informatics. She completed her studies, bachelor to doctoral level at the University of Novi Sad - Faculty of Technical Sciences in the field of electrical engineering and computer science. She defended her habilitation in 2016 at the University of Pécs. Her main research areas are: signal processing, audio processing, education development.
Dr. Tibor Szakáll, college professor at Subotica Tech - College of Applied Sciences. He attended the University of Novi Sad – Technical Faculty ‘Mihajlo Pupin’, completing his doctoral degree in the field of informatics. His main research area includes embedded systems, communication protocols and animation.
MSc. Bojan Kuljić, assistant lecturer at Subotica Tech - College of Applied Sciences. He graduated from the Technical University of Novi Sad with a Master’s degree in Electrical Engineering and Computer Science. His main research areas focus on FPGA programing, signal processing and printed circuit design.