172
ANALYSIS OF UK-EU TRADE BALANCE
Miklos Vasary
ABSTRACT
The fact that the United Kingdom officially withdraws from the European Union on 27 March 2019 will significantly transform bilateral trade relations. Through the – till now –
‘fruitful’cooperation, both sides were able to take advantagesand thus have achieved substantial economic benefits, economic and welfare growth. It seems that the UK has been more in need of its trade, so it is becoming increasingly important on what conditions the new cooperation will operate. The possible versions are well known, the conditions are not yet. It is only visible how the evolution of the bilateral trade balance has evolved. The aim of the report is to present the specificities that emerge from the trade processes and to make findings about future cooperation.
KEY WORDS
European Union, United Kingdom, Brexit, trade balance JEL classification: Q17, F13.
INTRODUCTION
In the first point I need to present my own opinion the point that the United Kingdom (UK) will leave (Brexit) the European Union (EU) seems to be a tragedy3. For all the parties will result be resulted disadvantages and negative consequences: the EU losing one of its most important Member States and will be weakened fundamentally the UK will lose the contact to the EU’s single market and will be far from the advantages of the unions results and benefits.Still now it is highly reflected what will happen after the Brexit, and how is it possible to manage the consequences. In many cases happened to analysethe consequences and we can collect in various aspect – including but not limited to – IMF 2016, UK in a Changing Europe 2016, Brugel 2017, KPMG, 2017 UK Government 2017, 2018. If we are focusing the trade effects PWC 2018, Byrne et al 2018 described disadvantages and future problems. If we only look at the simple effect that although domestic
3 On 23 June 2016, the United Kingdom voted in a referendum to leave the EU, the Article 50 of the Treaty of Lisbon was triggered on 29 March 2017 to start the process of UK leaving the EU. As a result of this 29 March2019, at 23.00 GMT the UK leaves the EU and 31 December 2020 the transition period must finished.
173 agriculture plays a decisive role in the supply of food, its commercial activity is important. In the case of foods, the United Kingdom can only satisfy 61% of domestic consumption. (House of Lords, 2017)
Belongs the possible options generally there are 4 options to fulfil the exit in frame of the free trade:
Norway option: Staying in the EU Single Market4 and leaving the Customs Union5.
Turkey option: Leaving the EU Single Market and EU Customs Union but creating a new customs union with the EU.
Swiss option: Leaving the Single Market and Customs Union, but negotiating a new bilateral free trade and customs agreement (like Switzerland, Ukraine or Canada)
World Trade Organization (WTO) option: Leaving the Single Market and Customs Union without a deal and the trading will regulated on WTO terms, without preferential access to the EU market for services. (IMF, 2016, The Institute for Government 2017)
It can be declared that for many countries it is, or until the exit it was important to make an easy trade with UK and it seems to be, that belongs these options it will much more complex and expensive that till now.
The volume of trade between the UK and the EU27 is very significant. And in this situation, the EU27 can show a bigger surplus. EU27 exports to the United Kingdom amounted to EUR 295 billion, while imports amounted to only slightly more than half of EUR 186,1 billion.
(EUROSTAT, 2017). The importance of bilateral trade in the United Kingdom is much greater.
Bilateral trade accounts for 4% of EU GDP, while 19% of UK equivalent.6
It has proved that the EU market is important and important for all Member States. Mayer et al (2018) presented, that the single market has increased trade between EU members by 109% on average for goods and 58% for tradable services. After weighted by the size of the economy they estimated 4.4% for the average European country related the associated welfare gains from EU trade integration. Of course, not all countries have benefited to the same extent however. Welfare gains from trade are significantly larger for small open economies than large EU members. Belongs this analysis can be estimated the effect related UK as well. The single market for the goods
4The EU single market seeks to guarantee the free movement of goods, capital, services, and labourwithin the European Union. So the EU creaqted one territory without any internal borders or other regulatory obstacles. A Single Market stimulates competition and trade, improves efficiency, raises quality, and helps cut prices which resulted economic growth and easier life of European businesses and consumers.
5The Customs Union meening that no customs duties introduced on goods delivered within the customs union and members of the customs union impose common external tariff on all goods entering the EU.
6As a comparison it is interesting, that the total volume of EU-US trade is similar as the EU-UK relationship. In 2017, the EU exported EUR 375.8 billion products to the United States and imported around EUR 256.7 billion, both of which are only about 20% higher than the total trade in the UK. (EUROSTAT, 2017)
174 resulted in UK a total of 16%, related just the EU 98% is the increase volume. This is less than the EU average level, which is totally 36%, in case for EU members 109%7.
This paper is focusing to become more detailed information about the trade effects of the Brexit. So,it is necessary to analyse the trade flow, truth the trade balance between the EU Member States.
MATERIALS AND METHODS
To present UK trade processes related the EU, it is needed to use the database the European Union Statistical Office, EUROSTAT. Following the harmonized EUROSTAT data, the extent and timing of bilateral trade in goods can be quantified too. Prior to presenting the results, however, it is necessary to record some fundamental conditions:
For country-by-country data, breakdown by sector and product ranges is based on the SITC (Standard International Trade Classification) and the freight rates available in the harmonized system. To reduce the amount of data it is needed to use just aggregated data, at level of SITC 1 digit. This paper focusing on just goods, analysing the flow of tradable services will be not concern.
The analysis will be using the aspect from the UK, therefore – if it will be not clearly mentioned – the export will be equal with the export from the UK to the partners and the import will meaning trade flow to UK.
During the examination of the trade process between the UK and other Member States will not consider the distorting effects of VAT fraud on the internal market or the illegal trade in certain sectors, the fluctuation the exchange rates.During this it will be not selected and corrected the distortion related possible different data of the national statistical offices.
In certain commodities, it should be accepted by intra and extra EU trade that values in many cases do not indicate that the country of entry or exit and the country of destination are the same. A loading site will be consideredon the basis of the statistical register, although it will be further transported to other countries the internal market. This results in the role and significance of some major trading countries becoming unduly overvalued.8
7 If we are seeing the flow of tradable services, UK was able to use the advantages of the single market much better.
The total increase was 36%, the EU related 65%, which are higher than the EU average 29% and 58% (Mayer, 2018)
8For Belgium and the Netherlands the statistical values may be inaccurate. Ports in Belgium and in the Netherlands are the most important transit hubs, and through this, the United Kingdom's land-based, Europe-wide and global trade flows. Some of these "Belgian" and "Dutch" exports were originally from the continent or from the rest of the world, and some of the imports from the United Kingdom are not intended for Belgian or Dutch markets. It can be notes that according to data compiled by the Dutch Statistical Office in the Netherlands, transit exports account for 48% of all
"European" exports, so almost half of the export of goods to the rest of Europe from the Netherlands is actually reexported. For imports this value is 38%. (Statistics Netherlands, 2016)
175 As possible methods during analysing trade processes, it is possible to use comparative analysis and the aggregated value of trade balance. The export-import balance that depicts the country’s export import difference plastically.
ij ij I /
E x m
B
Where BE/Igives the sum of balance, xij, is the sum of export value of the given country, and mijis the sum of the similar values of import.
RESULTS AND DISCUSSION
If we are analysing a longer period can be see, that by the main group of goods UK is net importer. Both the EU and the non-EU countries can be traced negative trends from 2000-2017 period. The negative trade balance gradually increased over the period. This was even though the trade deficit fell short of the period in the non-EU countries. Especially after the 2010 the EU related trade has been increased progressively.
Figure 1. UK trade balances with EU and non-Eu countries from 2000-2017 Source: author’s editing based on Eurostat 2018
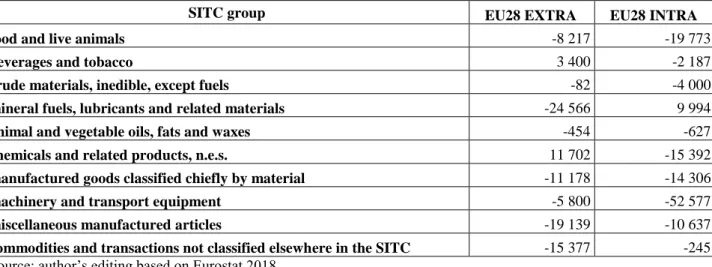
However, according to Eurostat data byall major SITC product groups, the trade balance is negative too. Which means that the EU's largest trade deficit can be presented in 2017 in value of EUR 174 billion. If we are separating by different groups of categories can be analysed the EU intra and the EU extra results as well. (2. Figure)
176
Figure 2. UK trade balances in world trade (SITC categories, 2017) Source: author’s editing based on Eurostat 2018
We can see, that UK is able to present less negative trade balance related the non-EU countries, the total value is -69.7 million euro, instead of value of the Intra EU is -109.7. In case of the EU external partner the group of beverages and tobacco (3 400 million euro) and chemicals and related products (11 702 million euro), presenting positive balance. In the frame of the EU trade just in the case of the group of mineral fuels, lubricants and related materials is the UK export higher than the EU import (the balance is 9 994 million euro).
Table 1. UK intra and extra EU trade balance in different SITC groups (million euro, 2017)
SITC group EU28 EXTRA EU28 INTRA
food and live animals -8 217 -19 773
beverages and tobacco 3 400 -2 187
crude materials, inedible, except fuels -82 -4 000
mineral fuels, lubricants and related materials -24 566 9 994
animal and vegetable oils, fats and waxes -454 -627
chemicals and related products, n.e.s. 11 702 -15 392
manufactured goods classified chiefly by material -11 178 -14 306
machinery and transport equipment -5 800 -52 577
miscellaneous manufactured articles -19 139 -10 637
commodities and transactions not classified elsewhere in the SITC -15 377 -245 Source: author’s editing based on Eurostat 2018
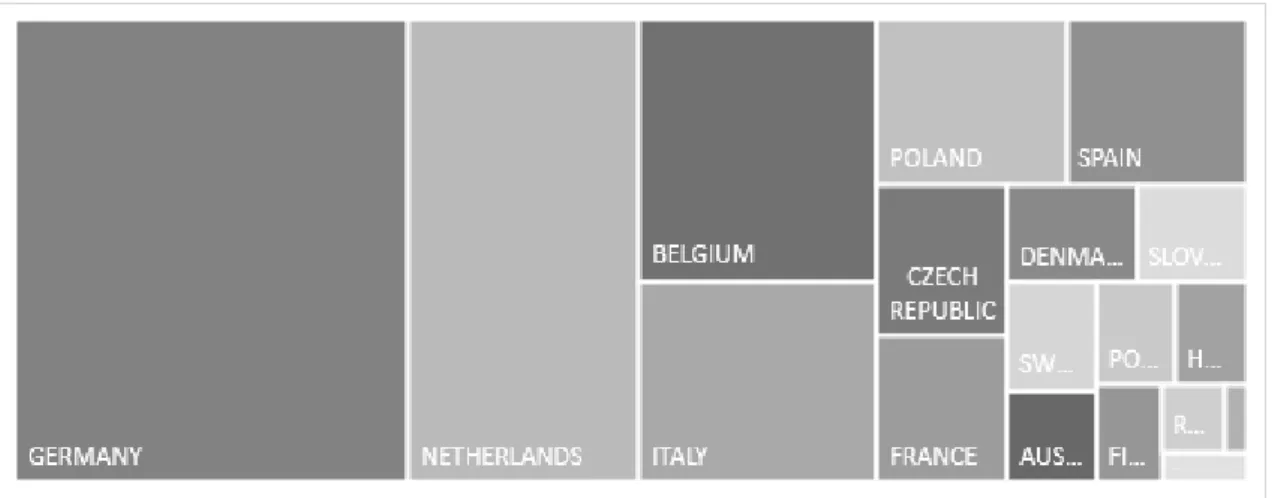
By the analysis of the trade balances it can be see, that by the trade flow is by Germany is the biggest, 33,6 % of the total trade balance is linked to this country. (Figure 3)
177
Figure 3. Share of countries in the UK-EU trade balance Source: author’s editing based on Eurostat 2018
After this Netherland (19,7%), Belgium (11,5%), Italy (8,8%) and Poland (5,8%) coming. So, related these countries could be the resulted the most negative consequences the possible change of trade after the Brexit if we are seeing the trade balance. However, in the case of smaller countries shown in the figure 3, it is important to treat the negative impacts due to detachment. In these countries, the change in the English trade surplus may result in mutually beneficial effects on domestic markets and trade with other countries.
CONCLUSION
As a rule, UK has basically taken advantage of the benefits of the EU single market. The country used the opportunities of free trade.This resulted the expansion of domestic supply and more efficient use of resources. As a result – it is presumed and in a general way that – the delivery of raw materials and low value-added products (e.g. food) and the delivery of more advanced products (e.g. drinks, chemicals) were significant. This - indirectly - made it possible to develop advanced tradeable service exports.It was presented that the deficit of the UK trade balance has gradually increased over the presented period, because of the increase in sales in the EU.Therefore, it would be important to negotiate an agreement with the EU countries to facilitate and develop trade options(mainly Norwegian, even Turkish or at least Swiss option).other alternative option could be the process which will resulted forced trade agreements with non-EU countries and increase the bilateral trade flows.
178 REFERENCES
Byrne, S, Rice, J. (2018), The impact of non-tariff barriers on EU goods trade after Brexit, Retrieved 7 August 2018 from https://voxeu.org/article/impact-non-tariff-barriers-eu-goods- trade-after-brexit
EUROSTAT (2018), Traditional international trade database access (ComExt), Retrieved 21 April 2018 from http://epp.eurostat.ec.europa.eu/newxtweb
Statistics Netherlands (2016), “Im-, export, transit trade; value weight”,Retrieved 19 February 2017 from http://cbs.overheidsdata.nl/82007ENG
House of Lords, Select Committee on the European Union, Energy and Environment Sub- Committee(2017), Corrected Oral Evidence: Brexit: Agriculture, Retrieved 18 December 2017 from data.parliament.uk/writtenevidence/committeeevidence.svc/evidencedocument/eu- energy-and-environment-subcommittee/brexit-agriculture/oral/47102.html
International Monetary Fund (2016), United Kingdom, Selected Issues, IMF Country Report No.
16/169
The Institute for Government (2017), Why are people talking about this
(again)?,Retrieved6January, 2018
fromhttps://www.instituteforgovernment.org.uk/explainers/options-uk-trading-relationship-eu
KPMG (2017), The Brexit effect on EU nationals
https://assets.kpmg.com/content/dam/kpmg/uk/pdf/2017/08/the-brexit-effect-on-eu- nationals.pdf
Mayer, T. Vicard, V. and Zignago, S. (2018), The Cost of Non-Europe, Revisited, Banque de France Working papers WP #673
PWC (2016), Brexit Monitor The impact of Brexit on (global) trade, Retrieved 5 August 2018 from https://www.pwc.nl/nl/brexit/documents/pwc-brexit-monitor-trade.pdf
Sapir, A.Schoenmaker, D. and Véron N (2017), Making the best of Brexit for the EU27 financial system policy brief, FEBRUARY 2017 Brugel
UK Governement (2017), The United Kingdom’s exit from and new partnership with the European
Union Retrieved 18 May 2017 from
https://assets.publishing.service.gov.uk/government/uploads/system/uploads/attachment_data/
file/589191/The_United_Kingdoms_exit_from_and_partnership_with_the_EU_Web.pdf UK Governement (2018), The future relationship between the United Kingdom and the European
Union, Policy Paper,Retrieved 5 August 2018 from
https://assets.publishing.service.gov.uk/government/uploads/system/uploads/attachment_data/
179 file/725289/The_future_relationship_between_the_United_Kingdom_and_the_European_Uni on_-_large_print_.pdf
UK in a Changing Europe and Political Studies Association of the UK (2016), Brexit and beyond, how the United Kingdom might leave the European Union, Report Retrieved 7 March 2017 from http://ukandeu.ac.uk/research-papers/brexit-and-beyond-how-the-united-kingdom-might- leave-the-european-union/
*The scientific paper from International Scientific Correspondence Conference EAEP 2018, October 21–23, 2018 (Prešov, Slovak Republic).
CONTACT ADDRESS
Miklos Vasary, PhD., Institute of Economics and Business Science, Budapest Metropolitan University, Nagy Lajos királyútja 1-9. 1148 Budapest Budapest Hungary e-mail:
mvasary@metropolitan.hu