Athens Institute for Education and Research ATINER
ATINER's Conference Paper Series FIN2018-2484
Erzsébet Németh Professor
Metropolitan University of Budapest Hungary
How Does the Socio-Economic Environment Influence Financial Literacy Comparison of the OECD 2010 and
2015 Research Results in Hungary
An Introduction to
ATINER's Conference Paper Series
Conference papers are research/policy papers written and presented by academics at one of ATINER’s academic events. ATINER’s association started to publish this conference paper series in 2012. All published conference papers go through an initial peer review aiming at disseminating and improving the ideas expressed in each work. Authors welcome comments
Dr. Gregory T. Papanikos President
Athens Institute for Education and Research
This paper should be cited as follows:
Németh, E., (2018). “How Does the Socio-Economic Environment Influence Financial Literacy Comparison of the OECD 2010 and 2015 Research
Results in Hungary”, Athens: ATINER'S Conference Paper Series, No:
FIN2018-2484.
Athens Institute for Education and Research
8 Valaoritou Street, Kolonaki, 10671 Athens, Greece
Tel: + 30 210 3634210 Fax: + 30 210 3634209 Email: info@atiner.gr URL:
www.atiner.gr
URL Conference Papers Series: www.atiner.gr/papers.htm
Printed in Athens, Greece by the Athens Institute for Education and Research. All rights reserved. Reproduction is allowed for non-commercial purposes if the source is fully acknowledged.
ISSN: 2241-2891 03/08/2018
How Does the Socio-Economic Environment Influence Financial Literacy Comparison of the OECD 2010 and 2015 Research Results in Hungary
Erzsébet Németh Professor
Metropolitan University of Budapest Hungary
Abstract
Many research and public sources point out from time to time that in Hungary there is a lag behind the developed countries in terms of the financial knowledge of the population and the practical application thereof. Between 2010 and 2015, the economic and financial situation of Hungary and the Hungarian population was marked by fundamental changes. In our research, we sought to find out how this affected the financial literacy of the population. Our research database was based upon the OECD surveys conducted in 2010 and 2015 on the assessment of domestic financial literacy. The differences between the answers to the same questions of the two surveys were examined by means of regression analysis and variance analysis. We found that there were several significant changes between the two surveys. In 2015, there were fewer persons who entrusted their financial decisions to others, and there are also a lower number of persons struggling with financial problems, but at the same time the number of those preparing budgets and having savings has also decreased. We performed less well in financial knowledge related issues in 2015. From the point of view of attitudes, a shift can be observed towards lower awareness. In 2015, Hungarians were less concerned about their finances, they preferred to spend their money and they were less likely to have long-term goals. The results of the survey show that after the personal financial crisis (indebtedness, constraints, and unemployment) observed in the year 2010, Hungarians were experiencing a sense of liberation in 2015: delayed consumption was followed by spending. At the same time, it should be pointed out that this was not achieved by borrowing, but by the use of increased income.
Keywords: environment, financial decisions, financial literacy, OECD, saving behaviour, socio-economic
Acknowledgments: This work was created in commission of the National University of Public Service under the priority project KÖFOP-2.1.2-VEKOP-15- 2016-00001 titled „Public Service Development Establishing Good Governance”
the Budapest Metropolitan University and Financial Compass Foundation
Introduction
Many research and public sources point out from time to time that in Hungary there is a lag behind the developed countries in terms of the financial knowledge of the population and the practical application thereof. However, from among these research activities, only the research projects based on the OECD methodology supported by the Pénziránytű Foundation can provide a true picture of the situation in Hungary on financial literacy. Namely, these research projects are based on internationally recognized methodology, not only allowing for international comparisons, but also making it possible to measure the changes based on repeated research. The first results of the research suggest that the number of people with severe financial problems has declined since the crisis, but the level of financial awareness (planning, budgeting) has deteriorated (Pénziránytű Foundation 2015).
Despite the fact that OECD research is unique in Hungary both in terms of methodology and results, so far only one research report has been prepared, which uses descriptive statistical methods that are less suitable for demonstrating the results and inferring scientific conclusions. It is therefore essential that databases presenting the results of the research are reworked using scientific mathematical statistical methods, and from those, domestic and international comparative analyses are performed and relevant and credible conclusions drawn, thus forming the basis for directions and strategies for developing financial literacy in Hungary.
Literature Review
The Importance of Enhancing and Measuring Financial Literacy
The complexity of needs and the market is unfortunately accompanied by a low level of financial knowledge and financial literacy (Chen and Volpe 1998, Volpe et al. 2006, Lusardi and Mitchell 2014). In Hungary, a study of the three dimensions of financial literacy reveals that a high level of financial knowledge and attitudes does not lead to adequate, responsible and future-oriented financial behaviour (Kenesei 2014).
According to the OECD study: "Financial literacy is a combination of awareness, knowledge, skills, attitudes and behaviours that are needed to make sound financial decisions and, ultimately, to achieve individual financial well-being”
(Atkinson-Messy 2012: 14). Though the phenomenon had existed before, the term financial literacy was first used in the early 1900s (Kovács et al. 2014: 439).
The measurement of financial literacy – just like its definition – involves the use of several methods. The simplest, hence the most frequently used method is to measure financial awareness, which can only capture some aspects of financial literacy. Therefore, measurement has recently been extended to investigate the skills necessary to make financial decisions (Kempson 2009, MNB 2014). The situation is more difficult if we also want to measure the normative, value-based and attitudinal components of behaviour, since these cannot be interpreted in terms of better or worse categories. It depends on the concrete situation what kind
of behaviour leads to consequences that are beneficial (or detrimental) to the individual. Thus, these components of financial literacy can only be interpreted at the level of nominal measurement. In this sense it is misleading to talk about a high or a low level of financial literacy, as we often see it in the everyday use of the concept (Czakó et al. 2011).
Plakalovic (2012) points out in relation to the study of managers of small and medium-sized enterprises that financial intelligence and analytical skills have to be treated as an integral part of financial literacy, and therefore the decision-making ability of the individual to choose from different financial opportunities is crucial.
In Hungary, in connection with financial literacy, interesting and novel results were produced along with financial personality research. Research by Németh et al.
(2016) identified various types of financial personality by a test containing 36 statements that also predict the characteristics of the financial literacy of individuals.
The personality profiles that have emerged are: small cash, frugal; “money pit”; order generates value; price sensitive; gatherer; planner; some by hook and some by crook;
hard-working; cannot control their finances. Awareness and diligence positively indicate the level of financial literacy of a person (Németh et al. 2016).
The development of financial literacy is in the joint interest of every economic agent. At the micro level the households and enterprises with more advanced financial literacy have a greater chance of avoiding financial decisions which are detrimental to them, such as expensive loans, or little savings (Atkinson and Messy 2012, Czakó et al. 2011). As for macro-economics, Klapper et al. (2012) concluded that the more advanced the financial literacy of a society is, the more money people save in that country. In addition, a study conducted with the coordination of the World Bank stresses that the financial literacy of the population also contributes to the stability of the financial system.
The standard of financial literacy affects the effective management of economic and income shocks both on the individual and national levels. Németh et al. (2016) examined the training courses aimed at developing financial literacy in Hungary. It was found that 90% of this market was covered by four major organizations, and students in public education were over-represented in this field. The training courses are of short duration and at the same time involve many subjects, which do not help deepening of knowledge. Measuring effectiveness is most often missed, though it would be a very important part of further training. They believe that state involvement should be strengthened to also reach the social groups in need and to start developing financial literacy for them as well. Based on their research results, they propose the national renewal of the development of financial literacy (Németh et al. 2016).
The OECD Financial Literacy Research and Variables Involved
The OECD is working on the development of practical tools and methodologies at the G20’s request to measure financial literacy as precisely as possible. The OECD/INFE international research on the measurement of financial literacy studies a total of 51,560 persons aged between 18 and 79, from 30 different countries. Hungary also joined this research stream. The OECD financial literacy survey covers a number
of areas: financial behaviours and habits - including savings behaviour, product knowledge and use - financial attitudes and financial knowledge.
Consumers’ financial behaviour is an important area that should be examined from several aspects. With the development of financial markets, financial products are also becoming increasingly complicated and complex (Habschick et al. 2007, Botos et al. 2012). At the same time, not only financial products, but individual needs also change. Some of the research on financial behaviour approaches consumer finance and financial behaviour from the direction of household or family finances.
Deacon and Firebaugh (1988) also did so when the focus of their research in the area of consumer finance was placed on the family as a unit, and the management of family resources within financial behaviour was closely examined by them. In their definition, the management of family resources means “designing and implementing the use of resources as required” (Deacon and Firebaugh 1988: 8). Households are the focal point of an analysis concerning a domestic study (Botos et al. 2012), where the following aspects of financial behaviour are taken into account): income, savings, use of foreign resources, cash flow. Looking at the macro level, Béres and Huzdik (2012) also use these indicators in their study of the financial literacy and financial behaviour of the population. In his study (2010), Xiao defines financial behaviour as any human behaviour that can be relevant to personal finances. His definition also includes cash management, savings and credits. The review of several other financial behaviour models and definitions (Shockey and Seiling 2004, Peng et al. 2007, Chen and Volpe 1998, Perry and Morris 2005, Danes et al. 1999) suggests that financial behaviour has the following elements: definition of goals, planning, saving, keeping income and expenditure records, checking expenditures, future orientation, sharing information and communication on finances (Zsótér et al. 2012).
The financial attitude refers to the valuation of money and finances. Our attitude towards money is a function of our personality, which can be significantly influenced by social expectations, demographic characteristics, economic circumstances and the educational system (Hornyák 2015). From the point of view of financial attitudes, childhood experiences are decisive, money-handling is already established in childhood and can only be changed later very slowly and with difficulty (Hornyák 2015). Identification with or opposition to the parental example determine the individual’s attitude to money throughout their life. Research has shown that through this early intensive learning process, children have a variety of attitudes and emotional attributes assigned to money as a means that strongly influences their financial behaviour in their adult years (Nagy and Tóth 2012, Zsotér and Nagy 2012).
In the majority of studies, there is no distinct separation of financial attitudes and money attitude (Goldberg and Lewis 1978, Yamauchi and Templer 1982, Furnham 1984, Tang 1992, Nagy and Tóth 2012). Some authors, however, choose to approach financial attitudes from the direction of management and use of money (e.g. Furnham 1999). Several authors research this area by exploring attitudes towards credit (e.g.
Norvilitis and Mendes 2013). The importance of researching financial attitudes is supported by the fact that the treatment of money is hardly rational, but rather governed by often unrecognised emotional forces (Forman 1987). In Hungary, a research on young people has shown that we cannot talk about homogeneous groups with regard to financial attitudes and behaviour. There were conservative, rebellious
and experienced young people studying in higher education among those involved in the study (Zsótér et al. 2012).
Financial knowledge in some research is matched with financial literacy, in our opinion, incorrectly. We consider it important to treat knowledge both at research and training level as part of financial literacy, but let us not forget about the additional, other elements also mentioned above. Some research attributes financial knowledge to the knowledge of products, knowledge of concepts or the existence of mathematical knowledge required for finances (Hastings et al. 2012).
Xiao et al. (2014) breaks financial knowledge up into subjective and objective elements, which also underlines the fact that financial knowledge cannot be discussed in general, but it is necessary to examine it in contextualised form, by way of different levels. According to Huzdik et al. (2014), there is a substantial difference between the actual and assumed financial knowledge of young people in higher education.
According to researchers, the level of risk taking is determined by the way individuals perceive their own knowledge, i.e. by self-perception, rather than actual financial knowledge. In terms of risk appetite, our research showed that risk adverse behaviour is characteristic of young people, with three-quarters of the 18–25 age group (76.9 per cent) avoiding risks. In their analysis, they created the Self-perception Index, which compares real economic-financial knowledge with assumed knowledge. Based on this, we distinguish three categories:
1. those who underestimate themselves, whose actual knowledge is greater than their assumed knowledge,
2. those who assess their knowledge realistically,
3. Those who overestimate themselves, whose actual knowledge is lower than their assumed knowledge.
According to Luksander et al. (2014), the financial knowledge of young people exhibits significant differences among several criteria. Males, older people, people with a higher income and young people whose income is covered by their family only to a small extent are typically characterised by more advanced financial literacy. The results demonstrate that the financial-economic knowledge acquired in higher education has a beneficial impact on the financial knowledge of young people; on the other hand, the type of training and studies does not have any significant effect. Our analyses also revealed that the teaching of financial-economic topics in secondary school does not have any influence on the level of young people’s financial knowledge.
Methodology
In this study, we compare the results of the OECD 2010 and 2015 data collections with regard to Hungary. Five years passed between the dates of the two surveys, so we can make comparisons between the two cross-sectional surveys. The sample consisted of 1,003 persons in 2010 and of 1,000 persons in 2015. In the 2010 and 2015 questionnaires, there are completely identical questions, but not all of them
have their matches. In this study, we only examine questions that were included in both questionnaires. By highlighting the appropriate variables in the two databases, we created a common database, indicating the year which the given answer belongs to. In many cases we have performed re-encoding, because although the question was the same during the two surveys, the answers were not the same everywhere. All of this enabled us to investigate whether there was a significant difference between the results of the two surveys using multinomial logistic regression analysis. During the analysis we also examined the effects of demographic variables. For some variables (e.g. attitudinal statements), we performed a variance analysis, examining whether there is a significant difference between averages.
Results
Financial Behaviour Questions
The financial behaviours in the 2010 and 2015 surveys focused on the following areas: making financial decisions, budgeting, savings behaviour, financial problems and solutions, knowledge and use of financial products.
Making Financial Decisions
Financial decisions can be made by individuals alone, together with others, and they can entrust the decision to others. The results of the multinomial logistic regression analysis show that there are significant differences among the patterns observed at the time of the two data collections. This difference is also nuanced by demographic variables, so the result varies by gender, region and age.
The proportion of those making financial decisions alone in 2010 was 30.0%, which is the same in 2015. The proportions of those who have others make financial decisions for them, i.e. of those who practically release the responsibility and control of these decisions from their hands dropped by 2015. The rate was 11% in 2010, and only 5.8% in 2015. The proportion of those who make decisions together with others was 59.0% in 2010 and 64.1% in 2015. The results are shown in Figure 1.
1. Individual and Group Nature of Financial Decisions in 2010 and 2015 on the Basis of OECD Data
11%
59%
30%
5,80%
61%
30,10%
0% 10% 20% 30% 40% 50% 60% 70%
Decision made by another person Joint decision together with another person Individual decision
Nature of financial decisions in 2010 in 2015.
2015 2010
*
*
Source: Author.
Note: ** P<0.005 ***; P <0.0001
Changes can be further broken down based on the gender and the age of respondents and by region. In 2010, 9% of women gave the decision into the hands of others, but this rate dropped significantly by 2015, reaching 3.8%. Men also show a similar significant decrease, as in 2010 decisions were made by others for 13.2% of them, which rate is only 8% in 2015. For both men and women, the proportion of those who make decisions together with others has increased, but this is only statistically significant for men, with an increase from 62% to 68.6%. As for age, we can state that the younger someone is, the truer it is that others take decisions for them. The impact of age is stronger in 2015 (beta: -0.174) than in 2010 (beta -0.103).
Budgeting
We have run a binary logistic regression model in relation to budgeting, in which the dependent variables indicate whether the respondent is preparing a budget or not, and independent variables are the date of data collection, age, gender and region. The effect of the date of survey, age and non-variables is significant, but the effect of the region is not.
Based on the results of the 2010 survey, 32.3% of respondents said that they were preparing a budget. This ratio dropped significantly to 24.8% by 2015. The proportion of those who prepare a budget has decreased significantly among women, from 37% to 26%, as shown in Figure 2.
**
*
2. The Proportion of Female and Male Respondents Preparing a Budget in 2010 and 2015 on the Basis Of OECD Data
27,0%
24,0%
37,0%
26,0%
0,0% 5,0% 10,0% 15,0% 20,0% 25,0% 30,0% 35,0% 40,0%
Budgeting in 2010 and 2015
2010 2015
***
Men
Wome
Source: Author.
Note: *** P <0.0001
Savings Behaviour
In the questionnaire on savings, one question was whether the respondent had any savings and, secondly, if so, where and in what form. In 2010, 49.4% of the respondents said they did not have any savings. This rate was higher in 2015, 56.1%.
At both dates, collecting money in a retail current account was the most typical form of savings. In addition, there was money collected in savings accounts (12% of respondents in 2010, 11% of respondents in 2015), and money held in homes (8.8%
of respondents in 2010, 10.9% of respondents in 2015). Choosing the informal savings club as a form of savings almost completely ceased by 2015, dropping from 4.4% to 0.4%. However, the proportion of those choosing investment products has increased; from 0.2% to 2.9%.
Financial Problems and Livelihood Problems
At both data collection dates, the questionnaire contained a question that referred to whether a respondent had a situation in the past 12 months where they did not know how to cover their living expenses from their income. For this question we have run a binary logistic regression test to find out whether there is a significant difference among the answers to the question in terms of the two data collection dates. The effect of the date of survey, gender and age are significant, the effect of the region is not significant.
In 2010, 33.8% of respondents claimed that they had been faced with a situation where the coverage of daily living costs was in danger in the past 12 months. This ratio was 25.6% in 2015, it reduced significantly. The decrease is significant for both women and men, as illustrated in Figure 3.
3. The Occurrence of Financial Problems among Women and Men in 2010 and 2015 on the Basis of OECD Data
29,0%
24,0%
35,0%
33,0%
0,0% 5,0% 10,0% 15,0% 20,0% 25,0% 30,0% 35,0% 40,0%
Financial problems occurring in 2010 and 2015
2010 2015
***
**
Men
Women
Source: Author
Note: ** P<0.005 ***; P <0.0001
According to the 2010 data, the younger someone is, the more characteristic it is that they have a financial problem, although age indicates only to a small degree the probability of a financial problem (the beta value in the regression model is -0.016).
Based on the 2015 data, this relationship can no longer be supported.
To mitigate the problem, various steps should be taken. The questionnaire contained many of these options, which are presented in Figure 4.
4. Answers to Financial Problems in 2010 and 2015 on the Basis of OECD Data
14,8%
9,0%
3,9%
21,5%
23,4%
30,7%
51,6%
6,5%
7,4%
9,7%
15,9%
19,5%
50,2%
67,6%
-10,0% 0,0% 10,0% 20,0% 30,0% 40,0% 50,0% 60,0% 70,0%
Answers regarding financial problems in 2010 and 2015
2010 (N=339)2 2015 (N=256)
***
***
***
**
Note: ** P<0.005 ***; P <0.0001 Source: Author.
The most typical solution in 2010 was that respondents reduced their spending; they spent less, and gave up certain things. This solution represents the highest rate also in 2015, but it can be seen that this solution was chosen by significantly fewer persons. Also, significantly fewer people chose the option of borrowing (loans or credits). Compared to 2010, the proportion of overtime and additional work commitments, late payment of invoices, or failure to pay, sales of assets (14.8% vs. 6.5%) was more characteristic in 2015.
Loss of Main Source of Income
Someone may lose their main source of income and the question regarding how long they are able cover their expenses arise. The question in that respect was: If you lost your main source of income, how long would your household be able to cover your livelihoods without having to take out a loan or having to move?
The multinomial logistic regression analysis was performed for the variable arising from the question, including the date of data collection and other demographic variables. After running the model, it can be established that there are no significant differences among the results of the two surveys on this issue. It is worth mentioning that most respondents chose at least one month but less than three months as options
Expenditures reduced Loan taken out
Additional work done
Late payment of invoices
Withdrawal from savings
Other
Sales of assets
in both of the two surveys: This means 27.6% in 2010 and 26.1% in 2015 for respondents.
Knowledge, Possession and Use of Financial Products
Issues related to the knowledge, possession and use of financial products were not exactly the same in the two surveys, so we highlighted the products and services that were included in both databases. These are the following:
pension funds,
investment accounts, such as investment funds,
credit cards,
current accounts,
insurance,
shares,
Bonds.
We have also created variables for the knowledge, possession and use of products and services by calculating the total number of the items listed chosen by one respondent. Thus, product knowledge, product ownership, and product usage vary between 0 and 7.
In the first case, the question sounded “Have you ever heard of one of the following financial products?” (Product knowledge). In the second case, the question was whether the respondent “has one of the following products” (product possession).
In the third case, the question was “Which of the following products was used by them in the past two years and is also currently used?” (Product use).
For each of the three variables, we examined by linear regression whether the two data collection dates and demographic data (age, gender, and region) affect the level of product knowledge.
3.1% of product variance is explained by the model. The date of survey and age indicate a significant effect. The average variable value of product knowledge was 5.3 in 2010, compared with 5.8 in 2015, being significantly higher, which means that of the above mentioned 7 products on average more types were heard of at the later date of survey. Regarding the age of the respondents, younger people know more than one product, and with age increasing product knowledge is significantly reduced.
4.5% of the variance of product possession as a dependent variable is explained by the independent variables (date of survey, gender, age, region). In the model, the data capture date, age and region indicate a significant effect. In 2010, respondents possessed an average of 1.84 out of the 7 financial products listed. This indicator is 1.51 in 2015, which is significantly less. Looking at the difference at the level of regions, we can point out that in 2010 the least financial products were possessed in the Northern Great Plain, and most of them in the Central Transdanubian region. In 2015, the Northern Great Plain remained the lowest ranked in this respect, and on average, most of the products were possessed in the South Transdanubian region.
There is a weak negative correlation between the respondents’ age.
The model explains the 10.6% rate of the variance of product use. The data capture date and age have a significant effect on product use. In both years, the maximum value of the variable was 6, which means that in the sample of 2,003 in total, there was no person who would have used all 7 listed financial products at the same time. In 2010, an average of 0.99 products, while in 2015, 0.36 products on average were used by respondents. Age has a weak negative impact on product use.
Financial Knowledge
5. The Proportion of Good Answers to Financial Literacy Questions in 2010 and 2015 Based on OECD Data
Source: Author.
Note: ** P<0.005 ***; P <0.0001
Financial literacy statements can be classified into 8 types. For each type, a task- related question has been formulated or a statement to be decided whether it is true or false. For each financial literacy question we have created a variable that shows whether the respondent has answered the question correctly or not. From these variables, we later also formed a variable measuring the overall knowledge by simple addition. As a first step, with the help of a variance analysis we identified for which
knowledge measurement variables there is a significant difference between the results for 2010 and 2015. The results are shown in Figure 5.
There are six questions in total where there is a significant difference in the results. In one case, the 2015 database has a significantly higher response rate. This is the interpretation of inflation. In the other cases, it is the 2010 results that show a significantly better response rate. There is a remarkable difference in the course of examining the question of compound interest, since in 2010, 60% of respondents were able to answer the question correctly and in 2015 only 34%.
The results of the linear regression analysis performed on the overall knowledge variable show that the data collection date and age have a significant effect on how many good responses have been given by someone in total. The model explains 3.7%
of the variance of overall knowledge. In 2010, out of 8 questions, respondents were able to answer 6.18 questions correctly on average, and in 2015, 5.7 on average; so financial knowledge decreased significantly in total. In respect of the relationship between the ages variable and financial knowledge it can be concluded that there is a weak negative relationship between financial knowledge and age.
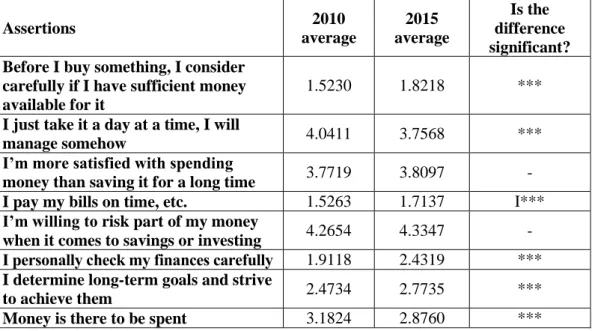
Financial Attitudes
During the 2010 survey, a total of 8, and in the 2015 survey a total of 12 statements were used to measure financial attitudes. As the 8 statements used in the 2010 survey were also used with a slight deviation in the 2015 survey, we have made a comparison between those. Answers to these statements were shown on a Likert scale from 1 to 5, where 1 indicated “fully agree”, while 5 “entirely disagree” with the statement. A variance analysis was performed on the averages of responses and we examined whether the results of the 2010 database differed significantly from the 2015 database results. Our results are shown in Table 1.
Table 1. Average Values of Financial Attitude Statements in 2010 and 2015 on the Basis of OECD Surveys (1: Fully Agree, 5: Entirely Disagree)
Assertions 2010
average
2015 average
Is the difference significant?
Before I buy something, I consider carefully if I have sufficient money available for it
1.5230 1.8218 ***
I just take it a day at a time, I will
manage somehow 4.0411 3.7568 ***
I’m more satisfied with spending
money than saving it for a long time 3.7719 3.8097 - I pay my bills on time, etc. 1.5263 1.7137 I***
I’m willing to risk part of my money
when it comes to savings or investing 4.2654 4.3347 - I personally check my finances carefully 1.9118 2.4319 ***
I determine long-term goals and strive
to achieve them 2.4734 2.7735 ***
Money is there to be spent 3.1824 2.8760 ***
Source: Author. Note: *** P <0.0001
All in all, it can be said of 6 statements that their mean values were significantly different at the two times and there were no significant differences in the case of 2 statements. Overall, we can formulate our observations on the results of the two survey dates in the following points.
a. Respondents agreed more with considering whether or not they can afford to spend money before spending it in 2010.
b. A rejection of the Carpe Diem approach is basically characteristic, but it is reduced in 2015.
c. Respondents try to pay their bills on time, but in 2015 this value is also lower.
d. Checking finances reduced by 2015.
e. Long-term target setting also reduced by 2015.
f. The approach that money is there in order to be spent is more favoured by respondents in 2015 than in 2010.
There are two statements in the case of which the way of thinking has not changed namely risk-taking and preference of spending money as compared to saving money. Overall, we can state that in the 2015 database, the mean values of the statements have, although slightly but significantly shifted toward a financially less conscious approach.
Summary and Conclusions
In our study, we compared the databases regarding financial literacy recorded in Hungary in 2010 and 2015, along the relevant variables found in both surveys. Since there were variables in the research that did not appear in one of the two data collections, we have omitted them from our present study. For some issues, we reduced the number of variables (for example, product knowledge, product possession, product use, financial knowledge) as the two lists - 2010 and 2015 - could be matched in this way. Even with these limitations, we have obtained significant and useful results.
The main value of our longitudinal research is that we compared two periods in which the financial and economic situation of the population significantly differed, leading to significant changes in financial awareness, behaviour and attitudes.
Before the global economic crisis, the Hungarian population (and the other players of the national economy as well as the state itself) was characterized by even
“non-existent money” being spent, i.e. borrowed money was spent, moreover, the majority of the borrowings was denominated in foreign currency, Swiss francs, in which Hungary performs only a negligible extent of trading. Thus, the sudden and great increase in the Swiss franc’s value as compared to the national currency, led to a serious credit crisis both at macro and micro levels. Hungary was affected by this financial and real economic shock much more than we could expect. The outbreak of the international crisis occurred at the worst time from the aspect of Hungary because it created bad external conditions for returning to a sustainable convergence path
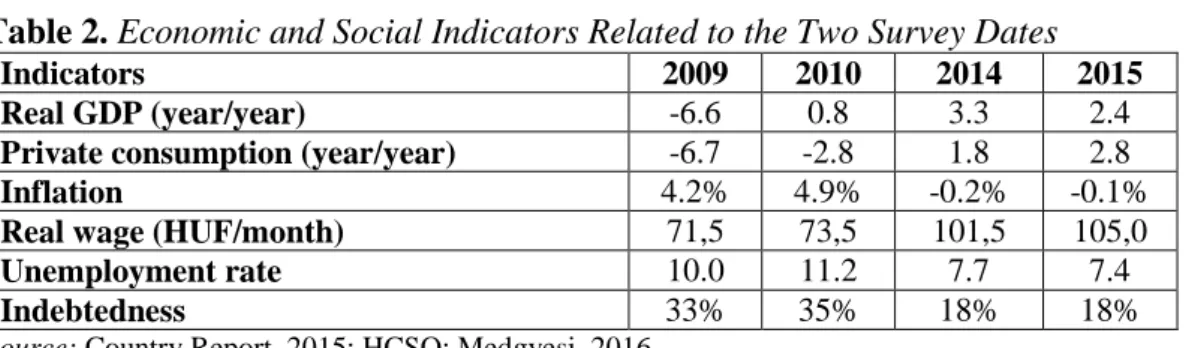
(Neményi 2009). All this resulted in the tightening of the purse-strings, followed by constraints. Indebtedness was high, unemployment was high, consumption fell, and real wages also declined. Inflation was around 5% up to 2011, and a decrease of it followed only from 2012 onwards. The 2010 survey was done in this socio-economic environment (see Table 2).
The next phase of the survey was implemented in 2015, in a significantly different environment. GDP growth revived since 2014. Unemployment decreased, inflation disappeared, debt consolidation took place, and last but not least real wages also increased, so people started to spend and the formerly moderate consumption also increased. In 2015 all this raised the consumption path by almost 1% age point (Country Report, 2015). Some highlights are included in Table 2.
Table 2. Economic and Social Indicators Related to the Two Survey Dates
Indicators 2009 2010 2014 2015
Real GDP (year/year) -6.6 0.8 3.3 2.4
Private consumption (year/year) -6.7 -2.8 1.8 2.8
Inflation 4.2% 4.9% -0.2% -0.1%
Real wage (HUF/month) 71,5 73,5 101,5 105,0
Unemployment rate 10.0 11.2 7.7 7.4
Indebtedness 33% 35% 18% 18%
Source: Country Report, 2015; HCSO; Medgyesi, 2016.
Concerning financial behaviour, it can be said that the proportion of those who have entrusted financial decisions to others has decreased significantly. This may be related to the fact that many had been burned by so-called foreign currency loans, which was a constant topic of social communication as well. All this significantly reduced the confidence of the people in banks and the “advisors” employed by them.
Between 2010 and 2015, the proportion of people with financial problems significantly diminished. Our results show that not only fewer people were struggling with financial problems in 2015, but strategies for solving these problems have also been significantly restructured. The most typical answer to financial difficulties in 2010 was that respondents reduced their spending; they spent less, and gave up certain things. This solution is most typical in 2015 as well, but it can be seen that as to its proportion fewer have chosen this option while overtime and additional work commitments, late payment of bills or failures to pay those and the sale of assets have significantly increased. At the same time, the taking out of loans and credits has significantly declined, which means that people’s mistrust regarding financial institutions has increased. The fact that people are rather paying their bills late means that they are less afraid of service providers than banks. By 2015, a loosening attitude can be observed in financial management, resulting in a reduction in the number of household budgeters, including a significant drop in the proportion of women in this respect. In addition, in 2015, fewer respondents had savings than in 2010. At both dates, collecting money in a retail current account was the most typical form of savings. Product knowledge was significantly lower in 2010 than in 2015.
Regarding financial knowledge, deterioration can be observed between the two surveys. In particular, the difficulty of interpreting interest rates is the biggest
negative change observed here. The reasons must be explored and solutions are to be found by those in charge of education.
With regard to financial attitudes we can establish that in the 2015 database, the mean values of the statements have, although slightly but significantly shifted toward a financially less conscious approach.
In 2015, the Hungarian population faced significantly fewer financial problems, affecting their financial behaviour and attitudes. Banks are less trusted and people entrust their finances to others less frequently, which can be traced back to past experiences. Less of savings and the strengthening of the Carpe Diem approach are due to the post-crisis release and rectification and the implementation of postponed consumption due to previous constraints. However, it is important to distinguish between the financial behaviour typical of 2015 and before 2008. While before 2008 the population typically consumed from (foreign currency) loans, in 2015 it spent more and more freely from the income earned. At the same time, however, attention should be drawn to the fact that the decline in financial awareness, such as the reduction in long-term financial targets, in savings and in willingness to budget, unjustified reluctance to borrow, product knowledge and use, and the deterioration of calculation capabilities, may in the long term pose problems both on an individual and a macro level, with particular regard to competitiveness. OECD research draws attention to the need for longer-term economic and social-psychological
“consolidation” to raise financial awareness at the population’s level, but it is not a sufficient condition. In order for people to dare and to be able to make informed financial decisions, a harmonious development of financial literacy at social level is indispensable.
References
Atkinson A, Messy F (2012) Measuring Financial. Literacy: Results of the OECD / International Network on Financial Education (INFE) Pilot Study. OECD Working Papers on Finance, Insurance and Private Pensions, 15. OECD Publishing.
Béres D, Huzdik K (2012) Appearance of Financial Literacy at Macroeconomic Level.
Public Finance Quarterly 3: 322‒336.
Botos K, Botos J, Béres D, Csernák J, Németh E (2012) Financial Literacy and Risk Assumption in Households in the Central Great Plain. Public Finance Quarterly 3:
291‒309.
Chen H, Volpe RP (1998) An analysis of personal financial literacy among college students.
Financial Services Review 7: 107‒128. Doi: 10.1016/S1057- 0810(99)80006-7.
Country Report (2015) Retrieved from https://bit.ly/2An0JHb. [Accessed 20 November 2016].
Czakó Á, Husz I, Szántó Z (2011) Should We Cut Our Coat According to Our Cloth?
Changes in the Financial Literacy of Hungarian Households and Enterprises During the Time of the Crisis. BCE Innovációs Központ Nonprofit Kft. Budapest.
Deacon RE, Firebaugh FM (1988) Family resource management: Principles and applications. Boston: Allyn and Bacon.
Habschick M, Seidl B, Evers J (2007) Survey of financial literacy schemes in the EU27.
Retrieved from https://bit.ly/2Oxa6XM. [Accessed 3 January 2012].
Hastings JS, William CM, Skimmyhorn L (2012) Financial literacy, financial education and economic outcomes, Working paper 18412, national bureau of economic research 1050 Massachusetts Avenue Cambridge, MA 02138 September 2012.
Hornyák A (2015) Attitűdök és kompetenciák a középiskolás diákok, mint potenciális banki ügyfelek körében. [Attitudes and Competencies among High School Students as Potential Bank Customers]. Doctoral Thesis. University of West Hungary, Sopron.
Kempson E (2009) Framework for the Development of Financial Literacy Baseline Surveys:
A First International Comparative Analysis. OECD Working Papers on Finance, Insurance and Private Pensions1: 1–32.
Kenesei ZS (2014) The Development of Financial Literacy in Hungary in the Past 15 Years.
In: Economy, Society, Consumption - 1989-2014. Budapest: GFK Hungária Market Research Institute.
Kovács P, Révész B, Ország G (2014) A pénzügyi kultúra és attitűd mérése [Measuring Financial Literacy and Attitude]. MOK Conference, Szeged.
Lusardi A, Mitchell OS (2014) The Economic Importance of Financial Literacy: Theory and Evidence. Journal of Economic Literature 52(1): 5-44. doi: 10.1257/jel.52.1.5.
Medgyesi M (2016) Háztartások viselkedése a válság közben és után. [Behaviour of Households during and after the Crisis].Retrieved from https://bit.ly/2v1MsKL.
[Accessed 10 November 2016].
MNB [Central Bank of Hungary] (2014) Tudás és érték [Knowledge & Value], Available from: http://www.mnb.hu/letoltes/mnb-tarsadalmi-spread-low-1.pdf
Nagy P, Tóth ZS (2012) Értelem és érzelem. [Sense and Sensibility]. Retail Customer Behaviours and Attitudes Towards Banks Financial and Economic Review Special issue 11: 13–24.
Neményi J (2009) A monetáris politika szerepe Magyarországon a pénzügyi válság kezelésében. [The Role of Monetary Policy in Hungary in Managing the Financial Crisis]. Közgazdasági Szemle: 393-421.
Németh E, Jakovác K, Mészáros A, Kollár P, Várpalotai V (2016) Insight and Blight - Initiatives on Enhancing Financial Literacy in Hungary. Public Finance Quarterly 61(3):
407-428.
Pénziránytű Foundation (2015) A magyar lakosság pénzügyi kultúrája. [Financial Literacy of the Hungarian Population]. Retrieved from https://bit.ly/2K81uDp.[Accessed 6 December 2015].
Plakalovic N (2012) Financial Literacy and Resultant Stability of the Financial System.
Proceedings of the Faculty of Economics in East Sarajevo 6: 135–144.
Volpe R, Chen H, Liu S (2006) An Analysis of the Importance of Personal Finance Topics and the Level of knowledge Possessed by Working Adults. Financial Services Review 15 (1): 81‒98.
Xiao JJ, Ahn SY, Sheridon J, Shim S (2014) Earlier financial literacy and later financial behaviour of college students. International Journal of Consumer Studies 38(6):
593‒601.
Zsótér B, Nagy P (2012) Our Everyday Feelings and Finances. Our Everyday Feelings and Finances. The Role of Money-Related Attitudes and Material Orientation in the Development of Financial Literacy. Public Finance Quarterly 3: 310‒321.