Challenges 233.
December 2018
Ádám Kerényi
THE FINTECH CHALLENGE : DIGITAL INNOVATIONS
FROM POST-COMMUNIST EU MEMBER COUNTRIES
Challenges Nr. 233 (2018) 17. December 2018
The fintech challenge : Digital innovations from post-communist EU member countries
Author:
Ádám Kerényi
junior research fellow Institute of World Economics
Centre for Economic and Regional Studies Hungarian Academy of Sciences email: kerenyi.adam@krtk.mta.hu
The views in this paper are those of the author’s and do not necessarily reflect the opinion of the Institute of World Economics, Centre for Economic and Regional Studies HAS
The fintech challenge : Digital innovations from post-communist EU member countries
1Ádám Kerényi
2Introduction
3In this paper I focus on 11 EU member states which used to be Socialist countries.
They are the so called 11 BCEE countries. One of the core issues of Europeanization (Sigér, 2008) is whether the EU serves as an anchor during the transformation process of the post-communist countries, i.e. whether the EU is able to be the point of reference and to catalyze the process of changes. The socialist economic past is dominant in the countries of the BCCE-region. Communism lasted for more than seventy years in the 3 Baltic states and approximately for forty years in Central- and Eastern-European states.
After having gained independence from the Soviet Union, the 3 Baltic states lost half of their GDP, the rapid growth thereafter made up for these losses. BCEE region reaches one fourth of EU’s territory and one fifth of the EUs total population (see Table 1).
1This paper was presented at the conference ’Firm Behavior in Central and Eastern Europe: Productivity, Innovation and Trade’ Summer Academy Akademie für Politische Bildung Tutzing on Lake Starnberg, Germany, June 11-13, 2018.
2 junior research fellow, Centre for Economic and Regional Studies of the Hungarian Academy of Sciences, Institute of World Economics, Tóth Kálmán str. 4, H-1097 Budapest, Hungary. Email:
kerenyi.adam@krtk.mta.hu
3The author is grateful for the National Research, Development and Innovation Office’s grant (NKFI- 128682).
Table 1. Territories and populations of BCEE countries ( , person)
Territory ( ) Population 2008 Population 2016
Bulgaria 111 000 7 518 002 7 153 784
Czech Republic 78 870 10 343 422 10 553 843
Estonia 45 230 1 338 440 1 315 944
Croatia 56 590 4 311 967 4 190 669
Latvia 64 490 2 191 810 1 968 957
Lithuania 65 300 3 212 605 2 888 558
Hungary 93 030 10 045 401 9 830 485
Poland 312 680 38 115 641 37 967 209
Romania 238 390 20 635 460 19 760 314
Slovakia 49 036 5 376 064 5 426 252
Slovenia 22 270 2 010 269 2 064 188
CEE & Baltic Total 1 134 886 105 099 081 103 120 203 European Union (28
countries) 4 511 825 500 297 033 510 278 701
Rate 25,2% 21,0% 20,2%
Source: Eurostat (2017)
After the fall of Berlin wall, following tearing down the oppressive socialist system the Central-East European (CEE) and Baltic countries distinguished themselves with their commitment to capitalist regime. During less than two decades, the private sector share in GDP has increased from 30% to 75% in Poland, from 25% to 80% in Hungary and from 10% to 80% in Estonia (EBRD 2015, Estrin et al. 2009). Before the change of system, the BCEE-countries were slow to adopt (or steal) revolutionary innovations from the capitalist world. After the change of system, the rate of adoption in the region accelerated rapidly. The transformation of the former communist countries has been unique, however the glass is half full, because the transformation took place successfully, peacefully and was an astonishingly fast process towards a western mode of economic development, but the glass was half empty also, because on the other hand it was characterized by deep economic troubles, such us corruption (Kornai 2006)4. Since joining to the European Union CEE and Baltic countries experienced a historically never- experienced capital inflow due to the EU-funds.
4 Kornai recently decided to revisit the transformation topic thoroughly by a systematic comparative model focusing to every 48 former socialistic countries (Kornai, 2016b).
Macroeconomy in the BCEE11 region
In this section the most important economic trends of the BCEE11 countries are presented in a comprehensive way. First, I compare the GDP growth, second the Convergence process of the region (GKI 2013), third I present how the cohesion and structural funds received from the EU have been used this region.
Growth
The global financial and economic crisis started in late summer 2007 in the sub-prime real estate market of the US and spilled over to the real economy. It led to a sovereign debt crisis in 2009.
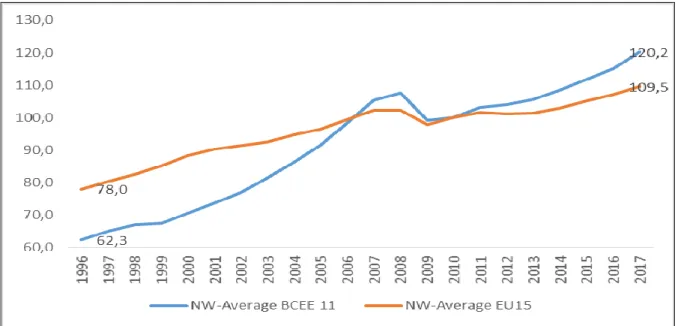
Let’s compare the GDP the 15 earlier EU members with the 11 new, post-socialist members after the transformation began and in the recent past. Before the crisis, the un- weighted average of GDP was growing much faster in BCEE than in EU15. Comparing the values if the GDP in 2010 was 100% GDP was 78 percent in the EU15 and 62,3 percent in the BCEE11 in 1996, but 105,4 percent in the EU15 and 102,3 in the BCEE in 2007 and but 109,5 percent in the EU15 and 120,2 percent in the BCEE11 in 2016 (Figure 1).
Figure 1. GDP Gross domestic product at market prices. Chain linked volumes, index 2010=100
Source: Eurostat 2018a. Note: The figures of the individual country groups are un-weighted averages.
High-technology exports are products with high R&D intensity, such as in aerospace, computers, pharmaceuticals, scientific instruments, and electrical machinery.
Recession took place in 2009 in the EU. The BCEE11 countries were relatively resilient to the crisis until September 2008, when the US investment bank Lehman Brothers collapsed. The reason for this was that banks in BCEE countries did not have toxic financial assets in their portfolio. After the default of Lehman Brothers the global financial and economic crisis intensified globally and in the BCEE region also.
The major reasons why BCEE11 countries were seriously affected by the global crisis included dependence on external financing, the high role of export in their economies and the existing macroeconomic imbalances. Increasing risk aversion of foreign investors generally and especially towards the region, the contraction of external demand and deleveraging by financial institutions had a more adverse impact on the BCEE11 economies, than on the developed industrial ones.
Otherwise, the substantially lower level of public debt relative to GDP of the BCEE11 countries compared to the EU average was an important advantage for them. As far as the impact of the crisis is concerned, Poland was the single country, not only in the BCEE11 but in the whole EU as well, that has recorded positive GDP growth rates in each year since 2008. In spite of the sharp contraction in 2009, Bulgaria and Romania reached slightly positive annual average growth rates later, Slovakia even a more robust one. The first contraction of GDP was roughly the same in the Czech Republic, Hungary and Slovenia, but in these countries recession took place not only in 2009 but in 2012 as well. On the other hand, in the Baltic region recession started in early 2008, well before the collapse of the Lehman Brothers and they suffered double-digit fall of GDP in 2009.
Nonetheless, they rebounded quite quickly in the subsequent years, although their GDP has not reached pre-crisis levels. Before the crisis the Baltic countries grew rapidly, even at unsustainable rates, their economies were overheated; this was not the case in most of the other BCEE11 countries except Bulgaria and Romania. The recession was more prolonged and thereby deeper in Croatia than in rest of the BCEE11 region (GKI 2013).
Convergence
Europe has invented a Convergence Machine, which functions so, that the EU welcomes poor countries and helps them to become high-income economies (Harrold and Hahm 2012. The “Convergence Machine” is certainly an opportunity but not a guarantee. The EU is powerless even regarding its own member states when the requirements did not reflect the domestic political and social convictions but they appear only as external expectations (Győrffy 2008).
There is certain evidence that in case of BCEE countries the EU served as an anchor during their transformation process. These economies had a point of orientation all across the years of their systemic change. The European Commission tried to maximize its leverage following from the broad mandate it had, as well as from its being the conductor of the accession negotiations. Signaling and screening were widely used both in formal and informal matters. Beyond the formal pressure, the informal “beauty contest” among the accession countries in Baltic and Central and Eastern Europe did help sustain the reformist momentum in otherwise sensitive areas (Sigér, 2018).
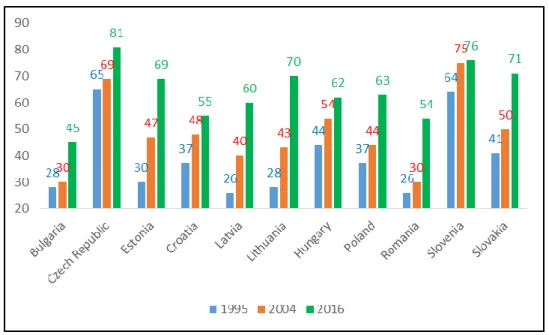
It is important to note that in historic terms the BCEE11 countries had set to integrate into the EU in the late 1980s and early 1990s and simultaneously to this, the convergence to the development level, inter alia, in terms of per capita GDP of the EU started, their dependence on external sources and their rather huge imbalances were a natural consequence of this process. Before the global financial and economic crisis the convergence process of the BCEE region in terms of GDP growth was remarkable (Figure 2). The rate of convergence was the fastest at Baltic countries from 1995 until 2004, than Romania and Bulgaria gains momentum.
Cohesion policy was introduced after the Mediterranean enlargement (1988). Its main goal was supporting regional convergence. After the Eastern enlargement between 2007 and 2013, the main goal was also convergence by supporting growth and employment in the less developed regions. It had the following eligibility criteria:
Regions: GDP/capita less than 75% of EU average
Individual countries: GNI/capita less than 90% of EU average
The second goal of EU funds was to strengthen the competitiveness. During this period, Baltic states and Hungary were the biggest beneficiaries. In Hungary 3% of GDP per annum (to comparison Marshall plan reached 2% after WWII in Western European countries and lasted only for a couple of years) and 57% of public investments was supported by EU Funds.
Figure 2. Volume indices of real expenditure per capita in PPS (EU15=100)
Source: Eurostat 2018b
We might ask if according to the standard growth model is slower convergence only the result of the higher starting point? The answer is no (Figure 3).
Figure 3. Volume indices of real expenditure per capita in PPS (EU15=100)
Source: Eurostat 2018b author’s calculation
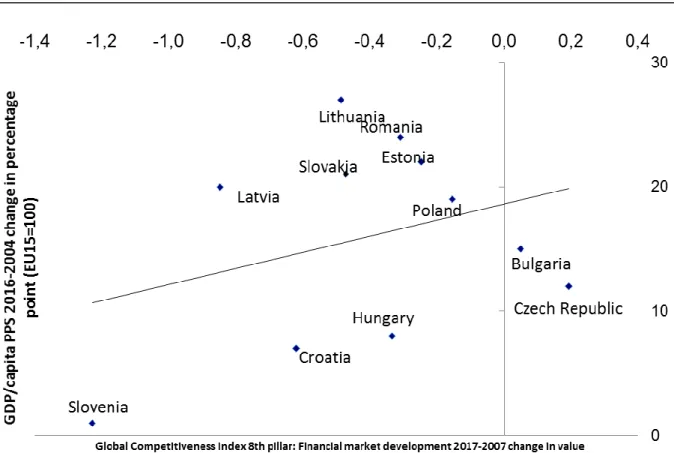
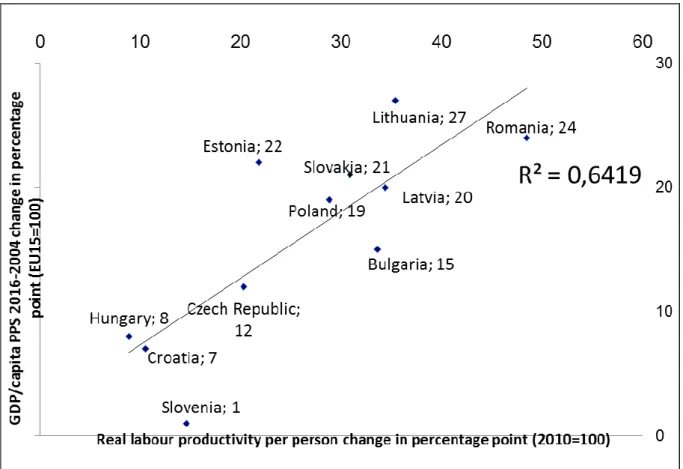
We can note that the initial level only partly explains the differences between the rate of convergence. If we compare GDP per capita in PPS change in percentage points between 2016-2004 (EU15=100) the correlation is not high, but taking into consideration the labor productivity we can find a much higher correlation (see Figure 4-5-6).
Figure 4. correlation between GDP per capita in PPS change in percentage points between and Global Competitiveness Index 8th pillar: Financial market development
change in value
Source: Eurostat 2018b author’s calculation
Figure 5. GDP/capita PPS 2016-2004 change in percentage point (EU15=100)
Source: Eurostat 2018b author’s calculation
Figure 6. Real labour productivity per person change in percentage point (2010=100)
Source: Eurostat 2018c author’s calculation
The rate of GDP growth exceeded the EU average in every BCEE11 country. From 2008 to 2012 the convergence process came to a halt in the Baltic countries, Croatia, Slovenia and Hungary. It slowed down significantly in the rest of the BCEE11 with the exception of Poland where it continued at the same speed. Convergence continued, but at a slower rate. There were significant differences among countries. Country-specific differences may reflect the differences in the effectiveness of Eu-fund absorption. Real convergence remains far from being complete. EU-funds will remain available between 2014 and 2020, where 40% of all funds goes to the Visegrad countries. A more efficient usage of EU funds is key.
The QUEST-model is developed by the Directorate General for Economic and Financial Affairs of the European Commission. The model simulates the impact of policy interventions on a large number of economic variables relevant to cohesion and rural development policies such as GDP, employment, wages, productivity, or investment from the private sector. The model belongs to the class of New-Keynesian dynamic general equilibrium (DGE) models that are now widely used in economic policy institutions. The model describes fully the dynamics of the system in a general equilibrium framework where changes in the conditions for a particular block are transmitted to the other blocks through various market interactions. The model is regularly used for the analysis of key fiscal and monetary policy scenarios, for assessing the impact of the structural reforms for contributing to the economic projections of DG ECFIN. This type of approach allows to examine the outcome of various policy scenarios taking into consideration the manner in which interventions affect the allocation of resources throughout the economy, thus enabling an analysis of policy impacts at the macroeconomic level. The model provides a fully micro-founded, integrated and optimization-based representation of the economies of the Member States. Cohesion and rural development support is a major opportunity, but the way in which it is used is being debated. The impact of the EU's cohesion and rural development resources in the 2007-2013 budget period is difficult to take into account. The analysis based on the Quest model contributes to the understanding of the macroeconomic potential impacts of the cohesion and rural funds invested in 27 Member States during the period 2007- 2015.
QUEST is structured around building blocks which represent the behavior of fundamental economic agents and interactions. However, a recently published analysis shows the impacts on GDP, TFP, Wages, Investments and trade balance of cohesion and rural development policies deviation from baseline (DG REGIO, 2016). In the short term it was Hungary which optimized the funds, but in a longer term Poland shows better results (Table 2.)
Table 2. Impacts on GDP, TFP, Wages, Investments and Trande balance of cohesion and rural development policies , 2015 and 2023 (% deviation from baseline)
GDP
2015
TFP 2015
Wages 2015
Investments 2015
Trade balance
2015
GDP 2023
TFP 2023
Wages 2023
Investments 2023
Trade balance
2023
Bulgaria 3,8 4,0 2,7 0,5 -0,9 3,2 1,9 2,7 2,4 -0,4
Czech Rep. 3,8 3,8 2,9 0,7 -1,1 3,4 2,3 2,7 2,2 -0,3
Estonia 0,7 0,8 0,6 0,5 0,0 0,8 0,4 0,5 0,8 0,0
Latvia 4,5 5,1 4,0 1,7 -0,3 4,2 2,4 3,6 2,9 -0,5
Lithuania 5,1 6,2 4,9 1,0 -0,9 5,4 3,9 5,0 3,3 -0,6
Hungary 5,3 4,9 4,2 1,3 -1,4 4,6 2,5 3,4 2,8 -0,5
Poland 4,3 5,1 4,0 0,1 -0,4 5,7 3,5 3,8 2,3 -0,2
Romania 3,8 3,9 2,8 0,0 -0,8 3,4 2,2 2,7 2,6 -0,3
Slovenia 2,4 2,7 1,9 0,6 -0,3 2,2 1,4 1,9 1,7 -0,2
Slovakia 3,5 3,6 2,7 0,6 -0,7 3,3 1,8 2,4 1,7 -0,2
NW-Average
of 10 BCEE 3,7 4,0 3,1 0,7 -0,7 3,6 2,2 2,9 2,3 -0,3
Source: DG REGIO (2016) Note: The equations, assumptions and calibration of the model are provided in the papers cited above (see also the list of references in annex). The model features two main types of firms: producers of intermediate and final goods and services, and R&D producers of patents. Firms produce goods and services by combining technology, physical capital and labor. The production technology is enhanced by acquiring new processes from the R&D sector which generates innovation by mobilizing resources (primarily highly skilled labor). This in turn increases the productivity of producers of goods and services.
The main challenge is how avoid the middle income trap (Golonka et al, 2015) in BCEE countries. The pre-crisis growth models are not sustainable any more. The earlier engines of GDP and productivity gains are fading due to:
demographical challenges,
lower FDI inflows,
weaker global demand,
the 4th industrial revolution
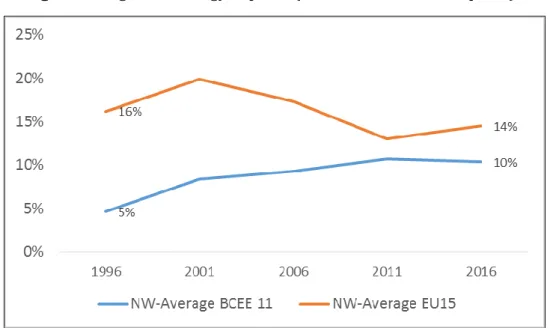
Let’s compare some indicators of the 15 earlier EU members with the 11 new, post- socialist members after transformation began and in the recent past. High tech exports as a proportion of the manufactured were 16 percent in the EU15 and 5 percent in the BCEE11 in 1996, but 14 percent in the EU15 and 10 percent in the BCEE11 in 2016. The proportions of internet users in the population was 5 percent in the EU15 and 2 percent in the BCEE11 in 1996, but 85 percent in the EU15 and 74 percent in the BCEE11 in 2016. Mobile telephone penetration was 12 percent in the EU15 and 2 percent in the BCEE11 in 1996, but 124 percent in the EU15 and 129 percent in the BCEE11 in 2016.
The post-socialist countries, initially far behind in their use of modern means of communication, have now more or less overtaken “traditional” capitalist countries in this respect (see Figures 7-8-9).
Figure 7. High-technology exports (% of manufactured exports)
Source: World Bank 2018a. Note: The figures of the individual country groups are un-weighted averages.
Figure 8. Individuals using the Internet (% of population)
Source: World Bank 2018b. Note: The figures of the individual country groups are un-weighted averages.
Internet users are individuals who have used the Internet (from any location) in the last 3 months. The Internet can be used via a computer, mobile phone, personal digital assistant, games machine, digital TV etc.
Figure 9. Mobile cellular subscriptions (per 100 people)
Source: World Bank 2018c. Note: The figures of the individual country groups are un-weighted averages.
Mobile cellular telephone subscriptions are subscriptions to a public mobile telephone service that provide access to the PSTN using cellular technology. The indicator includes (and is split into) the number of postpaid subscriptions, and the number of active prepaid accounts (i.e. that have been used during the last three months). The indicator applies to all mobile cellular subscriptions that offer voice communications. It excludes subscriptions via data cards or USB modems, subscriptions to public mobile data services, private trunked mobile radio, telepoint, radio paging and telemetry services.
If we focus on the Competitiveness Index relevant pillar we can see a stagnation (Figure 10).
Figure 10. Competitiveness Index 8th pillar: Financial market development
Source: WEF (2018)
An efficient financial sector allocates the resources saved by a nation’s population, as well as those entering the economy from abroad, to the entrepreneurial or investment projects with the highest expected rates of return rather than to the politically connected. Business investment is critical to productivity. Therefore economies require sophisticated financial markets that can make capital available for private-sector investment from such sources as loans from a sound banking sector, well-regulated securities exchanges, venture capital, and other financial products. In order to fulfill all those functions, the banking sector needs to be trustworthy and transparent, and—as has been made so clear recently—financial markets need appropriate regulation to protect investors and other actors in the economy at large (WEF 2018).
The Digital Economy and Society Index (DESI) is a composite index that summarizes some 30 relevant indicators on Europe’s digital performance and tracks the evolution of EU Member States, across five main dimensions: Connectivity, Human Capital, Use of Internet, Integration of Digital Technology, Digital Public Services. According to the last composite index in the BCEE region the Baltic states, Slovenia and Estonia are the front runners, while Bulgaria, Romania, Poland and Hungary are lagging behind (Figure 11.)
Figure 11. Digital Economy and Society Index (2018)
Source: European Commission, Digital Scoreboard (2018)
The role of innovations
Joseph Schumpeter defined the innovation phenomenon (Schumpeter 1912). He described it as the critical dimension of economic change. Innovation is preceded by invention. The first step is made by the inventor: the professional or amateur researcher, the academic scholar or the company’s engineer is the one to whom the new idea occurs. However, the originality of the idea, its novelty, and its ingenuity are not at all enough. In the second step, the invention becomes an innovation; the practical marketlaunch begins, that is, the organization of production and the diffusion of the new product, or the application of a new organizational form. In capitalism, the entrepreneur plays a distinguished role. Innovative entrepreneurship is a function, a role, which can be fulfilled by an individual alone, or by teaming up with one or more partners, or with the support of a small firm. However, even a large firm can function as an entrepreneur.
The main point is that the entrepreneur is the one who matches together the necessary financial and personal conditions that the innovation requests for, in other words, the human resources, the physical instruments and the financial resources essential to the activity (Kornai 2010, pp. 7-11). In some cases it might occur that the inventors and the innovators are the same persons.
The process of innovation and the dynamics of firms’ entry and exit are closely associated. Schumpeter coined the notion “creative destruction” for the latter, concisely and precisely describing the two inseparable sides of fast technical progress. It is easy to appreciate happy arrivals in the business world, especially if they appear in the form of
successful innovators. But there is no fast progress without the sad events of bankruptcies, business failure, exits, and the accompanying bitter phenomena of lay-offs and unemployment (Kornai 2010, pp. 25-26). Indeed, there have appeared, albeit sporadically, in parts of the post-socialist region, innovations that count as revolutionary in global scale (e. g., Graphisoft innovations in architectural design or those of Prezi in teaching and business presentations) (Kornai 2016a). Prezi has more than 100 million user.
Technical progress is accelerating. The empirical observation known as Moore’s Law states that technical development, or certain partial processes within it, can be described by a high exponential growth path (Brock 2006), Kurzweil 2006). The most dynamic area of change is occurring in a sphere variously termed the high tech sector, the computer world, or the sphere of digital technologies. Think back to the earliest central computers. Kurzweil, an outstanding innovator in the hi-tech sector, recalls (Kurzweil 2006, p. 102) the type 7094 IBM computer in use in 1967, on which he himself worked as a student at MIT. Kurzweil compares its parameters with those of a 2004 notebook. A decade later the comparison can be made with a smartphone. The
“prehistoric” machine occupied a whole room, whereas a smartphone fits in the palm of a hand. The earlier machine sold at a horrific price, expressed as $11 million at 2003 prices, whereas an outstanding smartphone, again at 2003 prices, cost $400, i. e. less than 0.004 percent of the earlier one (Table 3).
Table 3. Typical characteristics of computers in 1967, 2004 and 2015
Machine Date Retail price (Dollars)
Memory (Mbytes)
Processor (MIPS)
IBM_7090 1959 $3 600 000 0,141 0,326
Dell_D_8300_P4/3.0 2003 $2 500 2048 4439
iPhone-5S 2013 $600 1024 18200
Source: https://www.frc.ri.cmu.edu/~hpm/book97/ch3/processor.list.txt
The three devices presented in Table 3 do not differ only in the above three parameters (processor speed, memory and price), but also in the functions they can serve. The ‘60s computer could be used only for calculations. Today’s smartphone can be used for many other functions. Meanwhile performance underwent incredible
development. Processor speed improved extremely. The steepness of the high tech sector’s exponential development can also be conveyed in another form: the average period of performance-doubling in many processes over a lengthy period has been around two years. Processor performance, for instance, doubles every 1.8 years. The effect of technical development occurring in the information/communications sector is not confined to the two spheres (family life and recreation) given as an illustration. It extends to all dimensions of human activity and inter-human relations. It transforms production, turnover and consumption, the technical processes of income and wealth movements, as well as teaching, scientific research, and health care. New forms of contact are appearing in retail (e-trade). Technical progress and the globalization closely associated with it have vastly accelerated financial transactions and radically transformed the activity of the financial sector. Radical changes have occurred in all social activity: military attack and national defense, crime and law enforcement, acquisition of political power and protest against it, culture and cultural garbage, the spread of noble ideas and of falsehoods – the list could be continued far longer Kornai (2016a).
Innovations in financial services
While in the biotechnology or pharmaceutical industries innovation functions are at focus point of their competitive advantage, financial services have neither the culture nor the experience of setting up innovation functions and absorbing their products (Sonea, 2016, p. 176).
Almost a century ago John M. Keynes described the belle-époque, as the follows: “the inhabitant of London could order by telephone, sipping his morning tea in bed, the various products of the whole earth, in such quantity as he might see fit, and reasonably expect their early delivery upon his doorstep; he could at the same moment and by the same means adventure his wealth in the natural resources and new enterprises of any quarter of the world, and share, without exertion or even trouble, in their prospective fruits and advantages; or he could decide to couple the security of his fortunes with the good faith of the townspeople of any substantial municipality in any continent that fancy
or information might recommend” (Keynes, 1919). “If we replace “telephone” with a
“tablet” we have not the start of the Twentieth Century but the Twenty First, a century in which opportunities are no longer limited to men of the City. Nonetheless, finance continues to be arranged around a series of hubs like brokers, clearing houses and exchanges; whereas, in other domains, people form connections directly, instantaneously and openly, and this is revolutionizing how they consume, work, and communicate. The extent to which finance continues democratizing and transforming depends on superficially arcane, but fundamentally vital, enabling technologies. The emergence of mobile telephony, the ubiquity of the internet, availability of high-speed computing, advances in cryptography, and innovations in machine learning could combine to enable rapid changes in finance – just as they have in other areas of the economy” (Carney, 2016, p. 3).
Nowdays innovation is on the rise in financial services. Banks have invested heavily in their customers, and many are building compelling experiences that will meet customers’ needs as never before. (McKinsey 2018). Today the mobile internet transport data. The information, once a prized possession in the hands of a select few, is now at the fingertips of anyone who wants to use it and act upon it. The trouble today is that there is too much information coming from many different sources. This making sense of it all, correlating and putting it to a good use has become an art – not the information gathering process itself. (…) Physical store locations are threatened and are becoming a burden and a liability. Pure play digital merchants of goods and services are slowly creating a perception that it is the only way to go, and bricks-and-mortar enterprises could soon become extinct (Huljev, 2016).
Financial institutions increased their use of IT in their internal operations, gradually replacing most forms of paper-based mechanisms by the 1980s, as computerization proceeded and risk management technology developed to manage internal risks. One early example of a form of financial technological innovation is very familiar today to financial professionals. Michael Bloomberg started Innovation Market Solutions in 1981 after leaving Solomon Brothers, where he had designed in-house computer systems. By 1984, Bloomberg terminals were in ever-increasing usage among financial institutions (Arner et al. 2015, p. 10)
Until the Lehman-crisis the world’s major retail banks dominated the financial services landscape, they enjoyed a high degree of public trust. All have changed afterwards.
Financial innovation, financial engineering or securitization is one of the decisive factors that has greatly contributed to the financial shock. Financial innovation or financial engineering refers to the ongoing development of financial products designed to achieve particular client objectives. Examples of objectives sought by those financial products include assisting in obtaining finance through diverse funding instruments and offsetting a particular risk exposure such as the default of a borrower. The financial products relevant to the current financial crisis are the Adjustable-Rate Mortgages (ADR), the bundling of subprime mortgages into Mortgage-Based Securities (MBS) or Collateralized Debt Obligations (CDO) for sale to investors and Credit Default Swaps (CDS) which is a form of credit insurance. The usage of these products expanded dramatically in the years leading up to the crisis. Such financial innovation enabled financial institutions to obtain investor funds to finance lending including subprime mortgages, hence contributing to the housing bubble and spreading the losses to a larger investment base. (Hussein, 2013, p. 3)
Did financial innovations play a role in the Financial Crisis of 2007-2008? No doubt.
By the time of the financial crisis, some financial innovations were sufficiently widespread that the financial difficulties were bound to touch them and have additional effects because of them. (Dwyer, 2011, p. 10).
The (mis)use of certain financial innovations, such as collateralized debt obligations (CDOs), has been regarded as a contributor to the crisis by detaching the credit risk of the underlying loan from the loan originator.
If traditional financial service providers reposition themselves as “infrastructure” or banks of service behind new, trusted, non-financial brands, they may no longer need to fight to remain costly retail brands. But is this going to happen? The early signs suggest yes and the pace of change is fast. In the same one year Facebook launched free friend- to-friend payment, Atom launched its app-based challenger bank, Alibaba opened the
online Mybank, and Amazon offered loans to SMEs which sell through its platform (Kleij, 2016)
David Nicholson, who might be the father of the Peer-to-peer lending’s idea, said that:
“I started thinking about, (…) what’s a bank for, what does a bank really do and therefore what opportunities are there to think about how that could change and what’s really important to a bank. Obviously, banks do a huge number of things, but for a retail bank, a lot of it’s quite simple. It’s about matching up deposits with loans and actually acting as an intermediary, between somebody with a deposit and somebody with a loan…But actually that sort of got me starting to think around, well, what if there are other places that could act as that intermediary? Why does it have to be a bank that sits in-between depositors and people who are borrowing money? I sort of was building a deeper understanding of what’s really going on here, and what’s really going on in a bank, (…) why banks have been the institutions that have been capable of doing those because, you wind back 100 or 200 years, you didn’t have any of the information, or the systems, or the technology, that would enable anybody else to do that intermediary function”
(Bholat & Atz, 2016).
Let us take the example of Renaud Laplanche’s famous inspiration, that he got when started asking himself, why it was, in the modern technology age, that if he put money in the bank, he got two percent, and if he tried to take money, he tried to borrow money from the bank on his credit card, he paid 17 percent, and this was in the era of computers. Since Renaud Laplanche had that insight, spreads, administers of costs in mainstream banks have risen not fallen (Summers, 2015).
The emergence of FinTech phenomenon
Competition in the FinTech space is developing at the global level. As it often happens in innovative markets, the key for success lies in a large domestic market, which allows successful companies to achieve a scale enabling them to aim at global leadership. In the long term, European FinTech players would be at a significant disadvantage vis-à-vis their US and Chinese competitors, if the European markets remain segmented along national borders, with different sets of rules and uncoordinated actions by local authorities” (Enria 2018, p. 3).
Financial Technology is one of the most innovative, increasingly important and potentially the most rapid change in financial services revolutionizing the way financial services firms operate and transforming debt and equity markets, payments, credit assessment, regulatory compliance, personal finance and many other facets of financial services. The Golden Age of FinTech has come according to FinTech Evangelists, on the other hand current hype about FinTech is not due to the alleged revolutionary character of the technologies, but to their better visibility.
Examples of FinTech include digital ledger technology, robo-advice, RegTech (technologies that can be used for compliance and reporting requirements), and virtual currencies. Today, a financial conference would not meet the expectations of the mainstream if it missed an item on the agenda, if the word "FinTech " would not be present.
A group of researchers define the FinTech phenomenon as technology-enabled financial solutions (Arner, et al. 2015). In their reading, the FinTech phenomenon is not limited to certain banking activities (e.g. financing) or business models (e.g. peer-to-peer lending, applications), but encompasses the kinds of products and services that have traditionally been provided by banks to their customers. Others (McAuley 2015, Kim, et al., 2016) interpret the phenomenon more broadly, defining it as an economic industry composed of companies that use technology to make financial systems more efficient.
The ECB’s position is that “FinTech” is an umbrella term encompassing a wide variety of business models. In line with the ECB’s responsibilities, a guide has been produced relating to technology-supported banking products and services (ECB 2017). According to McKinsey FinTechs are financial technology firms/technology innovations in the financial sector, originating from start-ups, banks and non-bank players (McKinsey 2018).
The level of FinTech financing is booming. FinTech companies for the past decade, have moved quickly, forcing incumbents to rethink their core business models and embrace digital innovations. Globally, at last count nearly $ 165 billion of venture capital and growth equity has been deployed to FinTechs over the decade, and this number is growing quickly (see Table 4 and Figure 12).
Table 1. Investments in FinTechs 2008-2017 ($ Billion and count # of deals)
2008 2009 2010 2011 2012 2013 2014 2015 2016 2017
Investments ($ Billion) 1 2 9 6 4 12 29 47 25 33
Deal volume (# count) 150 200 319 445 576 818 1065 1255 1074 1600 Source: (KPMG 2018, p.10). Note: Source: Pulse of FinTech Q4'17, Global Analysis of Investment in
FinTech, KPMG International (data provided by PitchBook) February 13, 2018.
Figure 12. Global investment activity (Venture Capital, Private Equity and Merger &
Acquisition) in FinTech companies 2010 – Q4'17 Deal Value ($Billion and # of Deals Closed)
Source: (KPMG 2018, p.10). Note: Source: Pulse of FinTech Q4'17, Global Analysis of Investment in FinTech, KPMG International (data provided by PitchBook) February 13, 2018.
Now, the FinTech industry is itself maturing and entering a period of rapid change (Dietz et al. 2016). The total estimated number of FinTech firms established in each jurisdiction and anticipated growth trends (EBA 2017). The ‘borderless’ nature of FinTech and the continued trend towards disintermediation in the provision of financial services (EBA 2018, p. 11). In developed markets, consumers have historically gravitated toward the established and enduring brands in banking and insurance that were seen as bulwarks of stability even in times of turbulence (McKinsey 2016).
FinTech sector in China has been developing rapidly and is world leading by several measures. The country’s digital payments account for almost half the global volume and online peer-to-peer (P2P) lending accounts for three quarters of the global total. China’s
FinTech sector is now at a critical juncture. The Chinese government’s attitude towards FinTech has become progressively more complex, as risks have piled up around P2P platforms and the number of underground fund raising and financing activities have grown. The authorities remain generally supportive, despite some recent tightening measures (PWC China 2017).
China's commercial banks and some large internet enterprises had stayed ahead in the international market in terms of financial technology practice. They should take the advantage to integrate related technologies and make these technologies their patents and use these patent advantages to change the process of international financial industry, form new industrial standards and enhance the core competitiveness of China's banking industry (Kerényi-Müller 2018a).
The Chinese government gave players a free hand to experiment. Light-touch—or, more accurately, late—regulation of digital activities and players in China has encouraged entrepreneurship and experimentation. While the response of regulators lagged behind market developments, China’s internet giants were relatively free to test and commercialize products and services and to gain critical mass. For example, regulators took 11 years after Alipay introduced online money transfers in 2005 to set a cap on the value of the transfers. It was five years after Alipay introduced barcode-based payment solutions that Chinese regulators produced an official standard on management requirements (McKinsey 2017).
In the European Union the importance of digital technology has been realized and it is considered an issue of paramount strategic, economic and social importance. The European Commission declared that the new digital technology will be a key element in the future competitive edge of the EU.
As a consequence to this development, since May 2015 the European Union has been delivering on an ambitious and comprehensive Digital Single Market Strategy which was accomplished by mid-September 2017. The DSM Strategy is built around (i) improving access to goods, services and content; (ii) creating the appropriate legal framework for digital networks and services, and (iii) reaping the benefits of a data-based economy. It has been estimated that the Strategy could contribute €415 billion per year to the EU
economy and create hundreds of thousands of new jobs, consequently it would be hard to understate the importance of timely implementation (European Commission 2017).
Having the strategic aim to build a more competitive and innovative financial market, on March 8, 2018 the European Commission unveiled a FinTech Action Plan on how to harness the opportunities presented by technology-enabled innovation in financial services.
„Europe should become a global hub for FinTech, with EU businesses and investors able to make most of the advantages offered by the Single Market in this fast-moving sector. As a first major deliverable, the Commission is also putting forward new rules that will help crowdfunding platforms to grow across the EU's single market. Action Plan envisages to enable the financial sector to make use of the rapid advances in new technologies, such as blockchain, artificial intelligence and cloud services. At the same time, it seeks to make markets safer and easier to access for new players. This will benefit consumers, investors, banks and new market players alike. In addition, the Commission is proposing a pan-European label for platforms, so that a platform licensed in one country can operate across the EU. The Action Plan is part of the Commission's efforts to build a Capital Markets Union (CMU) and a true single market for consumer financial services. It is also part of its drive to create a Digital Single Market. The Commission aims to make EU rules more future-oriented and aligned with the rapid advance of technological development” (European Commission 2018).
The FinTech Roadmap is an important summary of the necessary and envisaged regulatory approach related to the services provided by the incumbent banks and FinTech startups (EBA 2018). In general, this pragmatic attitude revolves around a tiered regulatory structure, with differentiated regulatory requirements according to the risks for the firms, their customers, the financial sector and the economy at large. In principle, the objective is to deliver “same risk – same rules” outcomes.” The EBA's FinTech Roadmap describes its priorities for 2018/2019 and provides an indicative timeline for the completion of these tasks. The priorities are:
monitoring the regulatory perimeter, including assessing current authorization and licensing approaches to FinTech firms, and analyzing
regulatory sandboxes and innovation hubs in order to identify a set of best practices to enhance consistency and facilitate supervisory coordination;
monitoring emerging trends and analyzing the impact on incumbent institutions' business models and the prudential risks and opportunities arising from the use of FinTech ,
promoting best supervisory practices on assessing cybersecurity and promoting a common cyber threat testing framework;
addressing consumer issues arising from FinTech , in particular in the areas of unclear regulatory status of FinTech firms and related disclosure to consumers, potential national barriers preventing FinTech firms from scaling up services to consumers across the single market, and the appropriateness of the current regulatory framework for virtual currencies
identifying and assessing money laundering/terrorist financing risks associated with regulated FinTech firms, technology providers and FinTech solutions (EBA 2018; Enria 2018).
The Basel Committee’s Financial Stability Board on February 19, 2018 in a paper
“Sound Practices on the implications of FinTech developments for banks and bank supervisors” summarized „how technology-driven innovation in financial services, or
"FinTech ", may affect the banking industry and the activities of supervisors in the near to medium term”.
This extensive analyses provides an excellent understanding of financial technology developments and at the present known FinTech business models. “Against this backdrop, current observations suggest that although the banking industry has undergone multiple innovations in the past, the rapid adoption of enabling technologies and emergence of new business models pose an increasing challenge to incumbent banks in almost all the banking industry scenarios considered”.
From latest developments it is obvious that the decision makers in the European Union are aware of the importance and global competitive impact of the development of financial technology. The efforts are concentrated to strengthen the development of the European Monetary Union and the European Capital Markets Union. On the one hand
they confirm that digital applications, the availability of FinTech services should be supported, but on the other they urge an improvement of supervisory risk assessment, consumer protection and strengthening the relevant legal framework. It is strongly emphasized that the level playing field between traditional banks and FinTech (TPP) service provider should be ensured.
FinTechs in BCEE region
The majority of banks are foreign-owned, and the technology they use matches that deployed across their group at the time of investment (Figure 13).
Figure 13. Banking groups in CEE
Source: Deloitte 2016
The lack of exact definition most probable required the present standpoint of the European Central Bank, stating that the regulation and supervision of FinTech services should remain in national competence.
Innovations for the banking sector provide the greatest share of FinTech solutions in all CEE countries. Such solutions are highly developed in virtually all countries (internet and mobile banking and contactless cards, for example). Although most solutions are developed in-house or provided by established vendors, there is room for emerging FinTech providers. In most countries, innovation in insurance is still far behind the banks. There is a focus on improving distribution channels (especially smartphone apps and gamification) and launching new services based on telematics. The asset management sector is somewhat conservative. Most financial institutions use systems provided by traditional vendors. On the other hand, specific opportunities exist to break down the dominance of these players by offering flexible and inexpensive (Deloitte 2016).
Table 5. Made digital payments in the past year (% age 15+)
2014 2017
Bulgaria 38% 41%
Czech Republic 73% 76%
Estonia 94% 94%
Croatia 63% 75%
Latvia 82% 83%
Lithuania 56% 67%
Hungary 58% 62%
Poland 53% 79%
Romania 30% 33%
Slovak Republic 69% 76%
Slovenia 82% 90%
Average BCEE 11 64% 70%
Source: World Bank 2018d. Note: The figures of the individual country groups are un-weighted averages.
The percentage of respondents who report using mobile money, a debit or credit card, or a mobile phone to make a payment from an account, or report using the internet to pay bills or to buy something online, in the past 12 months. It also includes respondents who report paying bills or sending remittances directly from a financial institution account or through a mobile money account in the past 12 months.
The payments area is a hot topic due to the launch of numerous breakthrough solutions, particularly those relating to various payment methods such as contactless
and mobile payments, host card emulation and cryptocurrency. The leadership role belongs to Poland and the Czech Republic, where sophisticated solutions include inter- banking m-payments schemes and robots are employed in processing payments. The upcoming implementation of the Directive on Payment Services II may change the payments market in all countries, however. Capital raising and personal finance is gaining momentum in all CEE countries, except for Hungary where such services are the preserve of the banks. Consumers use personal finance management (PFM) tools, based both on in-house developed solutions and off-the-shelf solutions delivered by start-ups.
The P2P lending market is quite well developed, both for individual borrowers and SMEs. Organizations tend to utilize data and analytics solutions delivered by global players. However, most markets are still at an early stage of development, which spells opportunities for foreign and local FinTechs to gain market share. All countries are paying more and more attention to risks related to cybersecurity due to the increasing number of attacks. To date, this area of IT solutions has been dominated by global players. Small and medium enterprises are increasingly interested in automated and cloud-based financial management solutions (Deloitte 2016).
Key barriers to market entry are related to demand, regulation and competition.
Launching FinTech solutions is usually acceptable to the financial authorities, although special requirements or limitations might apply (such as the use of the cloud or the legal status of the financial entity). Generally speaking, countries which are less economically developed and are characterized by limited domestic demand tend to be less attractive in terms of FinTech potential. A favorable business environment (with low tax rates and competitive labor force costs) might attract young companies seeking success in CEE. A vibrant start-up community that facilitates the matchmaking process between solution providers and the demand side may accelerate the progress of FinTech development.
Financial forums, incubators and industry fairs are effective ways to spread knowledge of the latest innovations and bring FinTech on to the industry agenda (Deloitte 2016).
According to recent reports the estimated size of the FinTech market across the 11 CEE and Baltic post-communist EU member countries is more than 2 billion euros.
Venture capital has been invested in Banking, Insurance, Capital raising and personal finance Cybersecurity Data and analytics Payments and Other software in these
countries. I present some areas, where CEE and Baltic countries lead the world in FinTech -innovation; in some other areas, they are on the innovation frontier; but in most other areas, they still lag behind the most advanced countries. The European FinTech market is one of the most mature in the world. While the UK remained the standout FinTech hub in the region during 2017, many other FinTech hubs continued to evolve. 2018 is critical as FinTech investors in Europe evaluate the potential for transformative change following PSD2 implementation.
Europe is to see the impact that the implementation of PSD2 on both traditional banks and FinTechs. Europe has seen a number of FinTechs (e.g. Klarna, Zopa and Revolut) apply for banking licenses in order to expand their product offerings (KPMG 2018).
FinTech in EMU member BCEE countries
The crisis highlighted the structural weaknesses of the euro zone. The arguments against early euro adoption remain valid:
Monetary policy: „one size fits all”
No common fiscal policy
Problems in dealing with economic cycles especially in case of asymmetries
Unsustainable balance position: internal devaluation is the only tool (see: the experiences of the South)
External balance: the approach remains „half-hearted”
However, recent challenges (such as Trump, migration, Brexit, euor zone crisis) point to a more integrated and reformed Europe (banking union, fiscal union). The risk of
„remaining out” is higher than the risks associated with the structural problems of the euro zone, so there is a strong argument for adopting the euro. But! Euro zone entry will not save the countries from the consequences of irresponsible domestic policies.
Estonia
The most famous FinTech company’s founders are Estonians. That is the TransferWise. It provides an international P2P money-transfer option to bank account holders for a lower cost than offered by traditional banks. TransferWise API directly
integrates into mobile and online banks or other digital user experience e.g. instant messaging apps or e-wallets, enabling international money transfers in multiple currencies. The service provides customers with a lower-cost alternative to send money online internationally, processing the transfers within one working day. Banks can significantly improve their product offering with a transparent and easy-to-use money transfer solution included in their service portfolio, enabling their customers to save on service charges.
Bondora. P2P lending platform operating in European market with low competition.
Fortumo. Mobile payment provider for apps and game developers.
Funderbeam. A marketplace for investing in high growth startups via Blockchain technology and trading of resulting tokens that represent the original investments.
Polybius. Fully crowdfunded digital bank based in Estonia using innovative technologies like blockchain, AI, Big Data.
Investly. Invoice financing platform which helps businesses from the UK and Estonia to get access to working capital.
Latvia
4Finance. Short-term credit provider with proprietary automated online lending systems and quick underwriting capability.
Viventor. Peer-to-peer lending platform that connects investors and lenders.
Swaper. P2P marketplace platform for investment activities with buy back guarantee.
Twino. P2P marketplace for unsecured consumer loans from Poland, Denmark and Georgia.
ZoomCharts. Chart based software platform for big data visualization.
Swipe. Helps companies receive online payments quickly and securely.
uTrader. Leading binary trading platform.
DoFinance. P2P platform that provides payday loans and investment programs for individuals in Latvia.
Lithuania
Mokipay. NFC based mobile wallet and Loyalty platform.
ETRONIKA. IT company providing electronic banking and digital identity solutions for financial institutions and non-financial corporates.
Cranberger. Comprehensive global database on exchange traded products, performs due diligence, and provides easy product comparison.
Bankera. Digital bank based on blockchain technology providing deposit, loan, payment and investment services.
Slovak Republic
The Slovak banking sector is innovative and open to new digital solutions. The reasons are twofold: on the one hand, international capital groups often use local subsidiaries to push technologies available in their home markets. On the other, Slovak society seems ready to adopt such innovations, which points to (much more important) internal forces driving the digital transformation. Tatra banka has become a leader of this transformation, as confirmed by its haul of Best Consumer Digital Bank in Slovakia awards – 13 so far, the most recent being in 2015. In 1998, the bank was the first in Slovakia to launch internet banking. Today, this service is used at least once a month by around 250,000 users (30% of the bank’s client base). The share of electronic transactions exceeds 97%. What differentiates Tatra banka from its competitors lies is the detail of its service offering: a tool that tracks spending; ATM withdrawal via mobile phone; spending reports; online applications for service packages; and an intuitive, informative webpage. All these contribute to the likeability of the bank, as seen on Facebook. However, what gives Tatra its competitive edge is not so small: the launch of near field communication (NFC) payments, authentication of customers through voice biometrics (currently half of the client base chooses this verification method), Google Glass banking and an app for smart watches all help to position the bank among European, rather than just national, leaders of innovation (Deloitte 2016, pp. 190).
Leading Slovakian FinTech startups are:
Viamo. Simplified P2P and B2C payment solution that connects bank account numbers to phone numbers.
Datamolino. An online application that automatically extracts purchase and sales information from invoices, bills, and receipts, and pushes the data to accounting systems.
GexPay. Provides an innovative peer-to-peer payment system using QR codes for restaurant services and food companies.
PineVestor. Institutional portfolio management system for wealth managers, family offices and independent asset advisors.
FX Junction. An open social trading network enabling users to simply and easily communicate trade information and interact with other traders from all over the world.
DataTree. Advanced analytics solution for retail banks allowing them to gain insights into customers' needs.
Papaya POS. Integrated mobile POS application, store management and reporting system for SMEs
Slovenia
Most established banks in Slovenia are showing signs of technological maturity. Their offerings include popular innovative solutions such as contactless cards and e-invoicing, while their products are distributed via well-established channels (branch, online and mobile). Customers have access to native mobile banking applications with commonly utilised functions that include reviewing the current account and credit cards and making payments. In general, banking systems for e-banking, the inter-bank clearing system, mobile payments, CRM and BPM are developed by local players. Foreign-owned banks tend to work with global systems providers. Despite the small size of the Slovene market, one local player has managed to succeed in the sector: HRC has developed a central banking system called Hibis, modules of which are in some ten Slovenian banks as well as two banks in Croatia. More than 90% of Slovenian companies can issue and receive invoices in electronic format through their e-banking systems (Deloitte 2016, pp.
206). The leading Slovenian FinTech startup is:
Invoice Exchange. The Invoice Exchange (Borza Terjatev in Slovenian) is an organized marketplace for B2B receivables in Slovenia.
FinTechs in non-EMU member BCEE countries
Bulgaria
The majority of banks are foreign-owned, and the technology they use matches that deployed across their group at the time of investment. Many of these systems are due for
upgrade by 2020. Organizations from a number of countries use Bulgaria as a back office and technology center for Europe, including some financial institutions. The result is that their Bulgarian operations can be used as pilot locations to implement new core banking systems and other specialist technology products. The high-tech market is dominated by the major global players, with only a few niche competitors. This is partly due to the relatively low penetration of internet banking and even lower penetration of mobile banking. The level of trust in the local banking market is another factor in making consumers more conservative about adopting more innovative products, particularly from relatively unknown companies. However, there are Bulgarian companies that focus on specific areas of the financial market, providing solutions in areas such as consumer loans, debt collection, insurance and more. A number of innovative IT companies based in Bulgaria mainly focus their efforts on Western European and North American markets, where the value return is much higher. Bulgaria has the second lowest ratio of banked population (63%) of all CEE countries and the second lowest penetration of online banking (5%). However, almost all banks offer their customers e-banking systems. It seems that banks are aware of changing customer needs and shifting preferences, focusing mainly on digital channels, just as in other CEE and Western European countries. On the one hand, therefore, banks are constantly developing established financial technologies; on the other, however, they are starting to seek innovation through the use of emerging financial technologies (Deloitte 2016, pp.
94-95).
Czech Republic
The Czech banking sector can certainly be considered as one of the most innovative of all CEE countries. One example is contactless cards, which have become synonymous with innovation, especially in CEE. According to Visa Europe the Czech Republic leads the CEE region with 3.3 transactions per month per capita. However, those figures are still below the scores being witnessed in Western European countries (such as the UK’s 30 transactions per month). In terms of value, Czechs spend on average EUR 64 per month per issued card, more than in Spain (EUR 16). As the Czech banking sector is one of the most innovative in the CEE region, many globally-utilized customer-facing products and services have been already implemented. Banks will probably start looking
for new business opportunities (also outside traditional banking segment) in co- operation with FinTech companies working as the facilitators of innovation. They might potentially leverage user-friendly mobile apps handling payments services, personal finance management processes or out-of-the box mobile wallets. Thanks to the open API of these solutions, banks will be able to integrate them seamlessly with their IT systems and, what is most important, create new monetization strategies and open new sources of revenue. This would be required also by the implementation of the EU Directive on Payment Services (PSD2). (Deloitte 2016, pp. 121-124).
Leading Czech FinTech startups:
SoNet. Comprehensive white label payments solution that offers a wide range of software and hardware services, such as payment terminals, cards, tools to manage terminals, loyalty programs and discounts, etc.
Worldcore. An internet-based financial services provider offering modern payment solutions for e-commerce, businesses and individuals.
ShopKeeper. Online cash register and POS solution that offers tailored functionalities for different industries and businesses as well as helps to manage sales.
Live Shop. It emulates physical shopping experience by allowing customers to interact with products through a touch-screen.
ThreatMark. Digital identity sensing tool for banks to enhance user security during online processes.
Cognitive. Fraud Detection. Real-time adaptive fraud detection and user authentication software for web and mobile.
Kup Najisto. Online payment service offering deferred payment methods in the Czech Republic.
Fundlift. A Czech equity crowdfunding platform.
Croatia
Although market leaders and established FSI players produce most FinTech innovations, and their “mother companies” have significant influence, more and more local players are emerging with a focus on the market who are more than capable of delivering inventive FinTech products. In Croatia, big banks and insurance companies tend to have strong IT departments and considerable internal development capability, currently mainly focused on e-banking and m-banking solutions (such as online branches, online credit requests and calculators and new functionalities for applications etc). This leaves considerable opportunity for emerging FinTech companies to offer their
servicer or solutions to smaller players on the market. There is also a trend in government towards enabling users with tokens or accounts from e-banking solutions to use such credentials to log into government services. This indicates that the government is ready to adopt technologies and services that help them, opening a whole new niche market for FinTech companies. The FinTech market in Croatia is still in its early stages, and while there are many possibilities for new and innovative ideas, there are also many obstacles regarding legislation. Even in the age of the growing popularity of online banking, Croats still depend on bricks-and-mortar banking facilities. Online banking penetration in Croatia fell from 20% to 18% between 2010 and 2014. Even though the numbers for Croatia are relatively low in comparison to other CEE countries, banks in Croatia should consider transforming their business model to become more digital (Deloitte 2016, pp. 105-107). Leading Croat FinTech startups:
Oradian. Global technology provider developing solutions to enable financial inclusion. Their innovative cloud-based core banking platform allows financial institutions servicing the billions of customers at the base of the pyramid to radically improve performance, reduce costs and scale services quickly and efficiently.
Fiscal 1. Supplies and services mPOS systems, provides cloud backup and remote support.
BitKonan. Bitcoin trading platform with advanced order management.
Poland
In recent years, Poland has become a regional leader in technologically advanced, pioneering solutions in the banking sector. Mobile is emerging as an essential channel for Polish customers. According to the ING International Survey 2015, 60% of smartphone users have already used mobile banking or expect to use it. This is the third best score in Europe – right behind the Netherlands (67%), the UK (63%) and on a par with Spain. It indicates that mobile banking services have enormous potential for growth in the coming years. On the other hand, 38% of established retail banks in Poland still do not offer their services through the mobile channel, neither via a dedicated app nor a website based on “lite” / RWD (responsive web design)