FinNLP 2020
The Second Workshop on Financial Technology and Natural Language Processing
in conjunction with IJCAI-PRICAI 2020
Proceedings of the Workshop
January 5, 2021
Kyoto, Japan
ii
Sponsor
Preface
It is our great pleasure to welcome you to the Second Workshop on Financial Technology and Natural Language Processing (FinNLP).
The aim of FinNLP is to provide a forum for international participants to share knowledge on applying NLP to the FinTech domain. With the sharing of the researchers in this workshop, we hope that the challenging problems of blending FinTech and NLP will be identified, the future research directions will be shaped, and the scope of this interdisciplinary research area will be broadened.
Due to a great trial of all of us, the COVID-19 virus, the IJCAI-PRICAI conference is postponed to January 2021. In order to accelerate the development of this field, we decide to publish the proceedings in advance. This year, the participants of FinNLP still bring several novel ideas to this forum. We also cooperate with Fortia Financial Solutions to hold two shared tasks in FinNLP, including learning semantic representations (FinSim) and sentence boundary detection in PDF noisy text (FinSBD-2).
We have many people to thank. Dialekti Valsmou Stanislawski and Ismail El Maarouf lead their teams to hold the successful shared tasks and help review several submissions. All of program committee members work very hard to provide their insightful comments to the submissions, and help us select the suitable papers for FinNLP-2020. Many thanks to all participants for submitting their interesting works and sharing their ideas. Besides, we would like to express our gratitude to the MOST Joint Research Center of AI Technology and All Vista Healthcare for financial support.
Chung-Chi Chen, Hen-Hsen Huang, Hiroya Takamura, Hsin-Hsi Chen FinNLP 2020 Organizers
July 2020
iv
Organizations
Organizers
Chung-Chi Chen, National Taiwan University Hen-Hsen Huang, National Chengchi University
Hiroya Takamura, National Institute of Advanced Industrial Science and Technology Hsin-Hsi Chen, National Taiwan University
Shared Task Organizers Willy Au
Abderrahim Ait Azzi Bianca Chong Ismail El Maarouf Youness Mansar Virginie Mouilleron
Dialekti Valsamou-Stanislawski
Program Committee
Paulo Alves, Universidade Católica Portuguesa
Alexandra Balahur, European Commission's Joint Research Centre Paul Buitelaar, Insight Centre for Data Analytics at NUIG
Damir Cavar, Indiana University
Pablo Duboue, Textualization Software Ltd.
Jinhua Du, American International Group, Inc.
Ismail El Maarouf, Fortia Financial Solutions Sira Ferradans, Independent Researcher Kiyoshi Izumi, The University of Tokyo Changliang Li, Kingsoft Corporation Nedim Lipka, Adobe Inc.
Hiroki Sakaji, The University of Tokyo
Dialekti Valsamou-Stanislawski, Fortia Financial Solutions Chuan-Ju Wang, Academia Sinica
Annie T.T. Ying, EquitySim
Wlodek Zadrozny, University of North Carolina in Charlotte
vi
Table of Contents
Financial News Annotation by Weakly-Supervised Hierarchical Multi-label Learning
Hang Jiang, Zhongchen Miao, Yuefeng Lin, Chenyu Wang, Mengjun Ni, Jian Gao, Jidong Lu and Guangwei Shi……….1
Variations in Word Usage for the Financial Domain
Syrielle Montariol, Alexandre Allauzen and Asanobu Kitamoto………..8
Detecting Omissions of Risk Factors in Company Annual Reports
Corentin Masson and Syrielle Montariol……….. ……….15
A Semantic Approach to Financial Fundamentals
Jiafeng Chen and Suproteem Sarkar……….. ………22
Learning Company Embeddings from Annual Reports for Fine-grained Industry Characterization
Tomoki Ito, Jose Camacho Collados, Hiroki Sakaji and Steven Schockaert………...27
Unsupervised Discovery of Firm-Level Variables in Earnings Call Transcript Embeddings
Daniel Edmiston and Ziho Park……….. ………...34
Using Extractive Lexicon-based Sentiment Analysis to Enhance Understanding ofthe Impact of Non-GAAP Measures in Financial Reporting
Stacey Taylor and Vlado Keselj……….. ………...…40
FinSBD-2020: The 2nd Shared Task on Sentence Boundary Detection in Unstructured Text in the Financial Domain
Willy Au, Bianca Chong, Abderrahim Ait Azzi and Dialekti Valsamou-Stanislawski………47
PublishInCovid19 at the FinSBD-2 Task: Sentence and List Extraction in Noisy PDF Text Using a Hybrid Deep Learning and Rule-Based Approach
Janvijay Singh……….. ……….55
aiai at the FinSBD-2 Task: Sentence, list and Item Boundary Detection and Items classification of Financial Texts Using Data Augmentation and Attention
Ke Tian, Hua Chen and Jie Yang……….. ………..62
Daniel at the FinSBD-2 Task: Extracting List and Sentence Boundaries from PDF Documents, a model-driven approach to PDF document analysis
Emmanuel Giguet and Gaël Lejeune……….. ………...67
Subtl.ai at the FinSBD-2 task: Document Structure Identification by Paying Attention
Abhishek Arora, Aman Khullar, Sarath Chandra Pakala, Vishnu Ramesh and Manish Shrivastava………...75
The FinSim 2020 Shared Task: Learning Semantic Representations for the Financial Domain
Ismail El Maarouf, Youness Mansar, Virginie Mouilleron and Dialekti Valsamou-Stanislawski………...81
viii
IITK at the FinSim Task: Hypernym Detection in Financial Domain via Context-Free and Contextualized Word Embeddings
Vishal Keswani, Sakshi Singh and Ashutosh Modi……….. …………..87
Anuj at the FinSim Task: Anuj@FINSIM–Learning Semantic Representation of Financial Domain with Investopedia
Anuj Saini……….. ………93
ProsperAMnet at the FinSim Task: Detecting hypernyms of financial concepts via measuring the information stored in sparse word representations
Gábor Berend, Norbert Kis-Szabó and Zsolt Szántó……….. …………98
FINSIM20 at the FinSim Task: Making Sense of Text in Financial Domain
Vivek Anand, Yash Agrawal, Aarti Pol and Vasudeva Varma……….. 104
Financial News Annotation by Weakly-Supervised Hierarchical Multi-label Learning
Hang Jiang
1, Zhongchen Miao
1, Yuefeng Lin
1, Chenyu Wang
1, Mengjun Ni
1, Jian Gao
1, Jidong Lu
1, Guangwei Shi
11
Innovation Lab, Shanghai Financial Futures Information Technology Co., Ltd, Shanghai, China {jianghang, miaozc, linyf, wangcy1, nimj, gaojian, lujd, shigw}@cffex.com.cn
Abstract
Financial news is an indispensable source for both investors and regulators to conduct research and investment decisions. To focus on specific ar- eas of interest among the massive financial news, there is an urgent necessity of automatic finan- cial news annotation, which faces two challenges:
(1) supervised data scarcity for sub-divided finan- cial fields; (2) the multifaceted nature of finan- cial news. To address these challenges, we tar- get the automatic financial news annotation prob- lem as a weakly-supervised hierarchical multi-label classification. We propose a method that needs no manual labeled data, but a label hierarchy with one keyword for each leaf label as supervision.
Our method consists of three components: word embedding with heterogeneous information, multi- label pseudo documents generation, and hierarchi- cal multi-label classifier training. Experimental re- sults on data from a well-known Chinese financial news website demonstrate the superiority of our proposed method over existing methods.
1 Introduction
To target information of concern among massive financial news quickly, there is a natural demand to search and analyze financial news based on topics. To cater for this, most finan- cial news media adopt a manual annotation solution, which is too tedious to cope with rapidly growing financial news. Be- sides, manual annotation is not intelligent enough to meet the personalized needs of everyone. Therefore, to improve the searching efficiency and analysis accuracy of financial news, a critical step is automatic financial news annotation.
Indeed, the automatic financial news annotation is a clas- sic problem of natural language processing (NLP), that is, text classification. Although related research keeps emerg- ing, however, compared to those common scenarios of fully- supervised flat single-label text classification, our task faces two major challenges. First, supervised model training heav- ily relies on labeled data, while annotated corpus for each sub-divided financial field is cost expensive, considering the significant professional knowledge requirements for manual annotation. Second, a piece of financial news usually talks
about multiple financial products and concepts from multi- ple levels and perspectives, but it is difficult to apply existing mature neural networks to multi-label and hierarchical text classification simultaneously.
In recognition of the challenges above, we propose a weakly-supervised hierarchical multi-label classification method for financial news. Our method is built upon deep neural networks, while it only requires a label hierarchy and one keyword for each leaf label as supervision, without any labeled data requirements. To leverage user-provided super- vised keywords and semantic information in financial news, even though they are unlabeled, our method employs a two- step process of pre-training and self-training. During the pre-training process, we train a classifier with pseudo doc- uments driven by user-provided keywords. Specifically, we model topic distribution for each category with user-provided keywords and generate multi-label pseudo documents from a bag-of-word model guided by the topic distribution. Self- training is a process of bootstrapping, using the predictions of unlabeled financial news as supervision to guide pre-training classifier fine-tuning iteratively. To ensure the effectiveness of self-training, a novel confidence enhancement mechanism is adopted. Besides, we include multi-modal signals of finan- cial news into the word embedding process by heterogeneous information networks (HIN) [Sun and Han, 2012] encoding algorithm.
To summarize, we have the following contributions:
1. We propose a method of weakly-supervised hierarchi- cal multi-label classification for financial news driven by user-provided keywords. With our proposed method, users do need to provide a label hierarchy with one key- word for each leaf label as the supervised source but not any manual labeled data.
2. To bridge the gap between low-cost weak supervision and expensive labeled data, we propose a multi-label pseudo documents generation module that almost re- duces the annotation cost to zero.
3. In the hierarchical multi-label classification model train- ing process, we transform the classification problem into a regression problem and introduce a novel confidence enhancement mechanism in the self-training process.
4. We demonstrate the superiority of our method over var-
ious baselines on a dataset from Cailianshe1 (a well- known Chinese financial news website), conduct a thor- ough analysis of each component, and confirm the prac- tical significance of hierarchical multi-label classifica- tion by an application.
2 Related Work
Financial text mining
As an important branch of fintech, financial text mining refers to obtaining valuable information from massive un- structured text data, which has attracted the attention of many researchers. The research object of text mining can be a com- pany’s financial report [Baiet al., 2019], as well as self-media content such as Weibo (Chineses twitter) [Wanget al., 2019].
The purpose of the research is also different, for example, studies [Sunet al., 2016; Seong and Nam, 2019] analyze mar- ket prediction using financial news, and study [Koganet al., 2009] is dedicated to risk discovery. In our work, we take the financial news as the research object, and annotate each piece of news with multiple labels from a label hierarchy automat- ically.
Weakly-supervised text classification
Despite the maturity of adopting neural networks in super- vised learning, the requirements for labeled data are ex- tremely expensive and full of obstacles, so weakly-supervised learning emerges as the times require. Above all classic works, it can be roughly divided into two directions: extend- ing the topic model in the semantic space by user-provided seed information [Chen et al., 2015; Li et al., 2016], and transforming weakly-supervised learning to full-supervised learning by generating pseudo documents [Zhang and He, 2013; Menget al., 2018].
Hierarchical text classification
Hierarchical classification is more complicated than flat one, considering the hierarchy of labels. A lot of research on ap- plying SVM in hierarchical classification [Cai and Hofmann, 2004; Liuet al., 2005] has been started from the first applica- tion of [Dumais and Chen, 2000]. Hierarchical dataless clas- sification [Song and Roth, 2014] projects classes and docu- ments into the same semantic space by retrieving Wikipedia concepts. [Menget al., 2019; Zhanget al., 2019] is a contin- uation of the work in [Menget al., 2018], which solves the problem of hierarchical classification through a top-down in- tegrated classification model. To our best knowledge, there is no hierarchical multi-label classification method based on weak supervision so far.
3 Problem Statement
We take the financial news annotation as a task of weakly- supervised hierarchical multi-label classification. Specifi- cally, each piece of news can be assigned multiple labels, and each category can have more than one children categories but can only belong to at most one parent category.
To solve our task, we ask users to provide a tree-structured label hierarchy T and one keyword for each leaf label in
1The website of Cailianshe: https://cls.cn
T. Then we propagate the user-provided keywords upwards from leaves to root inT, that is, for each internal category, we aggregate keywords of its all descendant leaf classes as supervision.
Now we are ready to formulate the problem. Given a class hierarchy tree T with one keyword for each leaf class in T, and news corpora D = {D1, D2, ..., DN} as well. The weakly-supervised hierarchical multi-label classi- fication task aims to assign the most likely labels setC = {Cj1, Cj2, ..., Cjn|Cji ∈ T } to each Dj ∈ D, where the number of assigned labels is arbitrary and Cji stays for classes at any level.
4 Methodology
The framework of our method is illustrated in Figure 1, which can be divided into three phases. Because the corpus we use is in Chinese, word segmentation is an essential step before classification. Considering the specificity of the financial cor- pus, we construct a financial segmentation vocabulary includ- ing financial entities, terminologies and English abbreviations by neologism discovery algorithm [Yaoet al., 2016].
4.1 Word embedding with heterogeneous information
Compared to plain textual data, financial news is a complex object composed of multi-modal signals, including news con- tent, headline, medium, editor, and column. These signals are beneficial to topic classification, for example, editors are in- dicative because two pieces of news are more likely to share similar topic if they are supplied by the same editor as editors usually have stable specialty and viewpoints.
To learn d-dimensional vector representations for each word using such significant multi-modal signals in the corpus, we construct a HIN centered upon words [Zhanget al., 2019].
Specifically, corresponds to heterogeneous information in fi- nancial news, we include seven types of nodes: news (N), columns (C), headlines (H), media (M), editors (E), words (W) and labels (L). In which, headlines (H) and words (W) are tokens segmented from title and content respectively. As a word-centric star schema is adopted, we add an edge between a word node and other nodes if they appear together, thus the weights of edges reflect their co-occurrence frequency.
Given a HIN following the above definition of nodes and edges, we can obtain word representations by learning nodes embeddings in this HIN. We use ESIM [Shanget al., 2016], a typical HIN embedding algorithm, to learn nodes representa- tions by restricting the random walk under the guidance of user-specified meta-paths. To guide the random walk, we need to specify meta-paths centered upon words and assign the weights by the importance of meta-path. In our method, we specify meta-paths asW–N–W,W–H–W,W–M–W, W–E–W,W−C−WandW–L–Wwith empirical weights, modeling the multi-types of second-order proximity [Tanget al., 2015] between words. Furthermore, we perform normal- izationvw ← vw/||vw|| on embedding vectorvwfor each wordw.
2
Figure 1: The framework of proposed method.
4.2 Multi-label pseudo documents generation In this section, we first model class distribution in a semantic space with user-provided keywords, and then generate multi- label pseudo documents as supervised training data based on them.
Modeling class distribution
Assume that words and documents shared a uniform seman- tic space, so that we can leverage user-provided keywords to learn a class distribution [Menget al., 2018].
Specifically, we first take the inner product of two em- bedding vectorsvTw1vw2as similarity measurement between two wordsw1andw2to retrieve topnnearest keywords set Kj = {wj0, wj1, ..., wjn} in semantic space for each class j based on user-provided keywordwj0. Remind that we do not specify the parameternabove but terminate the keywords retrieving process when keyword sets of any two classes tend to intersect to ensure the absolute boundary between differ- ent classes. Then we fit the expanded keywords distribution f(x|Cj)to a mixture von Mises-Fisher (vMF) distributions [Banerjeeet al., 2005] to approximate class distribution for each class:
f(x|Cj) =
m
X
h=1
αhfh(x|µh, κh) (1) wherefh(x|µh, κh), as a component in the mixture with a weightαh, is the distribution of theh-th child of category Cj, mis equal to the number of Cj’s children in the label hierarchy. In fh(x|µh, κh), µh is the mean direction vec- tors andκhis the concentration parameter of the vMF distri- bution, which can be derived by Expectation Maximization (EM) [Banerjeeet al., 2005].
Pseudo documents generation
Given distribution for each class, we use a bag-of-words based language model to generate multi-label pseudo docu- ments. We first samplel document vectorsdi from various class distributionf(x|C)(l is not specific), and then build a vocabulary Vdi that contains the top γ words closest to di in semantic space for each di. Given a vocabulary set Vd = {Vd1, Vd2, ..., Vdl}, we choose a number of words to generate pseudo document with probaliblityp(w|D). For- mally,
p(w|D) =
βpB(w) w /∈ Vd
βpB(w) + (1−β)pD(w) w∈ Vd (2) whereβis a ”noisy” parameter to prevent overfitting,pB(w) is the background words distribution (i.e., word distribution in the entire corpus),pD(w)is the document-specific distri- bution, that is,
pD(w) = 1 l
l
X
i=1
exp dTivw P
w0∈Vdiexp dTivw0 (3) wherevwis the embedding of wordw. Meanwhile, pseudo labels need to be expressed. Suppose existingk document vectorsdiare generated from classj, then the label of classj of documentDcan be represented by,
label∗(D)j =tanh(σ(k(1−β) l + β
m)) (4) where σ is a scale parameter to control the range of label∗(D)j, and generally takes an empirical value.
Otherwise, if∀diis not generated from classj,
label∗(D)j=β/m (5)
Algorithm 1Multi-label Pseudo Documents Generation Input: Class distribution set{f(x|Cj)|mj=1}.
Parameter: number of probability distribution β to gener- ate multi-label pseudo documents for each class; number of pseudo documentsγ.
Output: A set ofγ multi-label pseudo documentsD∗ and corresponding labels setL∗
1: InitializeD∗← ∅,L∗← ∅,p← ∅;.
2: forclass index j f rom1to mdo
3: forprobability distribution index i f rom1to βdo 4: Sample document vectordifromf(x;Cj);
5: Calculate probability distributionp(w|di)based on Eq 2 // parameterl= 1in Eq 2;
6: p←p∪p(w|di) 7: end for
8: end for
9: Sampleγprobability distribution combinations fromp 10: forcombination index i f rom1to γdo
11: D∗i ← empty string
12: Calculate probability distribution p(w|Di) based on Eq 2
13: Samplewik∼p(w|Di)
14: D∗i =Di∗+wik//concatenatewikafterD∗i 15: Calculate labelL∗i based on Eq 4 and Eq 5 16: D∗←D∗∪D∗i
17: L∗← L∗∪ L∗i 18: end for
19: returnD∗,L∗
wheremis the number of children classes related to the local classifier.
Algorithm 1 shows the entire process for generating multi- label pseudo-documents.
4.3 Hierarchical multi-label classifier training In this section, we pre-train CNN-based classifiers with pseudo documents and refine it with real unlabeled docu- ments.
Pre-training with pseudo documents
Hierarchical classification model pre-training can be split into two parts: local classifier training for nodes and global classi- fier ensembling. We trained a neural classifierML(·)for each class with two or more children classes. ML(·) has multi- scale convolutional kernels in the convolutional layer, ReLU activation in the hidden layer, and Sigmoid activation in the output layer. As the pseudo label is a new distribution instead of binarization vectors, we transform task from multi-label classification to regression and minimizing the mean squared error (MSE) loss from the network outputs to the pseudo la- bels.
After training a series of local classifiers, we need to build a global classifierGk by integrating all local classifiers from the root node to levelkfrom top to bottom. The multiplica- tion between the output of the parent classifier and child clas- sifier can be explained by conditional probability formula:
p(Di∈Cc) =p(Di∈Cc∩Di∈Cp)
=p(Di∈Cc|Di ∈Cp)p(Di∈Cp) (6) where, classCc is the child of classCp. When the formula is called recursively, the final prediction can be obtained by the product of all local classifier outputs on the path from the root node to the target node.
Self-training with unlabeled real documents
To take advantage of semantic information in the real docu- ments, we utilize the prediction of real documents as super- vision in the self-training procedure iteratively. However, if the predictions are used as the supervision for the next iter self-training directly, the self-training can hardly go on be- cause the model has been convergent in pre-training. To ob- tain more high-confidence training data, we adopt a confi- dence enhancement mechanism. Specifically, we calculate the confidence of predictions by Eq 7 and only reserve data with high-confidence as training data.
conf(q) =−log(Pm
i=1qi+ 1) Pm
i=1qilogqi
. (7)
wherem≥2is the number of children ofCj.
In addition, we notice the true label of a real document is either zero or one, thus, we conduct a normalization onGk’s predictions by the following formula:
label∗∗(Di)j= label∗(Di)j
maxj0(label∗(Di)j0) (8) When the change rate ofGk’s outputs of real documents is lower thanδ, the self-training will stop earlier.
5 Experiments
Three things will be demonstrated in this section. First, the performance of our method is superior to various baselines for the weakly-supervised hierarchical multi-label financial news classification task (Section 5.2). Second, we carefully evaluate and analyze the components in our method proposed in Section 4(Section 5.3). Third, we reveal the business sig- nificance in the task of hierarchical multi-label classification for financial news by an application(Section 5.4).
5.1 Experiments setup Dataset
We collect a dataset from a well-known Chinese financial news website, Cailianshe, to evaluate the performance of our method.
The dataset statistics are provided in Table 1: the news cor- pus consists of 7510 pieces of financial news with 2 super- categories and 11 sub-categories, covering the major insti- tutions and product categories in China mainland financial markets. The label hierarchy refers to Figure 2 for details, in which the colored italics are user-provided keywords for leaf labels.
4
Figure 2: The label hierarchy for Chinese financial market.
dataset classes docs
(level1+level2)
FIN-NEWS-CN 2+11 7510
Table 1: Dataset Statistic
It should be noted that we maintained an unbalanced dataset to truly reflect the market size and shares of the Chi- nese financial market. For example, financial futures account for only 10% but stocks account for 53% in the dataset. This is because there is a mature stock market in China, while the beginning of financial futures in China is late and the ini- tial stage comes into being until China Financial Futures Ex- change (CFFEX) launches CSI 300 futures in 2010 to some extent.
Baselines
• WeSHClass[Meng et al., 2019] provides a top-down global classifier for the hierarchical classification, which supports multiple weakly supervised sources.
• HiGitClass [Zhang et al., 2019] utilizes HIN encod- ing to solve a hierarchical classification task of GitHub repositories, with user-provided keywords as weak seed information.
Note that WeSHClass and HiGitClass can only output at most a single-label at each level. To compare with our method, we adjust the activation and loss function of base- lines to fit a multi-label classification task, but they are still unable to generate multi-label pseudo documents.
Evaluation Metrics
According to the common standards for evaluating classifica- tion, we use Micro-F1 and Macro-F1 scores as metrics for classification performances at level 1, level 2, and overall classes respectively.
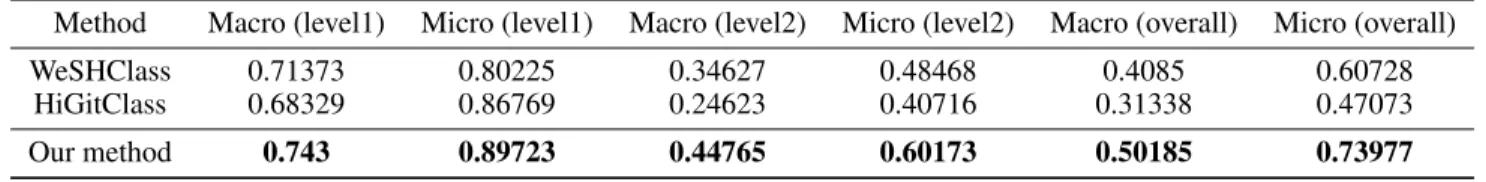
5.2 Performance comparison with Baselines Table 2 demonstrate the superiority of our proposed method over baselines on the financial news dataset. It can be ob- served from Table 2 that our method has a significant im- provement over baselines, whether at level 1, level 2, or over- all classes. This is because we borrow the self-training mech- anism of WeSHClass and HIN encoding of HIGitClass at the same time, and propose a suitable multi-label pseudo doc- uments generation module in addition. However, for fine- grained labels, our method is still far from excellent although the average F1 scores improvement approaches 20% at level 2 comparing to baselines, which reflects the difficulty of this task.
5.3 Components Performance Evaluation
To evaluate each components, we carefully analyze perfor- mance of models with or without different components in Figure 3 and Figure 4.
Figure 3: Performances Comparision of classificaton with pseudo documents and manual annotation documents
Qualitatively, the effectiveness of the multi-label pseudo document generation module has been demonstrated in pre- vious training, and its quantitative value will be carefully analyzed by replacing the pseudo documents with manually labeled data. As we can observe in Figure 3, F1 score of
Method Macro (level1) Micro (level1) Macro (level2) Micro (level2) Macro (overall) Micro (overall)
WeSHClass 0.71373 0.80225 0.34627 0.48468 0.4085 0.60728
HiGitClass 0.68329 0.86769 0.24623 0.40716 0.31338 0.47073
Our method 0.743 0.89723 0.44765 0.60173 0.50185 0.73977
Table 2: Performance comparison for all method, using Micro-F1 and Macro-F1 scores as metrics at all levels.
pseudo documents training modelis slightly lower thanla- beled documents training model at level 1, but for level2 and overall classes, the former stays lower than the latter un- til the number of labeled documents reaches 120 per class. To some extent, this component can save 1560 (120per class× 13classes) pieces of documents labeling cost.
To analyze the effect of heterogeneous information and self-training, we conduct model ablation experiments to com- pare performances of two variants (No heterogeneous infor- mationandNo self-training) and ourFull method. Here, the method of No heterogeneous information means hetero- geneous information is not included in the word embedding process, and the method of No self-training means the self- training process is removed from the complete model. Over- all F1 score in Figure 4 illustrates that both No heterogeneous information and No self-training perform are worse than the Full method. Therefore, embedding words with heteroge- neous information and self-training with unlabeled real data play essential roles in financial news classification.
Figure 4: Comparison among No heterogeneous information, No self-training and Full method.
5.4 Application
A good classification can not only label each document ap- propriately but also can mine the hidden information behind the corpus. This section gives an example of a practical ap- plication, that is, discovering a correlation of business signif- icance behind labels. In brief, we calculate the Pearson co- efficients across all labels to draw a label correlation matrix in Figure 5, whose colors from shallow to deep represent the labels correlation is from weak to strong.
We only analyze the lower triangular matrix due to its sym- metry, observing following two phenomena: (1) Correlations between different exchanges and products are different (e.g., CFFEX has a strong correlation with financial futures) and
correlations between different exchanges are different as well (e.g., there is a strong correlation between Shanghai Stock Exchange (SSE) and Shenzhen Stock Exchange (SZSE)).
This phenomenon implies the main products of exchanges and their relationships. (2) Commodity futures are highly un- correlated with stock exchanges or securities products such as stocks, while financial futures are not. This is because com- modity futures (e.g., petroleum futures) take spot commodi- ties as subject matter but financial futures (e.g., stock indexes futures) take securities products as subject matter. These phe- nomena are aligned with the reality of China’s financial mar- ket, which demonstrates that targeting the financial news an- notation task as hierarchical multi-label classification does have its practical application value, such as quickly under- standing the relationship between different institutions, prod- ucts, and concepts in complex financial markets.
Figure 5: The labels correlation matrix, reflecting information about relationship between different financial concepts.
6 Conclusion
In this paper, we proposed a weakly-supervised hierarchical multi-label classification method with three modules for fi- nancial news, which enables us to effectively overcome chal- lenges of supervision scarcity and the multifaceted nature of financial news. Experiments on a Chinese financial news dataset demonstrate the performance of our near-zero cost solution for hierarchical multi-label classification. Besides, we reveal the practical value and business significance of hi- erarchical multi-label classification in a real-world applica- tion. In the future, we would like to improve the quality of pseudo documents by label promotion methods such as the label propagation mechanism. With more accurate labels for pseudo documents, the performance of the model trained with pseudo documents will be further improved.
6
References
[Baiet al., 2019] Haodong Bai, Frank Z Xing, Erik Cambria, and Win-Bin Huang. Business taxonomy construction us- ing concept-level hierarchical clustering. arXiv preprint arXiv:1906.09694, 2019.
[Banerjeeet al., 2005] Arindam Banerjee, Inderjit S Dhillon, Joydeep Ghosh, and Suvrit Sra. Clustering on the unit hypersphere using von mises-fisher dis- tributions. Journal of Machine Learning Research, 6(Sep):1345–1382, 2005.
[Cai and Hofmann, 2004] Lijuan Cai and Thomas Hofmann.
Hierarchical document categorization with support vector machines. InProceedings of the thirteenth ACM interna- tional conference on Information and knowledge manage- ment, pages 78–87, 2004.
[Chenet al., 2015] Xingyuan Chen, Yunqing Xia, Peng Jin, and John Carroll. Dataless text classification with descrip- tive lda. InTwenty-Ninth AAAI Conference on Artificial Intelligence, 2015.
[Dumais and Chen, 2000] Susan Dumais and Hao Chen. Hi- erarchical classification of web content. InProceedings of the 23rd annual international ACM SIGIR conference on Research and development in information retrieval, pages 256–263, 2000.
[Koganet al., 2009] Shimon Kogan, Dimitry Levin, Bryan R Routledge, Jacob S Sagi, and Noah A Smith. Predicting risk from financial reports with regression. InProceedings of Human Language Technologies: The 2009 Annual Con- ference of the North American Chapter of the Association for Computational Linguistics, pages 272–280, 2009.
[Liet al., 2016] Chenliang Li, Jian Xing, Aixin Sun, and Zongyang Ma. Effective document labeling with very few seed words: A topic model approach. InProceedings of the 25th ACM international on conference on information and knowledge management, pages 85–94, 2016.
[Liuet al., 2005] Tie-Yan Liu, Yiming Yang, Hao Wan, Hua- Jun Zeng, Zheng Chen, and Wei-Ying Ma. Support vector machines classification with a very large-scale taxonomy.
Acm Sigkdd Explorations Newsletter, 7(1):36–43, 2005.
[Menget al., 2018] Yu Meng, Jiaming Shen, Chao Zhang, and Jiawei Han. Weakly-supervised neural text classi- fication. In Proceedings of the 27th ACM International Conference on Information and Knowledge Management, pages 983–992, 2018.
[Menget al., 2019] Yu Meng, Jiaming Shen, Chao Zhang, and Jiawei Han. Weakly-supervised hierarchical text clas- sification. InProceedings of the AAAI Conference on Ar- tificial Intelligence, volume 33, pages 6826–6833, 2019.
[Seong and Nam, 2019] NohYoon Seong and Kihwan Nam.
Predicting stock movements based on financial news with systematic group identification. Journal of Intelligence and Information Systems, 25(3):1–17, 2019.
[Shanget al., 2016] Jingbo Shang, Meng Qu, Jialu Liu, Lance M Kaplan, Jiawei Han, and Jian Peng. Meta- path guided embedding for similarity search in large-
scale heterogeneous information networks. arXiv preprint arXiv:1610.09769, 2016.
[Song and Roth, 2014] Yangqiu Song and Dan Roth. On dataless hierarchical text classification. InTwenty-Eighth AAAI Conference on Artificial Intelligence, 2014.
[Sun and Han, 2012] Yizhou Sun and Jiawei Han. Min- ing heterogeneous information networks: principles and methodologies. Synthesis Lectures on Data Mining and Knowledge Discovery, 3(2):1–159, 2012.
[Sunet al., 2016] Andrew Sun, Michael Lachanski, and Frank J Fabozzi. Trade the tweet: Social media text mining and sparse matrix factorization for stock market predic- tion. International Review of Financial Analysis, 48:272–
281, 2016.
[Tanget al., 2015] Jian Tang, Meng Qu, Mingzhe Wang, Ming Zhang, Jun Yan, and Qiaozhu Mei. Line: Large- scale information network embedding. In Proceedings of the 24th international conference on world wide web, pages 1067–1077, 2015.
[Wanget al., 2019] Chenyu Wang, Zhongchen Miao, Yue- feng Lin, and Jian Gao. User and topic hybrid context em- bedding for finance-related text data mining.2019 Interna- tional Conference on Data Mining Workshops (ICDMW), pages 751–760, 2019.
[Wei and Zou, 2019] Jason Wei and Kai Zou. EDA: Easy data augmentation techniques for boosting performance on text classification tasks. In Proceedings of the 2019 Conference on Empirical Methods in Natural Language Processing and the 9th International Joint Conference on Natural Language Processing (EMNLP-IJCNLP), pages 6382–6388, Hong Kong, China, November 2019. Asso- ciation for Computational Linguistics.
[Yaoet al., 2016] Rongpeng Yao, Guoyan Xu, and Jian Song. Micro-blog new word discovery method based on improved mutual information and branch entropy.Journal of Computer Applications, pages 2772–2776, 2016.
[Zhang and He, 2013] Pu Zhang and Zhongshi He. A weakly supervised approach to chinese sentiment classification us- ing partitioned self-training. Journal of Information Sci- ence, 39(6):815–831, 2013.
[Zhanget al., 2019] Yanyong Zhang, Frank F. Xu, Sha Li, Yu Meng, Xuan Wang, Qi Li, and Jiawei Han. Higit- class: Keyword-driven hierarchical classification of github repositories.2019 IEEE International Conference on Data Mining (ICDM), pages 876–885, 2019.
Variations in Word Usage for the Financial Domain
Syrielle Montariol
1,2,4∗, Alexandre Allauzen
3, Asanobu Kitamoto
41
Universit´e Paris-Saclay, CNRS, LIMSI, 91400, Orsay, France.
2
Soci´et´e G´en´erale, Paris, France
3
ESPCI, Universit´e Paris Dauphine - PSL, Paris, France
4
National Institute of Informatics, Tokyo, Japan
syrielle.montariol@limsi.fr, alexandre.allauzen@espci.fr, kitamoto@nii.ac.jp
Abstract
Natural languages are dynamic systems; the way words are used vary depending on many factors, mirroring the divergences of various aspects of the society. Recent approaches to detect these varia- tions through time rely on static word embedding.
However the recent and fast emergence of contex- tualised models challenges the field and beyond.
In this work, we propose to leverage the capac- ity of these new models to analyse financial texts along two axes of variation: the diachrony (tem- poral evolution), and synchrony (variation across sources and authors). Indeed, financial texts are characterised by many domain-specific terms and entities whose usage is subject to high variations, reflecting the disparity and evolution of the opinion and situation of financial actors. Starting from a corpus of annual company reports and central bank statements spanning 20 years, we explore in this paper the ability of the language model BERT to identify variations in word usage in the financial domain, and propose a method to interpret these variations.
1 Introduction
It is well know that all languages gradually evolve over decades and centuries, mirroring the evolution of the society.
However, variation in word usage is not limited to long-term evolution. Many fine-grained variations can be found at a smaller scale. One the one hand, in the short term, the us- age of a word can vary in response to sudden events that do not necessarily alter its meaning, but can momentarily change the way it is used. On the other hand, the usage of a word can vary depending on the person that uses it: several dimensions (geographical, cultural) can lead communities to use words in a different way depending on the local interests and concerns.
These two kinds of variations are calleddiachronic(through time) andsynchronic(across any other dimension than time).
In the financial domain, detecting the variations in word usage through time can lead to better understanding of the stakes and concerns of each time period [Purveret al., 2018].
∗Contact Author
In a synchronic way, many dimensions can be observed: how the words are used depending on the business line, the coun- try of origin, the company or organisation that produces the document... This way, the opinions, behaviour and preoccu- pations of the writer can transpire through its specific usage of words. This information can be useful to financial analysts to better understand the variations of concerns and viewpoints of financial actors (for example, by analysing text from the regulatory authorities), identify the impact of an event on dif- ferent actors through time (using high temporal granularity data sources), or analyse the evolution of a crisis.
In other words, we look forweak signalsthrough the scope of word usage change. A weak signal is an element observed from data that has ambiguous interpretation and implication, but may be of importance in the understanding and predic- tion of events (present or future). In the financial domain, any change in strategy, emerging concern or unusual event linked to a financial actor can be a weak signal; identifying relevant weak signals and interpreting them is an extremely challenging task.
In this paper, we study word usage change as a potential signal of evolution in the situation and opinion of a financial actor. When an analyst reads a set of financial documents, the diachronic and synchronic variations in word usage are not immediately visible. But they might reveal valuable informa- tion, if they can be detected and interpreted. For example, it can be shown that the connotation of the vocabulary used by central banks in their reports and statements is strongly influenced by the economic situation [Buechelet al., 2019], despite the sensitivity of their position.
As a growing amount of historical textual data is digitised and made publicly available, automated methods of Natural Language Processing (NLP) emerge to tackle the diachronic aspect of this task. The models usually rely on static word embeddings such as Word2Vec [Mikolovet al., 2013] which summarise all senses and uses of a word into one vector at one point in time. This prevents the model from detecting more fine-grained variations of word usage (polysemy) according to its various contexts of occurrences. To tackle this prob- lem, a new set of methods called contextualised embeddings has appeared recently. They allow to represent words at the token level by relying on their context. Several pre-trained language models (BERT [Devlin et al., 2019], ELMO [Pe- terset al., 2018]...) have appeared for this purpose in the past
8
Proceedings of the Second Workshop on Financial Technology and Natural Language Processing
two years. We rely on the model BERT, as Wiedemann et al.[2019] show its superiority in disambiguating word senses compared to other contextualised embeddings models.
In this paper, we use BERT to determine in a fine-grained way the different kinds of use of a word and the distribution of these uses in a financial corpus. Our goal is to analyse financial texts in a diachronic and synchronic way, as a pre- liminary investigation to address the following questions:
In a synchronic way, what do word usages reveal about the opinion and behaviour of different financial actors? In a diachronic way, what does it says about their evolution? Can it allow to better understand past and ongoing events through the scope of word usage change?
The key points of this paper are:
1) Studying word use variations across any dimension in the financial domain (e.g. time, business line, financial actor).
2) Proposing a method to measure and interpret the varia- tions of a word usage across a dimension.
The model and the pipeline are described in section 3. The experiments in section 4 are made on a corpus of annual com- pany reports and a corpus of central bank statements, both spanning two decades, described in section 4.1.
2 Related Work
Before the generalisation of word embeddings, measuring di- achronic semantic change used to rely on detecting changes in word co-occurrences, and on approaches based on distri- butional similarity [Gulordava and Baroni, 2011].
A more recent set of methods rely on word embeddings [Mikolov et al., 2013] and their temporal equivalent, di- achronic word embeddings models. They rely on the assump- tion that a change in the context of a word mirrors a change in its meaning or usage. These models have undergone a surge in interest these last two years with the publication of several literature review articles [Tahmasebiet al., 2018].
These models usually consist in dividing a temporal corpus into several time slices. The two most broadly used methods areincremental updating[Kimet al., 2014] andvector space alignment[Hamilton et al., 2016]. In the first one, an em- bedding matrix is trained on the first time slice of the corpus and updated at each successive time slice using the previous matrix as initialisation. For the second method, an embed- ding matrix is trained on each time slice independently. Due to the stochastic aspect of word embeddings, the vector space for each time slice is different: an alignment has to be per- formed by optimising a geometric transformation.The align- ment method was proved to be superior to the incremental updating method, on a set of synthetic semantic drifts [Shoe- market al., 2019]. It has been extensively used in the liter- ature. However, these methods do not take into account the polysemy of words, summarising all the possibles senses into one vector at each time step. An exception is the system from Frermann and Lapata [2016] which analyses the evolution of sets of senses using a Bayesian model.
In parallel, the analysis of synchronic variations is mostly done through domain-specific word sense disambiguation (WSD). Some research use similarity measures between static word embeddings to analyse the variations in a vocab-
ulary among several communities [Tredici and Fern´andez, 2017]. More recently, Schlechtweg et al. [2019] analyse both diachronic and synchronic drifts using static word em- beddings with vector space alignment.
The recent rise of contextualised embeddings (for exam- ple BERT [Devlin et al., 2019] or ELMO [Peters et al., 2018]) brought huge change to the field of word represen- tation. These models allow each token – each occurrence of a word – to have a vector representation that depends on its context. When pre-trained on large datasets, they improve the state-of-the-art on numerous NLP tasks. Similarly, contex- tualised embeddings can be used for better semantic change detection.
It was first used in a supervised way [Hu et al., 2019]:
for a set of polysemic words, a representation for each of their sense is learned using BERT. Then a pre-trained BERT model is applied to a diachronic corpus, extracting token embeddings and matching them to their closest sense em- bedding. Finally, the proportions of every sense is com- puted at each successive time slice, revealing the evolu- tion of the distribution of senses for a target word. How- ever, this method requires to know the set of senses of all target words beforehand. Another possibility is to use clustering on all token representations of a word, to auto- matically extract its set of senses [Giulianelli et al., 2019;
Martincet al., 2020a]. Our analysis in this paper derives from this last set of methods.
3 Model and Pipeline
We briefly describe the model BERT [Devlinet al., 2019] and present the pipeline of detection and interpretation of word use variation.
3.1 Contextualised Embeddings Model: BERT BERT stands for Bidirectional Encoder Representations from Transformers. It is a method for pre-training language rep- resentations that gets state-of-the-art results in a large variety of NLP tasks. The main idea relies on the principle of trans- fer learning: pre-training a neural network model on a known task with a substantial amount of data before fine-tuning it on a new task.
The architecture of BERT is a multi-layer bidirectional Transformer encoder [Vaswaniet al., 2017], a recent and pop- ular attention model, applied to language modelling. The key element to this architecture is the bidirectional training, which differs from previous approaches. It is enabled by a new train- ing strategy, Masked Language Model: 15% of the tokens in each input sequence are selected, from which 80% are re- placed with a [MASK] token. The model is trained to pre- dict the original value of these selected tokens using the rest of the sequence. A second training strategy is used, named Next Sentence Prediction (NSP): a set of pairs of sentences is generated for input, with 50% beings pairs of successive sentences extracted from a document, and 50% being two random sentences from the corpus. The model is trained to predict if the two sentences are successive or not.
BERT is mostly used in the literature as a pre-trained model before being fine-tuned on the task of interest, by
adding a task-specific layer to the architecture (Sentiment Classification, Named Entity Recognition...). On the con- trary, what we are interested in when using BERT is the pre- trained language understanding model which, applied to any sequence, allows to extract contextualised representations for each token (feature-based approach).
3.2 Detecting Variations
We consider a corpus where each sequence is labelled with the time it was written, and the person who wrote it. The author can be characterised by several dimension (the com- munity he belongs to, its geographical location...) that are the synchronic dimensions for the analysis.
We apply a pre-trained BERT model on this corpus; To get a vector representation of all tokens of a sequence, we con- catenate the top four hidden layers of the pre-trained model, as advised by Devlinet al.[2019]. Thus, we obtain a vector representation for each token of each sentence.
In order to identify the various types of usages of a word, we want to apply a clustering algorithm to the set of token embeddings. Previous works using BERT rely on hand-picking a small amount of target words for semantic change analysis [Giulianelli et al., 2019; Hu et al., 2019;
Martincet al., 2020b]. Our goal is to detect in the full vocab- ulary which words undergo a variation of usage; however, the clustering step is computationally heavy and can not be com- puted for a large vocabulary. Thus, we use a preliminary step to detect high-variation words, by extending the approach of [Martincet al., 2020a] to synchronic analysis.
For a given target word, we compute a variation metric for each of its dimensions of variation. First, we calculate the average token embedding on the full corpus, and the average token embedding for each class of the dimension (for exam- ple, for each author or for each year). Then, we take the mean of the cosine distance between each average class embedding and the full corpus average embedding.
We sort the vocabulary according to the variation mea- sures, and select a limited list of target words from the top ranking words. For each selected word, we apply a clustering on all its token representations across the full corpus.
3.3 Clustering Token Embeddings
We use two clustering methods: K-Means and affinity propa- gation. The affinity propagation algorithm, less common than K-Means, is chosen for two reasons:
First, it has proven its efficiency in the literature for word sense induction [Alagi´cet al., 2018], a task very close to what we want to achieve.
Second, it does not require the number of clusters to be se- lected manually, which is convenient for our task where the number of usages varies a lot depending on the word and is tricky to determine. Indeed, this number does not necessar- ily match the number of senses of the target word. As BERT does not induce perfectly semantic representations, the con- textualised representations are heavily influenced by syntax [Coenenet al., 2019]. Thus, the clusters obtained from the representations of a word do not naturally reflect the different senses of the word; more widely, it only reflects the different ways it is used.
Affinity propagation is an iterative clustering algorithm.
The main idea is that all data points communicate by send- ing messages about their relative attractiveness and availabil- ity, using the opposite of the euclidean distance as similarity measure. Eventually, clusters of similar points emerge.
This algorithm often leads to a high number of clusters.
This allows a very precise distinction of the different types of contexts the words appears in; however, in such situation with a high number of small clusters, it is much harder for a financial analyst to provide an interpretation of the different clusters and of the variation of word usage.
3.4 Analysing Clustering Results
After the clustering, all the occurrences of a word are dis- tributed into clusters. Each token is labelled by its diachronic dimension (the time slice where the token appears), and its synchronic dimension (the class of the document).
We construct the probability distributions of the types of usages of a target word for each class of a dimension. For example, in the case of the time dimension, each token is as- sociated with one time slice of our corpus. For each time slice, we extract the distribution of usages of the word across the clusters. We normalise it by the number of tokens. We ob- tain the probability distributions of clusters through the time dimension. The process is the same in the synchronic case.
We can compare these distributions together to extract sev- eral pieces of information:
1. How much the distributions of usages vary for the word through the dimension?
2. At what time a usage drift happens (for the diachronic dimension); which actor has a different usage distribu- tion compared to the other ones?
3. What is the change about, which usages of the word are involved? How to make an interpretation of this change?
For the first element we use the Jensen-Shannon divergence (JSD), a metric to compare two probability distributions, and its generalisation tonprobability distributionsd1, d2, . . . , dn
[R´e and Azad, 2014]. WithHbeing the entropy function, the generalised JSD is:
JSD(d1, d2, . . . , dn) =H Pn
i=1di n
− Pn
i=1H(di)
n (1)
It is applicable in both synchronic and diachronic cases.
For the second element, we compare each distribution with the average distribution of the full dimension. For example, in the diachronic case, we average the distributions for all the time slices element-wise. Then, we compute the Jensen- Shannon divergence with the global average distribution.
In order to capture the clusters involved in the variation, we identify the ones that have an uneven distribution across all the elements of the dimension. It allows for example to find the clusters specific to a given actor, the clusters that vary the most, or the ones that appear or disappear through time.
Finally for the third element, once the clusters of interest are identified, we can get an interpretation of the usages as- sociated with them using two methods. One the one hand, we identify the centroids of the clusters: the example (in our
10
case, the sentence) that is the closest to the centroid is as- sumed to be representative of the context of the tokens inside the cluster. Thus, we observe these central sentences to get a preliminary idea of the word usages in context. On the other hand, we set up a keyword detection method to characterise the different clusters in relation to one another. Relying on the tf-idf (Term Frequency - Inverse Document Frequency) principle, each cluster containing a set of sentences, we con- sider them as documents and the set of clusters as a corpus.
The goal is to identify the most discriminant words for each cluster. The stop-words and the words appearing in more than 50% of the clusters are excluded from the analysis. We com- pute the tf-idf score of each word in each cluster. The words with the highest score in a cluster are the most important for the analysis of this cluster: they are used as keywords to ease its interpretation.
4 Experiments
We apply the word usage variation detection pipeline to two financial corpora across several dimensions in addition to time. For our experiments, we use the English BERT-base- uncased model from the libraryTransformers1 with 12 attention layers, an output layer of size 768 and 110M pa- rameters.
4.1 Data
We use two financial corpora spanning two decades: a cor- pus of annual financial reports (10-K) of U.S. companies ex- tracted from the Securities Exchange Commission database (SEC-Edgar), and a corpus of central bank statements.
The SEC-Edgar filings were extensively studied in the liter- ature. From the diachronic point of view, Purveret al.[2018]
extract subsets of the annual reports of 30 companies from the Dow Jones Industrial Average (DJIA) from 1996 to 2015.
They manually select a set of 12 financial terms and inves- tigate changes in lexical associations, by looking at the evo- lution of the similarity between pairs of two terms. More recently, [Desolaet al., 2019] fined-tune BERT separately on two corpora of SEC-EDGAR filings (from years 1998-1999 and years 2017-2019). For three selected words (cloud,taxes andrates), they compare the embeddings from the two pe- riods using cosine similarity. None of these works are fully unsupervised.
We scrape2the SEC-EDGAR reports3from the 500 biggest companies in the US, between 1998 and today. Similarly to [Purveret al., 2018], we extract the Part I and the Items 7 and 7A from the Part II of the 10-K annual reports. These sections mainly describe the activity of the company and its operations and management. We exclude the year 2019 from the analysis, as many documents of that year are not available yet. We end up with 8676 documents spanning 20 years. It amounts to a total of 7.3 million sentences.
This corpus is very rich for synchronic analysis. Each doc- ument is written by one company, and for each company, we extract additional data: its stock exchange (NYSE, NASDAQ,
1Available at https://huggingface.co/transformers/
2Using https://github.com/alions7000/SEC-EDGAR-text
3Extracted from https://www.sec.gov/edgar.shtml
Time Source
1 households measures
2 labor committee
3 holdings rate
4 securities employment 5 accomodative developments
6 sectors support
7 monetary pressures
8 housing price
9 sales stability
10 loan market
Table 1: Top 10 words with highest variation measure (from section 3.2) for the time dimension and the source dimension on the Central Bank Statements corpus
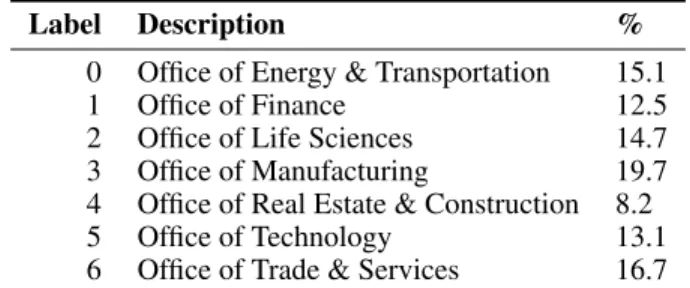
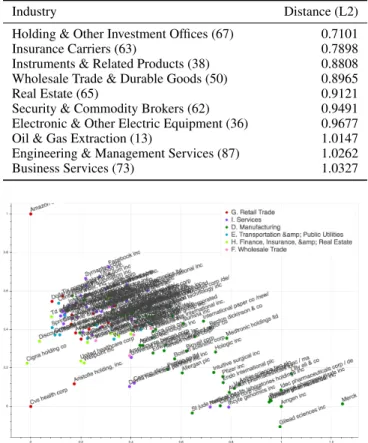
OTC) and its Standard Industrial Classification4(SIC) code.
The latter indicates the business line of the company; the clas- sification is divided into 7 Offices and sub-divided into 444 Industries. Thus, we can detect drifts across several dimen- sions, from the most to the least fine-grained: by company, by Industry, by Office, and by Stock Exchange.
The second corpus assembles all the official statements of two central banks, the European Central Bank (ECB) and the US Federal Reserve Bank (Fed) from June 1998 to June 20195. These statements report the economic situation and expose the policy decisions of the central banks. This corpus was previously studied through sentiment analysis [Buechel et al., 2019]. It is composed of 230 documents from the ECB and 181 from the Fed, and contain a total of 14604 sentences;
it is heavily unbalanced towards the ECB (more than 75% of sentences), as the Fed statements are usually shorter.
Both corpora are divided into 20 yearly time steps. Stop- words are removed and we build the vocabulary with all words having at least 100 occurrences in the corpus.
4.2 Selecting Target Words
For both corpora, we conduct the preliminary step on the full vocabulary.
On the SEC-Edgar corpus, the frequency of some words is very high (for example the wordmillionappears 1.4 million times). To speed up the process, we sample 3000 sentences for each word. We extract the embedding of the target word using BERT. Then, we compute the variation measures from section 3.2 by year, by company, by Industry, by Office, and by Stock Exchange. We do the same in the Central Banks Statements corpus, by year and by source.
As an example, the words with highest variation for the time dimension and the source dimension on the Central Bank Statements corpus are showed in Table 1. For the source di- mension, we keep only the words with a threshold of presence of at least 50 occurrences per source. Words such aslaborare absent from the FED statements because of orthographic di- vergence between UK English and US English.
4Described in https://www.sec.gov/info/edgar/siccodes.htm
5We thank Sven Buechel from Jena University Language & In- formation Engineering (JULIE) Lab for sharing the corpus with us.
Method S-score JSD-synchronic JSD-diachronic
Aff-prop 0.267 0.829 2.519
KMeans3 0.213 0.342 0.523
KMeans5 0.215 0.467 0.856
KMeans7 0.218 0.537 1.088
Table 2: The average values of silhouette score, JSD by source and JSD by year for all the target words
Source: KM2 KM3 KM5 KM7 KM10
0.389 0.484 0.579 0.596 0.630
Time: KM2 KM3 KM5 KM7 KM10
0.325 0.328 0.289 0.282 0.282 Table 3: For both dimensions, the correlation between the JSD from affinity propagation clustering and the JSD from K-Means (KM) with differentk.
For each dimension, we select the 10% words with highest variation measure as target words for the clustering step.
4.3 Comparison of the Clustering Algorithms We apply both K-Means and affinity propagation on the set of token embeddings of each target word. In the case of K- Means, for each word we try different values of the number of clusterskranging in[2 : 10]. To evaluate the quality of a clus- tering, we compute its silhouette score for each target word.
Then, we extract the probability distributions across each di- mension (for example the distribution of each year for the time dimension). We apply the generalised Jensen-Shannon Divergence (JSD) on the set of probability distributions to measure the level of usage variation of the word.
We focus on the Central Bank Statements Corpus to anal- yse the results of the clustering. The average values of sil- houette score, JSD by source and JSD by year for all tar- get words of this corpus for different algorithms are in Table 2. It should be recalled that the silhouette score takes val- ues between 0 and 1, a value close to zero signalling a low clustering quality. Plus, while the JSD between two distribu- tions takes values between 0 and 1, the generalised version to ndimensions is restricted bylog2(n). For example for the temporal dimension in the Central Bank Statements corpus, the 20-years period leads to an upper bound being equal to log2(20)≈4.32.
According to Table 2, the average silhouette score is the highest for the affinity propagation algorithm. Moreover, the average JSD for both dimensions increases with the number of clusters for the algorithm K-Means. The correlation be- tween the number of clusters (k from 2 to 10) and the average JSD at each k, is high and positive (0.962 for the JSD by source and 0.986 for the JSD by year). We also inspect the number of clusters for the affinity propagation algorithm. It ranges from 4 to 450, with an average number of 61 clusters.
However, the correlation between the number of clusters and the JSD is not significant. On the contrary, the correlation between the number of clusters of the affinity propagation al- gorithm and the silhouette score is -0.29: words with very
Label Description %
0 Office of Energy & Transportation 15.1
1 Office of Finance 12.5
2 Office of Life Sciences 14.7 3 Office of Manufacturing 19.7 4 Office of Real Estate & Construction 8.2
5 Office of Technology 13.1
6 Office of Trade & Services 16.7 Table 4: Label and proportion of business line with SIC classifica- tion in the SEC-Edgar corpus
diversified usages are associated with a clustering of lower quality. Finally, one can evaluate the accordance between the affinity propagation and K-Means algorithms by computing the correlation between their respective JSD for all words.
According to Table 3, the correlation between affinity propa- gation JSD and K-Means JSD increases with k for the Source dimension, while it is relatively stable for the Time dimen- sion.
4.4 Interpreting the Clusters
We focus on the SEC-Edgar Corpus for this last step. We present one example for the diachronic dimension and one for the synchronic dimension, in order to show the different possibilities in terms of interpretation.
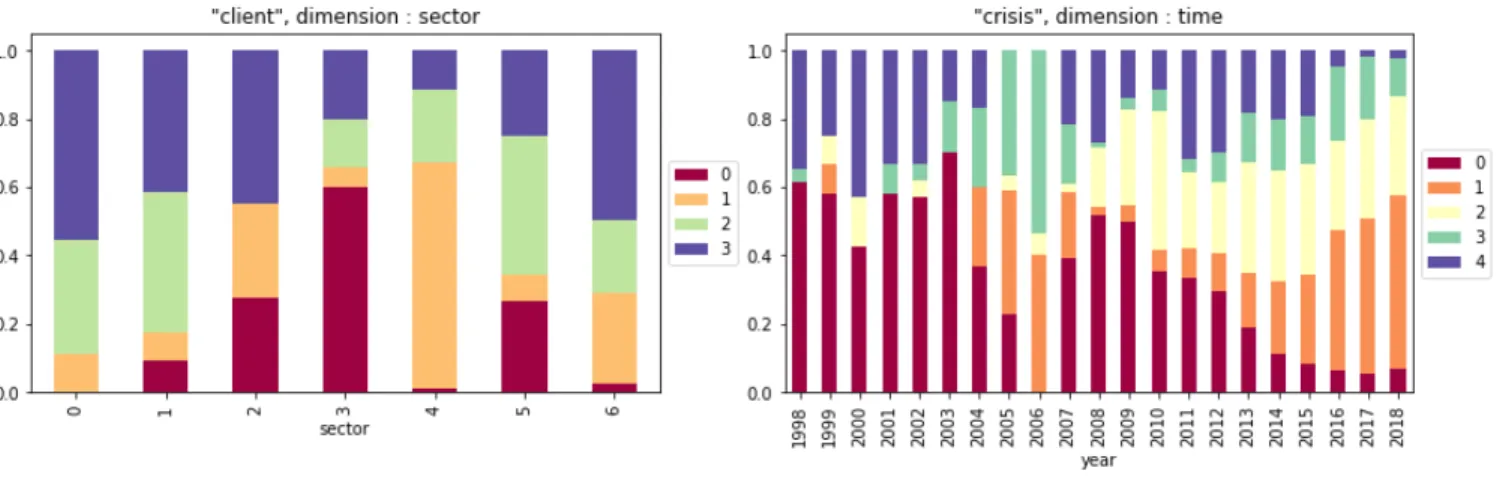
For the synchronic dimension, we study the distribution of usages of the wordclientby Office (business line). It is one of the words with the highest JSD for this dimension. The silhouette score is the highest using K-Means algorithm with k= 4. All the Offices are listed in Table 4; The normalised distributions of clusters for each of them are in the left part of Figure 1. We apply our interpretation pipeline to iden- tify the clusters that have an uneven distribution, and the Of- fices that are involved. Using the keyword extraction method, we select the most representative words for each cluster (Ta- ble 5, left). The cluster 1 is the most unevenly distributed, and appears mostly in documents belonging to the Real Es- tate & Construction Office. The keywords associated with this cluster involve the idea of paying (cost,fees) and nega- tivity (risk, loss). On the contrary, the clusters 2 and 3 are relatively similarly allocated in the different Offices. Their keywords correspond to the classical definition of a client in a company. Finally, the cluster 0 is characterised by vocab- ulary from the semantic field of digital technologies (server, applications...): the clustering algorithm was able to identify this specific meaning of the target word.
For the diachronic dimension, we study the distribution of usages of the wordcrisisby year (Figure 1, right). The high- est silhouette score corresponds to the K-Means algorithm withk = 5. The keywords for these 5 clusters can be found in Table 5 (right side). We can identify clear temporal ten- dencies in the figure. The proportions of the clusters 0 and 4 are decreasing through time, while the clusters 1 and 2 are growing. The extraction of keywords allows to differentiate the 5 usages of the wordcrisis. For example, the cluster 1 is associated with vocabulary of the domain of marketing and media. It is almost non-existent before the year 2004, and
12