Review
How Smart Meter Data Analysis Can Support Understanding the Impact of Occupant Behavior on Building Energy
Performance: A Comprehensive Review
Jacqueline Nicole Adams 1, Zsófia Deme Bélafi 2, Miklós Horváth 2,*, János Balázs Kocsis 3 and Tamás Csoknyai 2
1 Center for Ultra‐Wide‐Area Resilient Electrical Energy Transmission Networks (CURENT), Department of Electrical Engineering and Computer Science, University of Tennessee, Knoxville, TN 37996, USA;
Jadams69@vols.utk.edu
2 Department of Building Services and Process Engineering, Faculty of Mechanical Engineering, Budapest University of Technology and Economics, Műegyetem rkp 3, 1111 Budapest, Hungary;
belafi@egt.bme.hu (Z.D.B.); csoknyai.tamas@gpk.bme.hu (T.C.)
3 Department of Geography, Geoeconomy, and Sustainable Development, Corvinus University Budapest, Fővám tér 8, 1093 Budapest, Hungary; janosbalazs.kocsis@uni‐corvinus.hu
* Correspondence: horvath@epgep.bme.hu
Abstract: The goal of this literature review was to outline the research currently conducted on smart meter (SM) adoption and its connection to building occupant behavior to better understand both SM technology and SM customers. We compiled our findings from the existing literature and developed a holistic understanding of the socio‐demographic factors that lead to more or less energy use, the methods used to group and cluster occupants on the basis of energy use, how occupant energy use profiles are developed, and which socio‐psychological determinants may influence SM adoption. Our results highlight 11 demographic variables that impact building energy use, find 9 methods commonly used to profile occupants on the basis of energy usage, and highlight 13 socio‐psychological variables than can be utilized to better understand SM adoption intentions.
The review findings two major deficiencies in the existing literature. First, this review highlights the lack of existing interdisciplinary research that combines occupant behavior with SM data and a clear socio‐psychological framework. Second, this review underscores certain data limitations in existing SM research, with most research being conducted only on residential or office buildings and geographically in North America or Western Europe. Final policy recommendations center on increased need for interdisciplinary SM research and the need for an expanded understanding of occupant behavior and SM research across different geographies.
Keywords: smart metering; building occupant behavior; socio‐demographics of energy use
1. Introduction 1.1. Energy Metering
As there is an ever‐growing need to improve the energy efficiency of buildings, it is of utmost importance to obtain feedback on energy consumption. With the development of energy metering technology [1], it became possible to perform deeper analysis of energy usage patterns, habits, and peculiarities of buildings. In the early stages of energy metering, mostly analogue devices were installed, which could only be read or registered manually. In most buildings, until recently, only monthly or yearly readings were available, which made it impossible to analyze the energy consumption patterns in detail.
Typically, utility companies read these meters, of which there are electricity, gas, and heat meters, but in some cases also heat cost allocators. In the case of electricity meters, three basic types can be distinguished, namely, flat rate, interval, and smart meters (SMs). Flat
Citation: Adams, J.N.; Bélafi, Z.D.;
Horváth, M.; Kocsis, J.B.; Csoknyai, T. How Smart Meter Data Analysis Can Support Understanding the Impact of Occupant Behavior on Building Energy Performance: A Comprehensive Review.
Energies 2021, 14, 2502.
https://doi.org/10.3390/en14092502
Academic Editor: Jozsef Nyers
Received: 24 March 2021 Accepted: 22 April 2021 Published: 27 April 2021
Publisher’s Note: MDPI stays neutral with regard to jurisdictional claims in published maps and institutional affiliations.
Copyright: © 2021 by the authors.
Licensee MDPI, Basel, Switzerland.
This article is an open access article distributed under the terms and conditions of the Creative Commons Attribution (CC BY) license (http://creativecommons.org/licenses /by/4.0/).
rate meters only measure the consumed electricity, regardless of the time of consumption, while interval meters make it possible to introduce different tariffs for different (peak/off‐
peak) periods.
Through the development of metering and IT technology, it became possible to read meters more frequently and send and save the measured data on a server or central unit.
The more frequent meter reading can be achieved even without installing any additional hardware up to a resolution of 15–30 min, and with additional hardware, the resolution can reach a finer than minute detail. There have been countless research projects aimed at analyzing building consumption habits and trends in the past decades; however, due to limitations of resources and budget, that research only focused on a few selected buildings. With the development and increased use of SM technology, researchers have the opportunity to analyze larger clusters of buildings and derive more general, statistically relevant, conclusions from the measured data.
This research expands on existing SM research in two key areas. First, this paper highlights existing gaps in SM and occupant behavior research, underscoring the need for increased interdisciplinary research and a more holistic understanding of occupants themselves. Second, this research highlights the building type and geographic concentration of existing SM research and emphasizes the need for a more diverse pool of occupants in order to better understand varied, diverse motivations and energy usages as SMs are increasingly deployed globally. In order to pinpoint these deficiencies, we utilized research from key areas of SM adoption and implementation, namely, background research on existing technology, current barriers and limitations, demographic indicators of energy use, occupant behavior research, and socio‐
demographic factors related to energy efficient technology adoption. This paper marries together key fields of SM research to develop a more holistic understanding of occupants and their energy use and offer a mechanism for researchers and policymakers to implement more interdisciplinary methods to promote widespread SM deployment.
1.2. Smart Meter Technology
SMs are electronic devices that record occupant energy consumption and share this information with utilities, allowing two‐way communication between consumers and energy providers [2]. SMs measure electricity, heat, and gas consumption, with the former being the most common type, and less research focused on the latter two [2]. Three key SM benefits have been outlined in the literature [2–5]:
1. Providing more accurate and accessible energy consumption data, allowing customers to better understand their energy use and make appropriate adjustments.
This includes the non‐intrusive load monitoring as well, where only a single meter’s data is needed to analyze the appliances’ consumption patterns.
2. Utilities or other providers can better tailor programs and refine their services according to this consumption data, and, with a better understanding of consumption patterns, can secure the energy supply, reduce costs, ensure electric grids remain stable, or even identify affected areas during emergency situations such as blackouts [4].
3. Finally, SM allows energy to be produced and consumed in an efficient manner, thereby helping the planet limit greenhouse gas (GHG) emissions to combat climate change. More advanced SMs can even control household appliances and help customers better regulate their energy consumption on the basis of times of lesser demand or on the basis of when electricity prices are cheapest, an idea known as demand response (DR) [4].
Given the potential of SM and these benefits, there has been an uptake in SM technology. At the end of 2016, there were 700 million SMs installed globally, with over half of those in China [6]. Aside from China, Europe leads in SM implementation; a European Union directive set an ambitious goal of 80% customer penetration by 2020 [7].
One particular study compiled a database of smart grid projects from 2002 to 2017, finding that a total of 950 projects have been launched in the European Union or within EU member states, spanning 50 countries with investments of nearly EUR 5 billion [8]. As of 2019, there were 94.8 million SMs installed in the United States [9], and notably Consolidated Edison, a utility company that serves New York City, has invested USD 1.4 billion in the technology [10]. Additionally, one notable review mentions the growing importance of installing SMs in developing countries to improve overall efficiency of energy distribution [4]; these developments will be crucial in preventing energy theft, which has a severe monetary impact on utility companies and impacts overall system security [11]. Overall, these numbers paint a broad picture of the continued global increase in SM technology use and implementation.
1.3. Why Are SMs Not as Effective as Originally Intended?
Given the large global uptake in SMs, one would expect widespread success with the technology. However, there are many factors that inhibit the technology from performing at peak efficiency. In one project, EnSURE [12,13], which highlights the need for interdisciplinary approaches and increased stakeholder and public engagement in energy efficiency planning, researchers found that when customers had a negative experience with certain technologies, utilization was reduced. For example, energy providers may add fees or change pricing policies once customers reduce their consumption in order to maintain profit, which leads to negative customer experiences. From a regulatory standpoint, there must be better management on such providers so that customers are not gouged with fees once they reduce their energy use. On the opposite side, many distributers or retailers face issues with associated SM costs, and how those costs can be equitably distributed among those stakeholders [14]. To address this concern, researchers have used dynamic modeling methods to better understand coordination among stakeholders and identify ways to recover costs among actors [14]. Researchers find that not only are costs and benefits for each stakeholder key, but also better understanding behaviors among the varied actors involved in the process [14]. However, this process proves complicated, and the intricacies of coordination among actors and intricate cost recovery necessary may explain some hesitancy in widespread SM deployment [14].
Further, some issues are related to the technology itself; one study lost nearly 15% of the SM data they sought to collect due to transmission problems [15]. It is also likely that some SMs are installed but proper maintenance or checkups are not performed, and thus the technology is vastly under‐utilized. SM technology also raises important negative issues that hinders its acceptance and necessitates further developments. SM grids can be hacked into, changing energy usage resulting in false pricing and data about energy consumption. By rendering usage patterns accessible, various privacy and security issues arise for households and occupants [16,17]. These risks will be discussed in greater detail in a later section of this article. In addition, standardization of smart grid technologies is crucial to ensure widespread implementation. One review found 17 varied communication standards across SMs in Europe alone [18]. One way to circumvent this issue is to have users serve as developers of sorts, which has proven successful in research [19]. Cooperation between users and firms, as well as technological support from firms is crucial to ensure success [19]. Under these research conditions, technological strategies can standardize and change over time, which leads to more collaboration and coalition forming across stakeholders [19]. In short, increased communication and collaboration among all SM stakeholders can help facilitate more widespread implementation, but standardization still serves as a crucial barrier to address as SM uptake increases.
Aside from the economic, data, privacy, and standardization concerns, many other SM concerns arise from a consumer standpoint. For example, SMs are not as effective as originally intended, as the monetary savings promised by the technology are generally small [20]. There are several explanations for this, one being that simply showing participants’ consumption information will not change behavior, but more targeted
feedback and assistance could mitigate this issue [12,13]. That is, information more individually tailored to customers and building occupants that also considers customer attitudes towards and concerns with the technology could prove beneficial [21]. Further, older versions of SM technology only showed total energy consumption and provided no information on when the energy was specifically consumed in each building [22];
however, improved feedback in the form of in‐home displays has been shown to reduce demand from the residential side by making it easier for occupants to track their consumption [23]. Additionally, customers may have different motivation levels, energy use levels, and varied energy‐saving habits [24]. The general public has mixed reviews on SMs, from positive opinions and dispositions to public opposition [25,26]; regardless of opinion, there is generally a disconnect between the user and the technology. In this disconnect, and the issues outlined above, we find the need for researchers to better understand the user, thereby incorporating occupant attitudes and behavior in the realm of SM technology.
1.4. Privacy Concerns
Privacy concerns are part of a large debate in the field of SMs. As technology that monitors users’ habits and behaviors becomes more prevalent, more concerns with privacy will arise. In the socio‐psychological section, we briefly mentioned some concerns with privacy, strictly from the psychological perspective of intention to adopt SM. Below, we outline some concrete user concerns as well as some legal issues related to SM.
Privacy concerns associated with SM can have a negative influence on a customer’s intention to adopt SM technology [27]. Since many other researchers have outlined these factors, this section will be brief, but privacy’s impact on SM should not be understated.
For a more in‐depth explanation of the privacy concerns outlined in this section, see Yildiz [28]. Overall, Yildiz outlines several concerns with the uptake of SM technology:
companies seeking to obtain more information about customers to better target ads; SM data being sold to third parties for targeted ads or similar purposes; or that SM data could be used to detect illegal activity, and if the government or law enforcement uses this information then freedoms and privacy could be restricted [28]. Lisovich, Mulligan, and Wicker outline concerns about directed advertisements, stating that research suggests advanced metering infrastructure could see specific brands customers are using, determine when they are malfunctioning, and target ads for repairs [29]. The authors also suggest concerns that criminals can see usage and determine which homes have more expensive appliances and target those residences, as well as monitor usage to see when occupants are not home; further, law enforcement could surveil homes and infringe on privacy rights [29]. The researchers created an algorithm to highlight the feasibility of homes being monitored in real time [29]. One additional privacy concern is the idea that family members could surveil each other, limiting privacy inside homes (i.e., parents could monitor kids when they are away, or family members could monitor each other when they are not at home) [30]. To address the growing concerns with privacy, two researchers have created algorithms to prevent occupant behavior detection and privacy violations with increased SM technology uptake [31,32]. However, it is worth noting that privacy concerns with SM technology in public buildings are small, if present at all;
however, this is an area less studied than private buildings.
As SM technology advances, users may feel like they have less privacy in their homes. It is important that localities across all levels of government take legal steps to ensure the privacy of individuals remains protected. In his review, Yildiz outlines some legal concerns associated with SM technology: he asserts that access to SM data could be a violation of the Human Right to Privacy, as outlined in the European Union Convention on Human Rights [28,33]. Yildiz cites this law in his review, stating that in the Netherlands a mandatory SM rollout was switched to a voluntary program under this aforementioned privacy right [28]. Lisovich, Mulligan, and Wicker [29] also mention many U.S. privacy laws and Supreme Court cases. Two notable cases in the United States that the
aforementioned authors address are United States v. Miller, which states that individuals have no reasonable expectation of privacy in data voluntarily given to and held by third parties [34], and Kyllo v. United States, which ruled that heat imaging cannot be used to detect energy use [35]. Lisovich, Mulligan, and Wicker [29] also mention arrangements between American utility companies: the Austin, TX, police department has an agreement with Austin Energy to see power usage without a search warrant [36], while alternatively, the California Public Utility Code (Section 394.1) requires written consent before investor‐
owned utilities can release customer’s personal data [37]. Finally, and importantly, the European Union General Data Protection Regulations ensure that citizens have the right to their information regarding personal data, can request that irrelevant or outdated data be erased or removed from certain platforms, object to data being used for marketing, and can request that processing of certain data be restricted and done by a neutral person as opposed to a computer—these are just a few of the guaranteed protections [38]. These restrictions on data usage ensure privacy and control for SM users in Europe, and other countries should look towards ensuring the confidentiality of personal data as SM use increases. However, on the opposite side, these restrictions make it more difficult for researchers to obtain data, only making the research process longer and more tedious. It is important to consider that as SM use continues to grow, more privacy concerns will arise, and citizens, lawmakers, and utilities should all be aware of potential breaches of customers’ privacy. While some of the above‐mentioned privacy laws are important, they are only a starting point. Moving forward, steps should be taken to ensure that customers’
personal data remains protected.
Now that the associated risks and barriers with SMs have been addressed, we move onto the key components of this paper and the importance of better understanding the human components of energy use withing buildings.
1.5. The Importance of Studying Occupant Behavior
The need to mitigate energy use in buildings is more pressing now than ever before, as practical solutions are necessary to minimize the effects of climate change. Building energy use accounts for nearly one‐third of total energy consumption in the USA in 2019 [39], and thus exploring opportunities to more efficiently use this energy is a fruitful area of research. This opportunity is even more pressing as emissions from buildings have increased over the past years, highlighting that the efficiency potential of buildings is largely overlooked [40]. Project report of IEA‐EBC Annex 53 states that energy use in buildings is influenced by six key elements: climate, building envelope, building equipment, operation and maintenance, environmental conditions indoors, and occupant behavior [41].
Occupant behavior (OB) is an emerging, previously overlooked component of building energy performance [41–43]. Hong et al. [44] emphasizes the oversimplification of occupant behavior in buildings, and that prior research does not consider the steps people take to be more comfortable in their indoor environment, as occupants, not buildings, are the main consumers of energy [45]. Importantly, behaviors can vary greatly from building to building, and this is especially true in a residential context, as occupancy hours, lifestyles, family composition, and activities vary across each residence [46]. This disconnect between occupant behavior and building performance, perpetuated by the consistent disregard for complex OB in buildings, leads to a large gap between modeled and actual building energy consumption [43,44,46,47]. For further information, Yan et al.
provides a thorough literature review on the variability occupant behavior adds to building energy use, as well as the general complexities that come with predicting how humans interact with buildings [48]. Of course, building technology is important, but there must be a focus on socio‐psychological factors and behavioral influences; this means OB requires interdisciplinary methods of research [41,44,49]. If researchers better understand occupants’ attitudes, motivations, and behavioral influences, they can better predict energy use behaviors, and in turn aid understanding between modeled and actual
building energy use. Importantly, an improved framework can help researchers determine how to better mitigate energy use overall. It is also worth noting that 75% of OB studies focus on residential and office buildings [43], and therefore the scope of OB research could be extended to buildings outside these contexts. With this paper, we reviewed scientific research works on building energy performance measured by SMs, the impact of occupant behavior, and the corresponding influencing factors such as socio‐
psychological issues and privacy constraints.
1.6. Aim and Structure of the Current Review
This paper serves as a review of currently available scientific studies on building occupant demographics and energy profiles, the methods used to categorize such data, and how the psychological variables such as attitudes and behaviors of consumers can better inform SM data‐related research. The goal of the paper is to highlight how SM data analysis can support the understanding of OB in buildings to create a better holistic understanding of building energy use. The remainder of the paper continues as follows:
Section 2 outlines the methods used to collect papers for this review; Section 3 discusses household characteristics and demographic categorizations of occupants and their relationship to energy use; Section 4 discusses occupant profiling methods and results;
Section 5 discusses the largely understudied area of socio‐psychological influence on SM technology adoption; and, finally, the paper concludes with a discussion and recommendations for future research. Sections 3–5 largely build upon each other, with results from Section 5 informing Section 4, and Section 4 informing Section 5.
2. Literature Review Methodology
A simple Google Scholar search of the term “smart meter” produces 640,000 article results, and for “occupant behavior”, the query leads to 129,000 options. Of course, a methodical way of finding the articles most relevant to this paper was of the utmost importance. As Higgins and Green outline, there are 5 key elements to a systematic review, each of which we sought to incorporate into this paper: a predetermined set of criteria for each study to be included, a clear and straightforward methodology for literature collection, a systematic search to identify all relevant studies, assessment of the validity of each study’s findings, and a clear explanation and presentation of our results and findings [50]. We adapted these criteria from Staddon et al., who utilized the Higgins and Green Cochrane Handbook [51].
The research in this review had to meet certain criteria. We sought empirical, peer‐
reviewed studies that would help us link the fields of SM data analysis and occupant behavior. We began broadly, searching for papers related to the overarching themes of the paper: SM technology implementation, SM data analysis, demographics and energy use, building occupant behavior, socio‐psychological factors related to SM adoption, and SM privacy concerns. Articles from the past 10 years were considered (with the exception of articles outlining or developing a specific theory, which could be older). All studies had to be in English or previously translated into English. Studies could be conducted in any country, and each study had to be from a peer‐reviewed journal or a report from an organization, government, or some other sector (i.e., gray literature).
Each article was systematically selected for this review. We utilized multiple online sources and search engines: Google Scholar, PsycINFO, Web of Science, and Academic Search Complete. Most reports or conference papers were found through Google Scholar.
As previously mentioned, we started with main topics: SM technology implementation, SM data analysis, demographics and energy use, building occupant behavior, SM clustering, energy profiling, and socio‐psychological factors related to SM adoption. The main search terms used were “smart meter adoption”, “smart meter consumers”, “smart meter analysis”, “occupant behavior buildings”, “demographics and energy use”,
“energy behaviors smart meters”, and “occupant profiling smart meters”, to name a few.
These search terms of course varied as we found more literature in each field. We examined the citations of each article to determine any similarly related literature. We further looked through all articles that had cited each article we found in order to ensure we systematically read the newest and most relevant literature. We determined the validity of each article through our initial criteria by ensuring our literature was peer‐
reviewed and published in reputable journals, and that reports did not have any inherent bias or any ulterior motivations (i.e., checking that reports were not funded by third parties with monetary interests).
Once we obtained the articles of interest for each section of this paper, we organized the results by topic, and then grouped the relevant results. Supplementary Table S1 provides an overview of the content we pulled from each paper. For peer‐reviewed articles related to demographic characteristics, we tallied the major findings to determine 11 occupancy‐ and household‐related variables that influence energy use, both individually and in combination with one another: dwelling type, size of house, home ownership, number of occupants, household composition, age of occupants, location, income, employment status, appliance types, and recent energy retrofits. Among the energy profiling articles, we grouped and tallied the peer reviewed results on the basis of clustering method: linear/logistic/probit regression, factor analysis, cross‐domain feature selection and coding, feature extraction and classification, distribution model‐based clustering, fuzzy c‐means clustering, self‐organizing maps, k‐means clustering, and hierarchical clustering. Among the socio‐psychological factors, we determined 13 determinants that work individually and in conjunction with one another to influence SM adoption: attitudes, social norms, perceived behavioral control, perceived usefulness, perceived ease of use, personal norms, values, environmental worldview, awareness of consequences, knowledge, perceived cost, trust in technology providers, and perceived risk to privacy. Finally, we grouped each article on the basis of the overall location of data collection: North America, Asia, Western Europe, and Central/Eastern Europe.
Each article specifically relates to findings from SM data and are sometimes supplemented by self‐reported survey responses. Given that the SM field is emerging, we recognize the niche nature of our review, and thus tried to compile a list of as many factors that might impact SM use as possible, given the limited available research. With this methodology, we created a systematic means of determining demographic factors that impact energy use, common clustering methods utilized to group and profile occupants, socio‐psychological factors that might promote or diminish SM use, and common locations wherein this type of research is concentrated.
3. Demographics of Occupants, Household Characteristics, and Their Relationship to Energy Use
3.1. Socio‐Demographics and Energy Use
The idea that socio‐demographic characteristics can influence energy use is prevalent and well‐studied in the literature. Jones, Fuertes, and Lomas have a comprehensive review of demographic, dwelling, and appliance factors that influence residential energy consumption (see [52]). As this field is already heavily researched, we sought to analyze energy use from a more focused area by only examining research and data collected from smart metered buildings. This allowed us to narrow our search, ensured we examined the most recent studies, and helped us develop a better framework of how smart metered buildings are consuming energy. To the best of our knowledge, no other study has compiled recent socio‐demographic information reinforced with SM data in this particular way.
Researchers in the reviewed papers supplement their SM readings with survey data to gather information in three areas: demographics, dwelling characteristics, and appliance information. The following paragraphs discuss some relevant key variables and how they impact energy use among SM datasets. The interrelated nature of these
categories are also discussed. Note that in most of these studies, the researchers looked at total electricity consumption, but as Huebner et al. point out, focusing on different types of energy consumption (such as gas, oil, or heating and cooling) will result in different indicator variables and different results [53]. Further analysis of electricity use per square meter and per person is also not prevalent. For a more synthesized explanation of our results, see Table 1 below. The energy‐related results of the studies presented in the table are based on SM data, thus also providing an overview of the perspectives of SM‐based research. In addition, Supplementary Table S1 highlights how these variables fit into the larger framework of this review.
Table 1. Demographics, dwelling characteristics, and appliance information indicators of energy consumption.
Variable Result
Dwelling type
Detached houses consume the most and apartments use the least total electricity (−11%) [54].
Apartments were associated with using less total annual electricity than detached dwellings [54].
Apartments’ daily maximum electricity consumption is the lowest [55].
Size of house
Smaller dwellings (in square meters, floor area) use less total annual electricity and larger ones use more [53–56].
Daily minimum electricity consumption is highly correlated with house size during the winter (explains 21% of the variability) [55].
Two‐bedroom apartments are likely to have a late evening peak in electricity consumption [57].
5+ bedroom apartments are heavy users of electricity across a 24‐h period [57].
Home ownership
Renter vs. owner status is a good predictor of energy consumption [15].
One study found no significant difference between renter/owner status [55].
Energy saving after installing SMs most relevant for renters [22].
# of occupants
The more occupants, the higher annual electricity use per floor area [15].
Number of occupants is a significant predictor of maximum daily electricity consumption (explains 8% of the variability) [55].
Household composition
Households with children use more total annual electricity than households only composed of adults [58].
One‐person households are likely to have a late evening peak in electricity consumption [57].
Age of occupants
Generally, those between 19 and 35 and over 55 use the least electricity [55].
The household age category between 45 and 64 meant higher annual total electricity use [53].
Head of household (HoH) age < 36 years is likely to have a late evening peak in electricity consumption [57].
HoH age > 56 years is likely to have a morning and a midday peak in electricity consumption [57].
HoH 65+ associated with high peak at noon and low peak in the evening [59].
Location
Inconclusive; location can be influenced by several variables.
Dwellings in urban areas compared to rural areas have different yearly electricity consumption profile shapes [60].
Income
Highest income category was associated with higher annual total electricity use [53].
Found no relationship between income and electricity consumption [55].
Households that use the least electricity are the least satisfied and probably suffer from fuel poverty [61].
Employment status
Those who are retired and work from home use more electricity and have different daily [62] and also seasonal electricity consumption profiles and needs [63].
Farmers are likely to be heavy users of electricity across a 24 h period [57].
Appliance types
Dwellings with more energy‐intensive appliances (tumble dryers and dishwashers) are likely heavy users of electricity across a 24‐h period [57].
Number of refrigerators significantly affect the daily minimum electricity consumption (explains 7%
of the variability) [55].
The hours of TV watched has a direct effect on seasonal electricity profiles [63].
Recent energy retrofits Households with energy efficiency appliances use more energy due to a “rebound effect” [55,64].
A recent energy retrofit has a direct effect on seasonal electricity profiles [63].
Dwelling type: Generally, in studies that examine total domestic electricity consumption, apartments are found to have the least when compared with other building types [54,55]. This could be a result of different building characteristics, (e.g., external surface—floor area ratio in apartments is generally lower than in case of free‐standing buildings), but also the fact that apartments are generally a smaller dwelling type with less total areas to condition, smaller space for appliances, and fewer occupants [54].
Further, apartments could even be heated and cooled from surrounding units through common walls. In this factor, we see examples of the interconnected nature of dwelling characteristics, as factors such as dwelling type and size are interrelated and can influence total electricity consumption. Another paper only found a relationship between dwelling type and total household heating in the winter, finding that apartments had the lowest daily heating consumption and free‐standing homes had the highest [55], which suggests that energy‐related building characteristics are more prevalent in some cases than others.
Size of house: Size of house could be determined in the overall floor area, but many studies use the number of bedrooms as a proxy to measure house size. Research shows that smaller dwellings (in square meters) use less total annual electricity, and conversely, larger dwellings (in square meters) use more [53,55,56]. This same fact is true in studies that use the number of bedrooms as a proxy for size: McLoughlin found that five‐bedroom apartments are heavy users of electricity across a 24‐h period [57]. In the Kavousian study, house size had more of an effect on daily maximum electricity consumption in regard to cooling during the summer [55]. Further, house size is usually correlated with wealth, socio‐economic status, and number of occupants and appliances [55].
Home ownership: Some research shows that renters versus owner status is a good predictor of electricity use [15]. Another study found no relationship between ownership status and total household electricity use [55]. Interestingly, one study found that those who rent their dwellings find it more relevant to save energy, and thus are more susceptible to using SMs and saving energy with their use [22].
Number of occupants: This factor is rather self‐explanatory, as generally more occupants suggest higher electricity consumption. Huebner et al. found that as the number of people in a household increases, so does the total electricity consumption [53];
relatedly, as the number of occupants in a dwelling increases, so does the annual electricity consumption per floor area [15]. One study suggests that the number of occupants is also a significant predictor of maximum daily electricity consumption, explaining 8% of variability [55].
Household composition: Research shows that households with children use more total annual electricity than those only composed of adults [58] and that children change the seasonal consumption pattern of households [57]. This variable is also particularly interesting to energy consultants, as one study, which supplemented SM data collection with interviews, found that retirees and double‐income households without children are more interested in adapting their consumption patterns [56].
Occupant(s) age: Studies that analyzed age as a factor of energy use looked at the age of the head of household (HoH) when examining a household with more than one occupant. Generally, those between 19 and 35 and over 55 use the least amount of electricity [55]. If the HoH was between 45 and 64, they had higher annual total energy use [53]. One explanation for middle‐aged household groups using the most total electricity might be partly due to this age group having more children living at home, and thus more occupants [54]. It is also worth mentioning that age can impact the time of day electricity is used in a dwelling: older household members have an electricity peak in the morning and midday, and those less than 36 years old have a late evening peak [57,59].
Location: The research on how location influences energy use is largely inconclusive.
Kavousian, Rajagopal, and Fischer point out that location is correlated with other variables such as climate, building type, building edifices and materials, socio‐economic status, and a multitude of other factors [55]. For this reason, energy behaviors will differ greatly across countries and regions due to these myriad variables. One study did find that dwellings in urban versus rural areas have different yearly electricity consumption and profile shapes [60].
Income: In some studies, social class was used as a proxy for income, and a scale was developed according to the type of job or profession the head of household had [54,57].
Researchers found that the higher the social class (based on profession) of the HoH, the greater the total electricity use in a household [54,57]. In another study, the highest income
category was associated with a higher annual total electricity use [53]. One explanation for this phenomenon could be that wealthier heads of household generally live in larger dwellings with more appliances, thereby suggesting a relationship between income and energy use [54]. One study also mentions that customers who used the lowest total amount of electricity were the least thermally satisfied, meaning these customers were experiencing fuel poverty; residents were spending too much of their income on heating or cooling, while also being unable to maintain optimal comfort due to the high cost of electricity [61]. The same study found that households with the highest total electricity consumption had, on average, the highest monthly income [61]. Many lower income households are susceptible to the effects of fuel poverty, but as Darby points out, SMs can help energy consumers obtain affordable comfort through better energy management, automated consideration of tariffs, and increased connection between user and supplier [61]. While fuel poverty is out of the scope of this paper, it will be an important obstacle for researchers, policy makers, and providers to address with increased SM implementation.
It is also important to note here that the factor of income is much more complicated than the simple amount of money that a household has or that the HoH earns. Socio‐
economic status is more all‐encompassing, as it often accounts for the interaction between income, employment, and education, among other factors. Essentially, households with similar income status may vary in attainment levels, access to education, upward mobility, and a whole host of factors, each of which influences how “well‐off” a household may be.
With this in mind, we recognize, again, how interconnected each socio‐demographic factor is, as well as how difficult it may be to separate how each factor influences energy use on its own. In fact, research has found that a focus on social and behavioral patterns may have higher predicting power than income alone [65], again suggesting that socio‐demographics should be combined for better prediction of energy use.
Employment status: Those who regularly work from home and those who are retired are more likely to be in a higher total residential electricity use group and use more energy during times of high wholesale price [62,63]. The unemployed, retired, and those who work from home also have different daily and seasonal electricity consumption profiles, further alluding to the impact employment has on energy use habits [62,63]. Finally, McLoughlin points out that farmers tend to be heavy users of electricity across a 24‐h period, as farms require a lot of energy expenditure for upkeep [57].
Appliance types present: Generally, homes that have more energy‐intensive appliances such as tumble dryers, dishwashers, or electric water heaters use more energy [57]. Research shows a relationship between appliances and energy use, and households that owned more appliances such as computers, desktops, refrigerators, freezers, microwaves, washing machines, and televisions used more total electricity across a 24‐h period [53,55,56,58]. In addition, households with wet appliances have differing load profiles [59]. Interestingly, the number of refrigerators significantly affects the daily minimum electricity consumption, explaining 7% of the variability [55]. The hours of TV watched has a direct effect on seasonal electricity profiles [63]. Increased appliance ownership is also associated with wealth, as households with more money will own more appliances [54]. This further reiterates the interconnected nature of socio‐demographics.
Recent energy retrofits: Along the same vein of appliance types, buildings that recently had energy retrofits or installed local renewable energy generation (typically photovoltaic panels) generally used more electricity during times of high wholesale prices and generally used more total residential electricity [63]. The same study also found that retrofits had a direct effect on seasonal variations in energy use [63]. An additional study found that appliances such as programmable thermostats and insulations were correlated with increased energy use [55]. One explanation for these behaviors is a so‐called
“rebound effect” [64], meaning that consumers think they can use more energy because they have taken steps to install more efficient appliances or retrofits in their home [55], or in consequence of their efforts to use renewable energy they are freer to use more. This
could also be related to income, and wealthier houses may be able to afford more retrofits and also use more electricity due to their wealth.
It is worth noting that some studies examine this relationship in reverse and seek to determine socio‐demographic characteristics from energy consumption data and patterns [53,56]. Studies found that the following areas could be inferred from electricity consumption data:
1. Occupancy in the house (employment status of inhabitants, and if the dwelling was occupied or unoccupied) [56].
2. Number of persons in the house (single‐occupant or family and number of residents) [56].
3. Number of appliances [53].
This relationship becomes more important as we examine the role of occupant profiling in SM data collection in the upcoming section.
3.2. Connection to Occupant Behavior Research
As outlined in the paragraphs above, many of the socio‐demographic and household‐related factors are interrelated, and thus the goal of developing clearly defined groups with specific energy consumption characteristics becomes difficult. However, we can see that, overall, certain characteristics serve as indicators for more or less energy use.
By collecting demographic and household data, researchers can better understand energy users and develop frameworks for energy use based on these data. With a better understanding of energy users, researchers and utility companies can better tailor efficiency programs and technology to target customers who use more energy. By having a clearer picture on these parameters, researchers are able to determine behavioral patterns, and thus better understand energy use profiles. The above‐mentioned variables (dwelling size and type, home ownership, household size, age, location, income, employment status) coupled with building energy‐related occupant behavior types (occupancy, window and shading opening, thermostat, and lighting and appliance use) represents a potential indirect impact on building energy use. This connection highlights the importance of interactions between two topics generally left uncombined in the literature as such behavior types have a vast effect on the energy consumption of buildings [66].
However, human behavior is complicated, and thus our socio‐demographic characteristics will not serve as a strict guidebook for determining consumer energy behavior alone. Therefore, other methods (such as occupant profiling through clustering, which will be mentioned next) and other disciplines (such as socio‐psychological models and characteristics, which will be mentioned later in the paper) are important to consider as this field of research continues to grow. The importance of varied methodology when merging the fields of OB and SM technology cannot be overstated.
The subsequent section builds upon our understanding of socio‐demographic characteristics, energy profiling methods, and clustering results build upon researchers’
understanding of demographic factors that influence energy use. Profiling and clustering assist researchers in grouping occupants and better understanding their usage patterns and needs.
4. Occupant Energy Profiling Methods and Results 4.1. Occupant Energy Profiling
In case of vast data analysis, finding correlations and connections plays a significant role, and thus different algorithms have been developed to identify the connections making the further analysis easier [67]. In the context of occupant profiling, it is important to remember that energy consumers are not all the same, and they can be grouped together on the basis of certain similarities in their energy use and behavior [68]. Given the massive uptake in SM technology, as previously discussed, methods for analyzing
such data are essential, and there is an increased need to profile occupants and better ascertain their energy‐related behaviors.
There are several benefits to customer segmentation, such as (1) utility companies can tailor tariffs or other pricing models that better reflect the consumption of specific groups, and (2) utilities and other providers can better create personalized services to customers if they better understand their consumption [69]. There are many ways in which researchers seek to categorize such large amounts of data; this can be through regression modeling or clustering, which is explained below. However, it is worth noting that most studies focus on total electricity use, and there is a lack of research on SM heat and gas data. For an overview of how profiling fits into the larger framework of this review, see Supplementary Table S1.
4.2. Clustering
One of the most common methods to group occupants by similar energy use patterns and better understand is a data mining technique known as clustering [70–72]. This section highlights several clustering methodologies utilized to better analyze SM data and group customers. For visual results from this section, please see Supplementary Table S1.
The text below provides descriptions of the numerous clustering methods we found within the literature.
Essentially, the goal of clustering is to group items in a way that they have the greatest similarity with the items in the same group and the largest dissimilarity between the other groups [69]. SM data are very suitable for clustering, and it is often the method utilized to analyze such data [68–72]. Clustering can be based on several methods [73]
(Figure 1), from which k‐means and hierarchical clustering are the two of the more common, well‐known types [68,73]. Yildiz et al. published a comprehensive study on the recent advances in the residential SM data analysis, which includes several clustering types [28]. Fan et al. focused on unsupervised data analytics for mining building operational data utilizing different clustering approaches [74].
Hierarchical clustering was used by Gouveia and Seixas, who created 10 different clusters for the yearly electricity consumption profile [60]. Rhodes et al. used hierarchical clustering as well for creating two separate clusters for each season for daily energy patterns [63].
k‐means clustering was used by Viegas et al., who created four clusters for each season [69]. Benítez et al. used k‐means clustering for different time intervals (hourly–daily) and types (working day–not working day), wherein each group contained 10 clusters [70]. Yu et al. created four clusters using k‐means clustering, while taking into account not just the total but the different electricity end‐uses as well [75]. Al‐Wakeel and Wu tested the accuracy of the k‐means clustering method with different border conditions [76].
A distribution‐based model utilizing the Gaussian distribution in finite mixture model was used for clustering by Haben et al. [71]. Zakovorotnyi and Seerig used self‐
organizing maps (SOM) to identify behavioral patterns from SM data [77].
In some cases, different clustering methods were tested. McLaughlin, Duffy, and Conlon tested three clustering methods: k‐means, k‐medoid, and SOM, from which SOM showed the best suitability [57]. Azaza et al. used hierarchical and SOM clustering [78].
Panapakidis et al. used several different clustering approaches, including k‐means, fuzzy c‐means (FCM), and SOM, finding that the best results came from utilizing combined SOM/k‐means algorithms [79].
These results highlight the numerous ways in which clustering is utilized to study SM data. Further, these results show that k‐means and hierarchical methods were most commonly used within the literature and were the most common methods used to cluster SM usage data.
Figure 1. Common clustering methods.
4.3. Energy Profiles
This section blends the demographic factors discussed previously with clustering methods to highlight how the previous two sections build upon each other to create a better, more holistic picture of occupant energy use vis‐à‐vis SM data. With socio‐
demographic data trends and clustering methodologies, researchers can then move to developing energy profiles of occupants. When researchers create energy profiles, they are typically based on temporal readings such as hourly, daily, weekly, monthly, or seasonal energy use patterns. Sometimes researchers looked at calendar data such as the day of week (weekday versus weekend) or holiday versus regular day use. Occasionally, weather or location were also considered. It is important to note that the socio‐
demographics, mentioned earlier, impact both the amount and time of day energy is consumed. This energy use data collected via SM, is then used to create various clusters on the basis of these hourly, daily, monthly, or seasonal use patterns.
McLoughlin, Duffy, and Conlon, after conducting a cluster analysis, combined consumers into 10 different groups on the basis of the intensity and temporal pattern of their energy use [57]. Most of the energy use profiles followed a specific daily pattern:
generally, there is a primary peak early in the day, and then later in the afternoon or evening there is a secondary peak that lessens in intensity; however, the intensity and timing of this pattern varied among groups. The researchers found diurnal, intra‐daily, and seasonal patterns of use during their analysis [57]. They found that households in higher electricity use clusters had middle‐aged or older HoHs, households with more energy‐intensive appliances, and households with five or more bedrooms [57]. Those clustered in smaller energy use groups tended to live in apartments, live in homes with fewer bedrooms, were households with older HoHs, were those who lived alone, and were those with fewer appliances [57].
Benítez et al. looked at daily energy use and created 10 corresponding clusters [70].
This research focused on when the specific peaks in use occurred during the day and how many there were [70]. The most common cluster, representing the majority of the households in the study, had three peaks in a day (morning, lunch, and evenings) with low‐to‐moderate energy use total [70]. Haben, Singleton, and Grindrod conducted similar research, determining 10 energy groups via clustering as a means of identifying when demand could be reduced [71]. The researchers grouped clusters on the basis of temporal and calendar data, and they found that demand in different time periods changed as a function of season and day of week [71]. Additionally, some researchers were able to characterize energy use with specific shapes on the basis of seasonal use. One study found nine clusters on the basis of the amount of energy used and the pattern shape; the two extremes were (1) a “soft U shape”, characterized by low energy use with a peak in the winter, and (2) a “W profile”, which was characterized by high levels of energy use in the winter and summer [60]. Generally, households use more energy in the summer and winter, and less in fall and spring, according to Benítez et al. [70]; however, Viegas et al.
found that the peak loads were in the winter and fall [69].
Importantly, research suggests that socio‐demographics can, in fact, influence temporal patterns of energy use. Researchers found that factors such as employment status and internet usage had a significant effect on energy behavior; both factors influence people’s lifestyles, such as when they work or have leisure time [62]. Further, younger people generally use the internet more regularly and later at night, highlighting that age and household composition will impact which energy use cluster households may be placed into [62]. Additionally, those who are unemployed generally stay at home and use more energy throughout the day, resulting in fewer peaks and valleys that result from employed households leaving for the day [62].
In another situation, households were divided on the basis of their time of use: those who used energy when wholesale prices were high, and those who did not [62].
Importantly, demographic factors influenced these data: working from home, hours of television watched per week, and education were all correlated with which cluster specific residences were placed in [63]. This research further highlights the relationship between socio‐demographics and energy use. Additionally, Tureczek and Nielson stated that the most successful clustering classifications supplemented their SM data with survey data to better understand socio‐demographic characteristics of the clusters [68]. This is an important point, as it highlights the need to supplement SM data and clustering techniques for a better understanding of occupants themselves.
Energy profiling is an emerging field of research that blends together occupant behavior and SM data analysis. Through profiling, we can determine the categories of occupants that use the most and least energy, and we can also determine energy use behaviors such as the time of week, time of day, or seasons that occupants use energy.
Essentially, profiling helps researchers gain a better picture of how occupants use energy, which will help SM programming to become more tailored to the needs and behaviors of occupants.
Profiling utilizes clustering analyses (as previously discussed) and regression analyses to determine relationships between users and energy patterns. Broadly speaking, energy profiling is an interdisciplinary area that combines numerous methodologies to understand myriad energy patterns for a variety of occupants. SM data serves as a common denominator, wherein the presence of more granular energy use data provided by these meters helps researchers better understand energy use patterns and the increasing understanding of occupants themselves can offer better predictions of who uses more energy and why. By combining methods and understanding occupants, researchers build a more comprehensive picture of building energy use.
5. Socio‐Psychological Influence 5.1. Overview
This final section building on the previous sections by highlighting the importance of understanding human motivation in utilization of SM technology. This paper stresses the importance of interdisciplinary, holistic understanding of building energy use;
however, in order to better utilize SM technology and ensure large‐scale penetration, researchers must better understand human motivation that facilitates or limits SM adoption intentions. When researchers better understand these socio‐psychological influences, they can better tailor SM deployment to the needs of occupants, and subsequently obtain more, higher‐quality SM data with occupants who are less anxious of and more open to utilizing such technologies
The field of socio‐psychological influences on pro‐environmental behaviors is growing as more researchers understand the need for interdisciplinary research in energy studies. By better understanding certain social or psychological motivations in energy‐
efficient behavior, energy providers, researchers, utilities, and municipalities can better understand how consumers will react to newer technologies and services. In fact, one recent review on consumer behavior states that future SM consumer engagement campaigns should be tailored not towards traditional demographic segmentations but to more psychological ones such as lifestyle, attitudes, values, and environmental concern [80]. As mentioned previously in the paper, SM technology has not had the desired impact and does not save users as much money because there is a lack of attention given to occupants’ attitudes and behaviors—this is where socio‐psychological research can help tailor SM research and programming towards users themselves. However, it is worth noting that this is an emerging field, and the number of studies that focus on socio‐
psychological determinants of smart technology adoption is limited. Below, we have selected the most relevant studies.
Generally, when social psychologists want to predict or transform pro‐
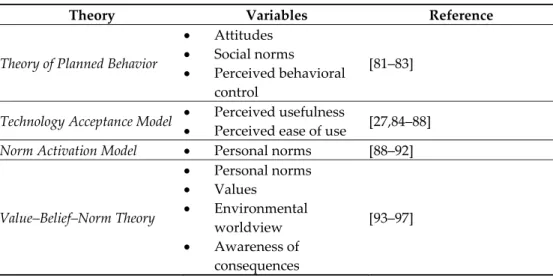
environmental behaviors, there are four theories or models that are followed. Researchers use survey methodology regression analyses to understand how the variables in each of the following models influence a person’s attitudes, support, or intention to adopt SM technology. Additionally, researchers tend to combine models for a more holistic approach towards understanding energy customers and SMs. See Table 2 below for an overview of theories, models, and variables, and select studies that utilize these theories.
Note that many researchers combine and extend these models, and therefore some references might appear for multiple theories and variables.
Table 2. Theories and variables used to determine SM attitudes and adoption intentions.
Theory Variables Reference
Theory of Planned Behavior
Attitudes
Social norms
Perceived behavioral control
[81–83]
Technology Acceptance Model Perceived usefulness
Perceived ease of use [27,84–88]
Norm Activation Model Personal norms [88–92]
Value–Belief–Norm Theory
Personal norms
Values
Environmental worldview
Awareness of consequences
[93–97]