Worker remittances and the global preconditions of ‘smart development’1
Arno TAUSCH
Honorary Adjunct Professor of Economics, Corvinus University Budapest Adjunct Professor of Political Science, Innsbruck University
E-mail: arno.tausch@uibk.ac.at
Almas HESHMATI
Professor of Applied Economics, Department of Food and Resource Economics, Korea University, Seoul
E-mail: heshmati@korea.ac.kr
With the growing environmental crisis affecting our globe, ideas to weigh economic or social progress by the ‘energy input’ necessary to achieve it are increasingly gaining acceptance.
This question is intriguing and is being dealt with by a growing number of studies, focusing on the environmental price of human progress. Even more intriguing, however, is the question of which factors of social organization contribute to a responsible use of the resources of our planet to achieve a given social result (‘smart development’). In this essay, we present the first systematic study on how migration – or rather, more concretely, received worker remittances per GDP – helps the nations of our globe to enjoy social and economic progress at a relatively small environmental price. We look at the effects of migration on the balance sheets of societal accounting, based on the ‘ecological price’ of the combined performance of democracy, economic growth, gender equality, human development, research and development, and social cohesion. Feminism in power, economic freedom, population density, the UNDP education index as well as the receipt of worker remittances all significantly contribute towards a ‘smart overall development’, while high military expenditures and a high world economic openness are a bottleneck for ‘smart overall development’.
Keywords: ???
JEL-codes: C43, Q56, F22, F24
1 The comments by the two anonymous reviewers of this paper were highly appreciated. The corrected version tries to integrate the various helpful suggestions received. Final version: August 24 2012.
1. Introduction
With the growing environmental crisis affecting our globe, ideas to weigh economic or social progress by the ‘energy input’ necessary to achieve it are increasingly gaining acceptance.
This question is already intriguing enough and is being dealt with by a growing number of studies in different disciplines, including environmental economics, geography, political science and sociology, focusing on the environmental price of human progress. Geography, in particular, seems to be pre-destined to focus on the processes and indicators of sustainable development (Sénécal – Hamel 2001;).
A highly relevant question is which factors of social organization contribute to a responsible use of the resources of our planet. In this essay, we will present the first systematic study on how migration – or rather, more concretely, received worker remittances per GDP – helps or hinders the nations of our globe to enjoy social and economic progress at a relatively small environmental price. We look at the effects of migration on the balance sheets of societal accounting, not based on such variables as democracy, economic growth, gender equality, human development, research and development, or social cohesion, but at the ‘ecological price’ of the combined performance in democracy, economic growth, gender equality, human development, research and development, and social cohesion.
If anything, the 21st century we live in is a century of the simultaneity of the problems we face. Environmental destruction and climate change happens at an unprecedented scale, as does the phenomenon of mass migration on a global scale. Scholary disciplines might know their strict borders, but the problems of today cannot be neatly separated into different compartments, and at the end of the day, there are no limits between ‘environmental problems’ and ‘migration’, while there are still strict limits between ‘environmental economics/sociology’ and ‘economics/sociology of migration’ at the departments of social science around the globe and in scholarly journals, publishing their output.
Even at the risk of overburdening our readership, which might be perhaps not yet really accustomed with the new terminology of ‘environmental accounting’ of global development, we have to introduce some of this terminology already at the very beginning of the paper in order to be able to better explain what this essay is all about. The idea to express
‘development’ in relationship to the energy needed to sustain it, is a new approach in social sciences. As development theory has become more and more ecological in recent years, we
have to arrive at measures, which ‘price’ economic progress in terms of the environmental inputs needed to sustain it. The idea of an environmental pricing of progress receives a powerful support from the following logic: among all the available global measures about environmental destruction, the ecological footprint is perhaps the most dramatic one. It measures how much land and water area a human population requires to produce the resources it consumes and to absorb its carbon dioxide emissions, using prevailing technology.2 Even reading this article requires the use of natural resources. The ecological footprint is usually measured in global hectares. Existing time series allow us to grasp the extent of the accelerating environmental constraints facing our globe.3 In 1961, the richer, industrialized countries, grouped together in the OECD, had an ecological footprint of 3.6 global hectares per capita, while by 2005 this had increased to 6.0 global hectares per capita.
In 1961, just 4.2 global hectares per capita would have been necessary in the OECD to sustain a good life expectancy of 80 years of age, while in 2005 the ‘environmental price’ of 80 years life expectancy in the OECD had increased to 6.1 global hectares per capita. In poor nations, such as Haiti, Bangladesh, Congo, Malawi, Tajikistan, Nepal, or the Philippines, one global hectare per capita or less of ecological footprint would be needed to sustain a life expectancy of 80 years of age, while in Luxembourg, the United States of America, the United Arab Emirates, Kuwait, Denmark, Australia, New Zealand, Iceland, Estonia, Canada, Norway, Ireland, Botswana, Greece, Uruguay, Namibia, Spain, Czech Republic, Hong Kong, the United Kingdom, Finland, Belgium, Sweden, and Austria five or more hectares of ecological footprint per capita are needed to sustain a life expectancy of 80 years. With a relatively low environmental price of a footprint of 2.3 global hectares per capita, Costa Rica enjoys a life expectancy of 78.5 years, while in crisis-ridden Greece, a life expectancy of 78.9 years is bought at the heavy environmental and also economic price of 5.9 global hectares per capita.
More and more political leaders and also mass media around the globe tend to refer to such experiences as the one in Costa Rica as ‘smart development’, while Greece and other ‘sinners’
along this scale are countries which have to make their development ‘smarter’.
We provide our readers with cross-national data on how large ecological footprints are used in the nations of the world system to ‘deliver’ a given combined amount of democracy, economic growth, gender equality, human development, research and development, and social cohesion.
2 For more details see: http://www.footprintnetwork.org/en/index.php/GFN/page/glossary/.
3 See for example http://www.happyplanetindex.org/learn/download-report.html for an example of such time series.
This is what we understand then as ‘smart development’, and from there we then move on to determine its possible ‘drivers’ and ‘bottlenecks’. The very idea of ‘smart development’ was first proposed by Meadows (1992) and has not been really followed up to now in social science ever since. In the face of the current huge usage of the term ‘smart’ in an environmental policy context in the international media, such a statement is perhaps surprising, but our verdict corresponds to the clear bibliographical evidence on the base of such indices as ‘ISI Web of Knowledge/Thomson Reuters’, ‘Scopus/SciVerse/Elsevier’ or
‘Cambridge Scientific Abstracts/Proquest’.4
In a similar vein, the Happy Planet Organization presented the so-called ‘Happy Planet Index’
(HPI), which is an index of measuring the trade-off between ecological footprint data and life quality (Happy Life Years, HLYE, i.e. life expectancy weighted by human happiness data, gained from standardized international public opinion surveys). Arguably, ecological footprint today is the best single international yardstick for environmental destruction in a nation (see also, in general terms, York – Rosa – Dietz (2003) and for a recent application in development geography Holden – Jacobsen (2009)).
Economic theory, for sure, is conscious about the non-linearity of the trade-off between income and happiness, with rising income levels not necessarily increasing the happiness of all. This phenomenon has become widely known in the economic research literature as the
‘Easterlin paradox’ (Easterlin 1995; 2001; Frey – Stutzer, 2002; Oswald, 1997; Stevenson – Wolfers, 2007). We show in our article how different standard predictors of international development accounting contribute to the explanation of the ‘smart development’
phenomenon. It turns out that worker remittances play an important role in this context.
To address our research question, we first developed a UNDP-type performance indicator from current standard international comparative, cross-national social science data on what we see as the six main dimensions of development (democracy, economic growth, gender equality, human development, research and development, and social cohesion) and provide a combined performance index on these six dimensions (a kind of super-UNDP ‘human development index’). We then analyse in non-linear standard OLS regression the trade-offs between ecological footprints per capita on the overall performance index. The residuals from
4 Searching for the exact term ‘smart development’.
this regression are our new measure of smart development: a country experiences smart development, if it achieves a maximum of combined democracy, economic growth, gender equality, human development, research and development, and social cohesion with a minimum of ecological footprint.
The independent variables, used in our research to explain performance along this new international scale of smart development in the first decade of the new Millennium range from standard social science cross national development accounting explanatory variables measuring the dimensions of feminism, demography, economic freedom, geography, dependency and world systems theories, to migration, convergence effects of poorer countries growing more rapidly than richer countries, Muslim population shares and membership of a country in the Organization of Islamic Cooperation, military expenditures and military personnel rates, human capital formation, and participation in European economic and monetary integration.5
These standard comparative cross-national data operationalize standard economic, sociological and political science knowledge in international development accounting. We compare the predictive power of all these standard predictors, using standard OLS stepwise regression procedures, weeding out the relevant from the irrelevant predictors of smart development. The final model is based on standard forward OLS multiple regression. The outcome of this exercise is our proof of the importance of worker remittances for ‘smart development’.
In Chapter 2 we sketch a possible theoretical background. Chapter 3 will introduce the measurement concepts and the methodology of this essay. Chapter 4 will be dedicated to the presentation of the results on the drivers and bottlenecks of ‘smart development’, while Chapter 5 will discuss the results. Chapter 6 presents our preliminary conclusions.
2. Theoretical background
To present a theory or competing theories of ‘smart development’ is virtually impossible, because there has been no measurement, let alone accounting of its cross-national successes and failures in the literature up to now. We really had to start research into this issue from
‘scratch’. For that reason, our survey of existing development theories has to be ‘inclusive’;
5 Interested readers are referred to the quantitative data underlying our analysis. They can be downloaded freely at http://www.hichemkaroui.com/?p=2017 and http://www.hichemkaroui.com/?p=2383.
and the various competing development theories reflect themselves in the array of independent variables.6
The economics profession studied for many years the weight of a very wide array of ‘drivers’
of economic growth (Levine – Renelt 1992). Empirical linkages between long-run growth rates and a variety of economic policy, political, and institutional indicators are often seen to be very fragile to even small changes in the conditioning information set. But there is a positive, robust correlation between growth and the share of investment in GDP and between the investment share and the ratio of international trade to GDP. The variety of relationships, tested in multiple regression analysis, is truly amazing and includes a wide range of predictors (see also Alesina – Spolaore – Wacziarg 2000; Dollar 1992a; 1992b; Edwards 1993; Frankel – Romer 1999; Rodrik 2006; Rodrik – Subramanian – Trebbi 2004; and World Bank 2005).
While Dollar’s writings, widely disseminated around the globe, were especially straightforward in suggesting that a high share of exports and imports per GDP, and hence, an outward orientation of the society in question, is especially beneficial for economic growth and works in favour of the poorest strata of the population, the equally widely disseminated and received study by Frankel and Romer (1999), comes to a more cautious conclusion:
examining the correlation between trade and income one really cannot identify the direction of causation between the two. Rodrik, Subramanian, and Trebbi (2004) further shattered the optimistic assumptions about the beneficial effects of world economic openness on development outcomes in their study about the respective contributions of institutions, geography, and trade in determining income levels around the world, using recently developed instrumental variables for institutions and trade. In his influential study, Rodrik (2006) Rodrik even went so far as to fundamentally question the ‘Washington Consensus’
based on open markets, which featured so prominently in Dollar (1992a and 1992b).
Confronted with the recurrent stability of our research results, indicating a huge effect from worker remittances on ‘smart development’ variables, we decided to re-consider migration in our theoretical survey. As it is well-known, migration is part and parcel of the ‘four freedoms’
of capitalism, besides the freedom of goods, services, and capital. A particular earlier flagship survey of the hitherto existing migration theories (Masey et al. 1993) came to the pessimistic conclusion that migration theories up to that time were either advanced to explain the
6 Interested readers are especially referred to the codebooks in pdf format, made available at http://www.hichemkaroui.com/?p=2017 and http://www.hichemkaroui.com/?p=2383, where the independent variables are described in detail.
initiation of international migration or put forth to account for the persistence of migration across space and time. Masey et al. suggested that, because they are specified at such different levels of analysis, the theories are not inherently logically inconsistent. As Taylor (2006) pointed out in his later, summarizing policy statement on the state of migration theory for the United Nations in 2006, indeed it would be foolish to exclude migration from any future discourse about global development: the number of international migrants has increased more or less linearly over the past 40 years, from an estimated 76 million in 1965 to 188 million in 2005. The flow of international migrant remittances has increased more rapidly than the number of international migrants, from an estimated US $2 billion in 1970 to US $216 in 2004. Nearly 70% of all remittances go to least developed countries (LDCs). Remittances were equivalent to 78% of the total value of exports in El Salvador and 108% in Nicaragua.
As Taylor (1999) also pointed out in that worker remittances are especially affecting the less developed sending countries by the multiplier effect, well-known in economics since the days of John Maynard Keynes: $1 of remittances from international migrants may create $2-$3 or even more of new income in migrant-sending areas. One person’s spending is another person’s income. Even if all income in remittance-receiving households is spent on consumption, remittances may stimulate investments by the other households whose incomes go up (Taylor 2006: 9). The optimistic view about worker remittances is also supported in the well-received comparative international study by Ziesemer (2009).
Migration is thus seen in many approaches as a win-win situation (Williamson 2002). For several observers, among them Hatton and Williamson (2009) the ‘current hysteria’ about inward migration in many industrialized countries has no real basis. For them, the Third World has been undergoing an emigration cycle since the 1960s, and, except for Africa, emigration rates have been level or even declining since a peak in the late 1980s and the early 1990s. The current economic crisis will serve only to accelerate those trends. Sanderson (2010) was one of the first consistent research attempts to bring in migration as a determining variable of social well-being. Contemporary levels of international migration in less- developed countries are raising new and important questions regarding the consequences of immigration for human welfare and well-being. However, there is little systematic cross- national evidence of how international migration affects human development levels in migrant-receiving countries in the less-developed world. The Sanderson paper addresses this gap in the literature by assessing the impact of cumulative international migration flows on the human development index, the composite, well-known UNDP measure of aggregate well-
being. A series of panel data models are estimated using a sample of less-developed countries for the period 1970-2005. The results indicate that higher levels of international migration are associated with lower scores on the human development index, net of controls, but that the effect of international migration is relatively small.
A vast body of literature in quantitative social sciences – especially in sociology and political science – develops sympathy with what could be loosely called ‘globalization critical’
movements across the globe and maintains that world economic openness, unlimited inflows of foreign direct investments, export orientation and the rest of the canon of the ‘Washington Consensus’. Among the most vociferous contributors to such kind of thinking was the Egyptian economist Samir Amin (1973; 1976; 1994; 1997a; 1997b) who combines in his writings, based in Marxian economics and Marxian value theory a theoretical expectation of a combination of negative results of ‘world economic openness’ for global development outcomes with insights into the detrimental role of Islamism in world society and a non-neo- liberal critique of rent-seeking, and the positive role of transfers of international resources, brought about by large-scale migration from the periphery to the centre of the world system to the benefit of the countries of the periphery. All the factors mentioned in a scattered fashion in his numerous writings, i.e. the absence of openness, the role of the monopolies of powerful and big countries, the positive consequences of outward migration and the negative effects of rent-seeking, could be an important element in the accounting of the drivers of ‘smart development’.
Reasons of space do not permit us to debate at greater length the very vast sociological, political science and economic theory literature, centred on subjects like the penetration of multinational corporations (MNC PEN)7 and economic and social development and its possible effects on the environmental situation. Our research duly acknowledges the possible effects, wielded by dependency and a peripheral role in the world system. In our brief summary of the empirical effects to be expected, we should rather concentrate, first of all, on
7 MNC penetration is the key variable of most quantitative dependency and world systems theories, and it measures the weight that cumulated foreign capital investments have in the host countries, i.e. the percentages of the cumulated stocks of multinational corporation investments per total host country GDP. Bornschier and his school predicted a strong long-term negative determination of development by a high MNC penetration, due to the negative consequences monopolies have on the long term development trajectory of countries. The 10 countries with the highest MNC penetration rate in 1995 were: Hong Kong, China (SAR), Saint Kitts and Nevis, Equatorial Guinea, Vanuatu, Saint Lucia, Antigua and Barbuda, Dominica, Singapore, Guyana, Trinidad and Tobago. The 10 least MNC-penetrated countries in the world were: Dominican Republic, Cyprus, Sao Tome and Principe, Cuba, Nepal, Kuwait, Belarus, Japan, Uzbekistan, and Bhutan. For more data see the UNCTAD table available at http://www.unctad.org/sections/dite_dir/docs/wir2007_instock_gdp_en.xls.
what was actually predicted by Bornschier, Chase-Dunn and Rubinson (1978: 651), which must be regarded still as the most often quoted flagship study of empirical dependency theory, analyzing the effects of MNC PEN on economic growth and income inequality:
(1) The effect of direct foreign investment and aid has been to increase economic inequality within countries. (2) Flows of direct foreign investment and aid have had a short-term effect of increasing the relative rate of economic growth of countries. (3) Stocks of direct foreign investment and aid have had the cumulative, long-term effect of decreasing the relative rate of economic growth of countries. (4) This relationship has been conditional on the level of development of countries. The stocks of foreign investment and aid have had negative effects in both richer and poorer developing countries, but the effect is much stronger within the richer than the poorer ones. (5) These relationships hold independently of geographical area.8
More recently, there was also a real ‘growth industry’ of blossoming and booming dependency and world-system oriented studies of environmental problems. It has become really fashionable in many traditions of sociology and political science to blame the lack of
‘sustainable development’ on globalization and the workings of ‘global capitalism’, perceived as a centre-periphery system. Such studies relied on a startling variety of environmental indicators. The coherent tendency of these studies, most notably Jorgenson (2003; 2004a;
2004b and Blais 2000) would suggest that there could be a strong testable causal interaction between transnational capitalist penetration and environmental degradation, especially in third world countries.
Our main independent variables and their theoretical linkages to explain ‘smart development’
are presented in Table 1. For a general analysis on all possible cross-national determinants of development, see also Sala-i-Martin, Doppelhofer and Miller (2004).
Table 1. the independent variables of our model
Independent variables,
determinants of smart development
Theories or earlier empirical studies using these variables
% of women in government, all levels Holmberg, Rothstein and Nasiritousi (2009); Matt (2010)
% of world population Acemoglu, Johnson and Robinson (2001, 2002, 2005); Amin (1973, 1976, 1994, 1997a, 1997b); Crenshaw and Robison (2010);
8 However much the present authors might have shared dependency-oriented perspectives in the past, the interesting question under debate here is whether dependency – understood in the Bornschier tradition – is able to explain ‘smart development’. Our empirical research will show the dramatic paradigmatic shift in favour of migration and away from dependency theory, if we want to comprehend the ‘smart development’ phenomenon.
Kohr (1957); Ram (1997); Schumacher (1973a, 1973b) 2000 Economic Freedom Score Alesina and Perotti (1994); Gwartney, Lawson, and Holcombe
(1999); Helliwell (1994); La Porta, Lopez de Silanes, Shleifer (1999); York, Rosa and Dietz (2003)
Absolute latitude Easterly (2000); Poe and Tate (1994); Ram (1997) Annual population growth rate, 1975-
2005 (%)
Acemoglu, Johnson and Robinson (2001, 2002, 2005); Crenshaw and Robison (2010); Ram (1997)
Comparative price levels (US=1.00) Egert, Drine and Lommatzsch (2003); Faria and Leon-Ledesma (2003); Gould (2002); Kohler and Tausch (2001)
Foreign savings rate Doucouliagos and Paldam (2008); Easterly and Schmidthebbel (1993); Feldstein (1994)
FPZ (free production zones)
employment as % of total population
Chen (1995); Rondinelli (1987)
Immigration, share of population 2005 (%)
Barro and Sala-i-Martin (2003); Durlauf et al. (2008); Fain (1997);
Fosu (2009); UNDP (2009) ln GDP per capita Barro (2000); Stern (2004) ln GDP per capita ^2 Barro (2000); Stern (2004) Membership in the Organization of
Islamic Cooperation (OIC); Muslim population share per total population
Acemoglu, Johnson and Robinson (2001, 2002, 2005); Haynes, (2001); Ram (1997); de Soysa and Ragnhild (2007)
Military expenditures per GDP Auvinen and Nafziger (1999); Biswas and Ram (1986); Hamid (2007)
Military personnel rate ln (MPR+1) Weede (1980, 1981, 1983) MNC outward investments (stock)
per GDP; MNC PEN - stock of Inward FDI per GDP; MNC PEN:
DYN MNC PEN 1995-2005
Bornschier (1982, 2002)
Net international migration rate, 2005-2010
Ehrhardt-Martinez, Crenshaw and Jenkins (2002)
Openness-Index, 1990 (export-share per GDP + import-share per GDP)
Dollar (1992a, 1992b); Frankel and Romer (1999); Rodrik (2006);
Rodrik, Subramanian, and Trebbi (2004); World Bank (2005) Population density Acemoglu, Johnson and Robinson (2001, 2002, 2005); Ram (1997) Public education expenditure per
GNP; UNDP education index
Blankenau and Simpson (2004); Glomm and Ravikumar (1997);
Ram (1986); Scanlan (2004); Sylwester (2000); Weede and Kampf (2002)
Worker remittance inflows as % of GDP
Acosta, Calderon, Fajnzylber, et al. (2008); Amuedo-Dorantes and Pozo (2004); Martin and Straubhaar (2002)
Years of membership in EMU, 2010, Years of membership in the EU, 2010
Allsopp and Artis (2003); Buti, Franco and Ongena (1998); de la Porte, Pochet and Room (2001); Egert, Drine and Lommatzsch (2003); Molle and Boeckhout (1995)
3. Methods and measurement
To start with, we used a freely-available new cross-national comparative data set, which is freely available on the Internet (Tausch 2011a; 2011b). These electronic data sets offer Microsoft Excel data and lists of the international standard sources, and codebooks in pdf format. Tausch (2011a) also offers an Excel file with the combined UNDP type development performance index, on which this study rests. A brief description of the smart development data, calculated from these data sources is also contained in the Appendix of this work.
So what is development? To gain a real empirical knowledge under scrutiny here, we first developed UNDP-type indicators from current standard international comparative, cross- national social science data on six dimensions of development. We then investigated the non- linear standard OLS regression trade-off between ecological footprint per capita and its square and the overall development performance indices. Smart and simple: the residuals from these regressions are our new measure of smart development: with a minimum of ecological footprint one has to achieve a combined maximum of democracy, or economic growth, or gender equality, or human development, or research and development, or social cohesion.
These data are provided for in the Appendix Tables 1 and 2.
‘Smart development’, is mathematically derived from the ecological footprint and the logic of the Happy Planet Index (which compares Happy Life Years with ecological footprint; see also Ng, 2008a and 2008b; Veenhoven, 1996). Ecological footprint (global hectare per capita), as it is universally well-known by now, is a one-catch all-indicator of ecological strain, caused by human activity. Ecological footprint is a measure of the amount of land required to provide all resource requirements plus the amount of vegetated land to sequester (absorb) all CO2
emissions and the CO2 emissions embodied in the products individuals consume. This figure is expressed in units of ‘global hectares’ (for studies about the logic and determinants of footprint per capita see also Dietz et al., 2007 and 2009). The variables combined and compared to the footprint, which were used by a society to achieve a given standard of development, included democracy, economic growth, gender equality, human development, research and development, and social cohesion. The exact variables are listed in table 2.
Table 2. Measuring development
democracy Combined Failed States Index democracy Civil and Political Liberties violations
democracy Corruption avoidance measure democracy Democracy measure
democracy Global tolerance index democracy Rule of law
economic growth Crisis Performance Factor
economic growth economic growth IMF prediction growth rate in 2009 economic growth economic growth IMF prediction growth rate in 2010 economic growth economic growth in real terms pc. per annum, 1990-2005
Gender equality closing economic gender gap Gender equality closing educational gender gap Gender equality closing health and survivial gender gap Gender equality closing of global gender gap overall score 2009 Gender equality closing political gender gap
Gender equality gender empowerment index value human development Infant mortality 2005
human development female survival probability of surviving to age 65 female human development Human development index (HDI) value, 2004
human development Life Expectancy (years) human development Life Satisfaction (0-10)
R&D Country share in top world 500 Universities R&D per capita world class universities
R&D tertiary enrollment
social cohesion quintile share income difference between richest and poorest 20%
social cohesion unemployment rate Nonparametric index, using 26
equal weights
overall 26 development index
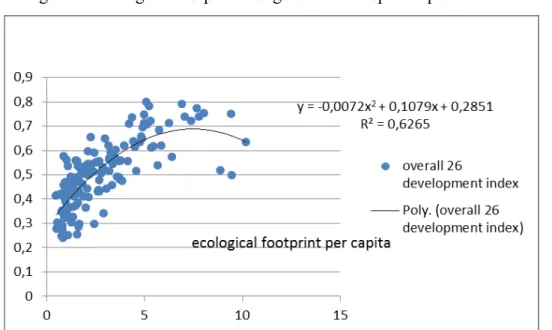
Following Heintz (1972) we propose to calculate our smart development indicator as the standardized residuals from Figure 1. Figure 1 shows the trade-off between ecological footprint and ‘smart development’, combining the various dimensions (democracy, economic growth, gender equality, human development, research and development, social cohesion).
The overall development performance is a clear non-linear, inverted U-shaped function of ecological footprint per capita.
The standardized residual values are computed as observed minus predicted development outcomes divided by the square root of the residual mean square:
σˆ / ˆ )
( i i
i HLYE HLYE
SDP = − (1)
High positive outliers imply a very high smart development performance, while countries below the trend line are the countries with a low smart development performance. Having established a residual-based smart Development Indicator family, we now can look more realistically at the cross-national determinants of smart development performance.
Figure 1. Ecological footprint and general development performance
Note: the figure shows the non-linear trade-off between ecological footprint per capita and a general development performance index, based on an equal weighting of its 26 components
The choice of a country to be included in the final analysis (175 countries) was determined by the availability of a fairly good data series for these independent variables (if not mentioned otherwise, originally UNDP data for the middle of the first decade of the new millennium, all contained in Tausch (2011a, 2011b)). In the final regressions, we applied the ‘list wise deletion of missing values’ routine (i.e. only entering countries with complete data into the statistical analysis).
The statistical design of our study is based on the ordinary least square standard regression analysis (using SPSS 17) of the ‘kitchen sink type’ of economic growth and economic, social and political performance in the research tradition of Barro (2003); Durlauf et al. (2008);
Hertz, Hebert, and Landon (1994).9
9 To our knowledge, the term ‘kitchen sink regression’, commonly used in the econometrics of economic growth, was re-introduced in more recent standard social science journal vocabulary by Laver and Shepsle (1999).
As we already mentioned in Table 1 of this article, our investigation duly acknowledged originally many of the key possible determinants of economic growth, mentioned in the economic literature, like current shares of the country’s inhabitants in total world population, calculated from UNDP data; the famous Heritage Foundation 2000 Economic Freedom Score;
absolute geographical latitude, adapted from Easterly (2000; 2002; Easterly – Levine 1997;
Easterly – Schmidthebbel 1993); the UNDP figures for long-term annual population growth rate, 1975-2005 (per cent); the trade-off between development level and development performance, otherwise also known in economics as ‘conditional convergence’ (ln GDP per capita; ln GDP per capita ^2); the simple Huntingtonian fact of whether a country is a Muslim country, to be measured by membership in the Organization of Islamic Conference (OIC) or by Muslim population share (Nationmaster); UNDP data on the simple geographical fact of population density (based on the CIA’s World Factbook); UNDP data on public education expenditure per GDP; and the UNDP education index, combining the enrolment rates at the primary, secondary and tertiary education levels. We also take into account UNDP figures on military expenditures per GDP and the openly available CIA data on military personnel rates, which are key variables of contemporary political science, international relations theory and peace research. In our analysis, we also show the theoretical and practical (political) potential of the following two drivers of development, which are somewhat a ‘terra incognita Australis’
in the hitherto existing macro-sociological debate, like migration and European (Monetary) Union membership. Table 1 above already listed some of the very rich empirical literature, having been published on these issues in recent years.
4. Results on the drivers and bottlenecks of ‘smart development’
The predictive power of our seven final variables, which wielded significant results in the pre- tests, is enormous:
1. Percentage of women in all levels of government 2. 2000 Economic Freedom Score
3. Military expenditures per GDP
4. Openness-Index. 1990 (export-share per GDP + import-share per GDP) 5. Population density
6. UNDP education index
7. Worker remittance inflows as percentage of GDP
These variables determine almost two fifths of global smart development. All other predictors were left out from the regression model.
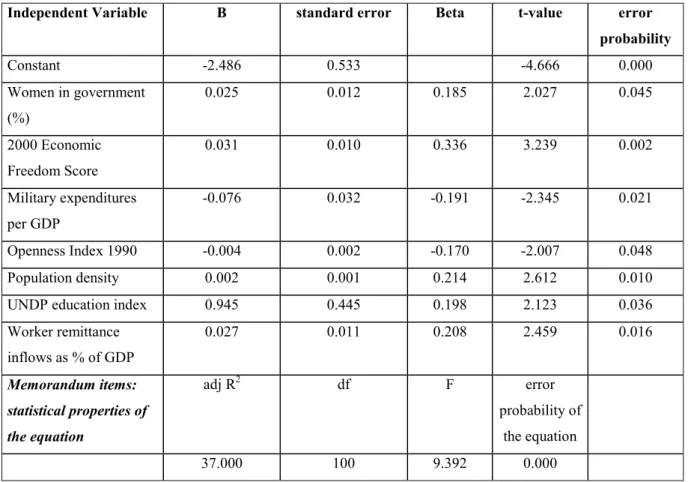
We can establish in Table 3 that in the 101 countries with complete data, ‘smart development’
is explained to 37% by our final model. The F-test for the entire equation is 9.392, the error probability is 0.000. The constant is -2.486 and is significant. The three countries of the world system, best combining the performance on our 26 development indicators and avoiding a large ecological footprint at the same time are the Philippines, Sri Lanka, and Costa Rica. The three worst performers on this scale are Sudan, Bosnia and Herzegovina, and the Central African Republic. Feminism in power, economic freedom, population density, the UNDP education index as well as the receipt of worker remittances all significantly contribute towards a smart overall development, while high military expenditures and a high world economic openness are bottlenecks for smart development.
Table 3. Drivers and bottlenecks of smart overall development
Independent Variable B standard error Beta t-value error
probability
Constant -2.486 0.533 -4.666 0.000
Women in government (%)
0.025 0.012 0.185 2.027 0.045
2000 Economic Freedom Score
0.031 0.010 0.336 3.239 0.002
Military expenditures per GDP
-0.076 0.032 -0.191 -2.345 0.021
Openness Index 1990 -0.004 0.002 -0.170 -2.007 0.048
Population density 0.002 0.001 0.214 2.612 0.010
UNDP education index 0.945 0.445 0.198 2.123 0.036
Worker remittance inflows as % of GDP
0.027 0.011 0.208 2.459 0.016
Memorandum items:
statistical properties of the equation
adj R2 df F error
probability of the equation
37.000 100 9.392 0.000
Source: SPSS 17 calculations based on http://www.hichemkaroui.com/?p=2017 and http://www.hichemkaroui.com/?p=2383 .
5. Discussion
Our residuals-based analysis of the drivers and bottlenecks of smart development realistically capture the fact that feminism in power, economic freedom, population density, education, and the benefits from participating in a free or relatively free global migration regime are the drivers of smart development, while military expenditures and export orientation – as predicted by Brand et al. (2010) are the two main bottlenecks of combined smart development.
In a sense, our results also contradict the logic, inherent in the ‘small is beautiful’ analysis, proposed by Schumacher (1973a): not the small countries, but countries with a high population density find it easier to have a satisfactory smart development performance in comparison to the ecological footprint created by them. Our research also shows the beneficial effects of migration on the sending countries. Worker remittances have a significant positive effect on smart development. Migration sending countries, as to be expected from both the ‘new migration theories’ and Samir Amin’s dependency theory (Amin 1973; 1976;
1994; 1997a; 1997b), reap substantial benefits from receiving worker remittances, while other indicators of globalization hardly affect smart development performance. World economic openness on the other hand wields a significant negative effect, as expected by Amin’s dependency theory.
6. Conclusions
Since all existing major comparative empirical studies on drivers and bottlenecks of environmental quality only touched upon different dependent variables, and not smart development as such, this first international comparative study seems to suggest cautiously that future research efforts in comparative environmental science would be well advised to take the major predictor variables of the present study as well as the environmental plateau curve into account (see also Weede and Kampf 2002; de Haan, Lundstrom and Sturm 2006;
and Gwartney, Lawson and Holcombe 1999).
It emerges that the absence of ‘rent seeking’, economic freedom, and a free price mechanism, and worker remittances are the most important drivers of ‘smart development’. Most of the
‘small is beautiful’ assumptions of Schumacherian economics by contrast do not stand the test of cross-national development accounting and are squarely contradicted by our empirical
results; with population density always being among the drivers, and not the bottlenecks of smart development.
As correctly expected by Amin, peripheral rent seeking is a burden and its absence, measured by economic freedom, is an asset among the forces, shaping international development today.
Amin correctly analysed the enormous transfer of resources from the centre to the periphery, brought about by migration, with the huge statistical observed effects of received worker remittances on smart human development, justifying his assumption. Amin’s dependency theory also correctly predicted the very negative effects of world economic openness on smart development.
We could also show in this article the importance of feminism for smart development. We also investigated the negative effects of military expenditures on smart development.
We are aware that our answers given to the questions raised in this article, are incomplete. But we hope to have provided at least some preliminary guiding posts for further research on this important subject, and to have shown that worker remittances are a positive asset for the labour sending countries in the emerging world economy.
For the policy makers at the European level, who, with their ‘Europe 2020 strategy’, have set themselves the target of turning the EU into a ‘smart, sustainable and inclusive economy’, delivering employment, productivity and social cohesion, and that the EU meets five ambitious objectives in the fields of employment, innovation, education, social inclusion and climate/energy, our comparative data analysis shows that to meet such ambitious objectives, gender empowerment, economic freedom, investment in education, but also reaping the benefits of migration will play an important role in enhancing European performance. Some reservations against a too rapid pace of globalization are being vindicated in this article by the negative effects of export orientation on long-term smart development; and in addition, maintaining an era of détente in international relations is an important task for common European foreign policy: the negative effects of militarization on smart development are too clear to be overlooked.
Thus our article could develop, we hope, some guiding posts for further research on this important subject.
References
Acemoglu, D. – Johnson, S. – Robinson, J. (2001): The Colonial Origins of Comparative Development: An Empirical Investigation. American Economic Review, (91): 1369-1401.
Acemoglu, D. – Johnson, S. – Robinson, J. (2002): Reversal of Fortune: Geography and Institutions in the Making of the Modern World Income Distribution. Quarterly Journal of Economics, 117: 1231-1294.
Acemoglu, D. – Johnson, S. – Robinson, J. (2005): The Rise of Europe: Atlantic Trade, Institutional Change and Growth. American Economic Review, 95: 546-579.
Acosta, P. – Calderon, C. – Fajnzylber, P. (2008): What is the impact of international remittances on poverty and inequality in Latin America? World Development, 36(1): 89-114.
Alesina, A. – Perotti, R. (1994): The political economy of growth. A critical survey of the recent literature.
World Bank Economic Review, 8(3): 351-371.
Alesina, A. – Spolaore, E. – Wacziarg, R. (2000): Economic integration and political disintegration. American Economic Review, 90(5): 1276-1296.
Allsopp, C. – Artis, M. J. (2003): The assessment: EMU, four years on. Oxford Review of Economic Policy, 19(1): 1-29.
Amin, S. (1973): Le developpement inegal. Essai sur les formations sociales du capitalisme peripherique. Paris:
Editions de Minuit.
Amin, S. (1976): Unequal Development: An Essay on the Social Formations of Peripheral Capitalism. New York: Monthly Review Press.
Amin, S. (1994): Re-reading the postwar period: an intellectual itinerary. New York: Monthly Review Press.
Amin, S. (1997a): Capitalism in the Age of Globalization. London: Zed Books.
Amin, S. (1997b): Die Zukunft des Weltsystems. Herausforderungen der Globalisierung. Herausgegeben und aus dem Franzoesischen uebersetzt von Joachim Wilke. Hamburg: VSA.
Amuedo-Dorantes, C. – Pozo, S. (2004): Workers' remittances and the real exchange rate: A paradox of gifts.
World Development, 32(8): 1407-1417.
Auvinen, J. – Nafziger, E. W. (1999): The sources of humanitarian emergencies. Journal of Conflict Resolution, 43(3): 267-290.
Barro, R. J. (2000): Inequality and growth in a panel of countries. Journal of Economic Growth, 5(1): 5-32.
Barro, R. J. (2003): Economic Growth in a Cross Section of Countries. International Library of Critical Writings in Economics, 159(1): 350-386.
Barro, R. J. – Sala-i-Martin, X. (2003): Economic Growth. Cambridge, MA: MIT Press.
Biswas, B. – Ram, R. (1986):. Military Expenditures and Economic Growth in Less-Developed Countries.
Economic Development and Cultural Change, 34(2): 361-372.
Blais, R. (2000): Environnement et mondialisation: de la confusion à la convergence des discours. Canadian Geographer / Le Géographe canadien, 44(3): 286-297.
Blankenau, W. F. – Simpson, N. B. (2004): Public education expenditures and growth. Journal of Development Economics, 73(2): 583-605.
Bornschier, V. (1982): The World Economy in the World System. Structure Dependence and Change.
International Social Science Journal, 34 (1), 38-59.
Bornschier, V. (2002): Changing Income Inequality in the Second Half of the 20th Century: Preliminary Findings and Propositions for Explanations’ Journal of World-Systems Research, 8(1): 100 – 127.
Bornschier, V. – Chase-Dunn, Ch. K. – Rubinson, R. (1978): Cross-National Evidence of the Effects of Foreign Investment and Aid on Economic Growth and Inequality. American Journal of Sociology, 8 (3): 651-683.
Brand, U. et al. (2010): Conflicts in Environmental Regulation and the Internationalisation of the State.
Contested Terrains. London and New York: Routledge.
Buti, F. – Franco, D. – Ongena, H. (1998): Fiscal discipline and flexibility in EMU: The implementation of the stability and growth pact. Oxford Review of Economic Policy, 14(3): 81-97.
Chen, X. M. (1995): The evolution of free economic zones and the recent development of cross-national growth zones. International Journal of Urban and Regional Research, 19(4): 593-616.
Crenshaw, E. – Robison, K. (2010): Socio-Demographic Determinants of Economic Growth: Age-Structure, Preindustrial Heritage and Sociolinguistic Integration. Social Forces, 88(5): 2217-2240.
De Haan, J. – Lundstrom, S. – Sturm, J. E. (2006): Market oriented institutions and policies and economic growth: a critical survey. Journal of Economic Surveys, 20(2): 157-191.
de la Porte, C.; Pochet, P.; and Room, G. (2001): Social benchmarking, policy making and new governance in the EU. Journal of European Social Policy, 11(4): 291-307.
de Soysa, I. – Ragnhild, N. (2007): Islam's bloody innards? Religion and political terror, 1980-2000.
International Studies Quarterly, 51(4): 927-943.
Dietz, T. – Rosa, E. A. – York, R. 2007. Driving the human ecological footprint. Frontiers in Ecology and the Environment, 5(1): 13-18.
Dietz, T. – Rosa, E. A. – York, R. (2009): Environmentally Efficient Well-Being: Rethinking Sustainability as the Relationship between Human Well-being and Environmental Impact. Human Ecology Review, 16(1): 114-123.
Dollar, D. (1992a): Growth is good for the poor. Journal of Economic Growth, 7(3): 195-225.
Dollar, D. (1992b): Outward-oriented developing countries really do grow more rapidly. Evidence from 95 LDCs, 1976-1985. Economic Development and Cultural Change, 40(3): 523-544.
Doucouliagos H. – Paldam, M. (2008): Aid effectiveness on growth: A meta study. European Journal of Political Economy, 24(1): 1-24.
Durlauf, S. N. – Kourtellos, A. – Tan, C. M. (2008): Are any Growth Theories Robust? The Economic Journal, 118(1): 329-346.
Easterlin, R. A. (1995): Will raising the incomes of all increase the happiness of all? Journal of Economic Behavior & Organization, 27(1): 35-47.
Easterlin, R. A. (2001): Income and happiness: Towards a unified theory. Economic Journal, 111(473): 465-484.
Easterly, W. (2000): The Middle Class Consensus and Economic Development. World Bank Policy Research Working Paper No. 2346.
Easterly, W. (2002): Inequality does Cause Underdevelopment: New evidence. Center for Global Development, Working Paper 1.
Easterly, W. – Levine, R. (1997): Africa’s Growth Tragedy: Policies and Ethnic Divisions. Quarterly Journal of Economics, 112(4): 1203-1250.
Easterly, W. – Schmidthebbel, K. (1993): Fiscal deficits and macroeconomic performance in developing countries. World Bank Research Observer, 8(2): 211-237.
Edwards, S. (1993): Openness, trade liberalization, and growth in developing countries. Journal of Economic Literature, 31(3): 1358-1393.
Egert, B. – Drine, I. – Lommatzsch, K. (2003): The Balassa-Samuelson effect in Central and Eastern Europe:
myth or reality? Journal of Comparative Economics, 31(3): 552-572.
Ehrhardt-Martinez, K. – Crenshaw, E. M. – Jenkins, J. C. (2002): Deforestation and the Environmental Kuznets Curve: A Cross-National Investigation of Intervening Mechanisms. Social Science Quarterly, 83(1):
226-243.
Fain, H. D. et al. (1997): World-System Position, Tropical Climate, National Development, and Infant Mortality:
A Cross-National Analysis of 86 Countries. Human Ecology Review, 3: 197-203.
Faria, J. R. – Leon-Ledesma, M. (2003): Testing the Balassa-Samuelson effect: Implications for growth and the PPP. Journal of Macroeconomics, 25(2): 241-253.
Feldstein, M. (1994): Fiscal policies, capital formation, and capitalism. European Economic Review, 39(3-4):
399-420.
Fosu, A. K. (2009): Inequality and the Impact of Growth on Poverty: Comparative Evidence for Sub-Saharan Africa. Journal of Development Studies, 45(5): 726-745.
Frankel, J. A. – Romer D. (1999): Does Trade Cause Growth? American Economic Review, 89(3): 379-99.
Frey, B. S. – Stutzer, A. (2002): What can economists learn from happiness research? Journal of Economic Literature, 40(2): 402-435.
Glomm, G. – Ravikumar, B. (1997): Productive government expenditures and long-run growth. Journal of Economic Dynamics&Control, 21(1): 183-204.
Gould, E. D. (2002): Rising wage inequality, comparative advantage, and the growing importance of general skills in the United States. Journal of Labor Economics, 20(1): 105-147.
Gwartney, J. D. – Lawson, R. A. – Holcombe, R. G. (1999): Economic freedom and the environment for growth.
Journal of Institutional and Theoretical Economics – Zeitschrift fuer die Gesamte Staatswissenschaft, 155(4): 643-663.
Hamid, A. (2007): Military Expenditures and Inequality: Empirical Evidence from Global Data. Defence and Peace Economics, 18(6): 519–535.
Hatton, T. J. – Williamson, J. A. (2009): Vanishing Third World Emigrants? Harvard University, Department of Economics, http://www.economics.harvard.edu/faculty/williamson/jwilliamworkingpapers.
Haynes, J. (2001): Transnational religious actors and international politics. Third World Quarterly, 22(2): 143- 158.
Heintz, P. (1972): A macrosociological theory of societal systems; with special reference to the international system. Bern: H. Huber.
Helliwell, J. F. (1994): Empirical linkages between democracy and economic growth. British Journal of Political Science, 24: 225-248.
Hertz, E. – Hebert, J. R. – Landon, J. (1994): Social and environmental factors and life expectancy, infant mortality and maternal mortality rates. Results of a cross-national comparison. Social Science &
Medicine, 39(1): 105-114.
Holden, W. N. – Jacobsen, D. J. (2009): Ecclesial opposition to nonferrous mining in Guatemala: neoliberalism meets the church of the poor in a shattered society. Canadian Geographer / Le Géographe canadien, 53(2): 145-164.
Holmberg, S. – Rothstein, B. – Nasiritousi, N. (2009): Quality of Government: What You Get. Annual Review of Political Science, 12: 135-161.
Jorgenson, A. K. (2003): Consumption and Environmental Degradation: A Cross-National Analysis of the Ecological Footprint. Social Problems, 50(3): 374-394.
Jorgenson, A. K. (2004a): Global Inequality, Water Pollution, and Infant Mortality. The Social Science Journal, 41(2): 279-288.
Jorgenson, A. K. (2004b): Uneven Processes and Environmental Degradation in the World-Economy. Human Ecology Review 11(2): 103-117.
Kohler, G. – Tausch, A. (2001): Global Keynesianism: unequal exchange and global exploitation. Huntington:
NY: Nova Science Publishers.
Kohr, L. (1957): The breakdown of nations. New York: Rinehart
La Porta, R. – Lopez de Silanes, F. – Shlejfer A. (1999): The quality of government. Journal of Law, Economics and Organization, 15(1): 222-279.
Laver, M. – Shepsle, K. A. (1999): Understanding Government Survival: Empirical Exploration or Analytical Models? British Journal of Political Science, 29(2): 395-401.
Levine, R. E. – Renelt, D. (1992): Sensitivity Analysis of Cross-Country Growth Regressions. The American Economic Review, 82(4): 942-963.
Martin, P. – Straubhaar, T. (2002): Best practices to reduce migration pressures. International Migration, 40(3):
5-23.
Massey, D. S. et al. (1993): Theories of International Migration: A Review and Appraisal. Population and Development Review, 19(3): 431-466.
Matt, A. (2010): Good Government Means Different Things in Different Countries. Governance, 23(1): 7-35.
Meadows, D. H. (1992): Smart development, not dumb growth. Technology Review, 95(6): 68-89.
Molle, W. – Boeckhout, S. (1995): Economic disparity under conditions of integration. A long term view of the European case. Papers in Regional Science, 74(2): 105-123.
Ng, Y. -K. (2008a): Environmentally responsible happy nation index: Towards an internationally acceptable national success indicator. Social Indicators Research, (85)3: 425-446.
Ng, Y. -K. (2008b): Happiness studies: Ways to improve comparability and some public policy implications.
Economic Record, 84: 253-266.
Oswald, A. J. (1997): Happiness and economic performance. Economic Journal, 107(445): 1815-1831.
Poe, S. C. – Tate, C. N. (1994): Repression of Human Rights to Personal Integrity in the 1980s. A Global Analysis. American Political Science Review, 88(4): 853-872.
Ram, R. (1986): Government Size and Economic Growth. A New Framework and Some Evidence from Cross- Section and Time-Series Data. American Economic Review, 76(1): 191-203.
Ram, R. (1997): Tropics and development: an empirical investigation. World Development, 25(9): 1443-1452.
Rodrik, D. (2006): Goodbye Washington Consensus, Hello Washington Confusion? A Review of the World Bank's Economic Growth in the 1990s: Learning from a Decade of Reform. Journal of Economic Literature, 44: 973-987.
Rodrik, D. – Subramanian, A. – Trebbi, F. (2004): Institutions rule: The primacy of institutions over geography and integration in economic development. Journal of Economic Growth, 9(2): 131-165.
Rondinelli, D. A. (1987): Export processing zones and economic development in Asia. American Journal of Economics and Sociology, 46(1): 89-105.
Sala-i-Martin X. – Doppelhofer, G. – Miller, R. I. (2004): Determinants of Long-Term Growth: A Bayesian Averaging of Classical Estimates (BACE) Approach. American Economic Review, 94(4): 813-835.
Sala-i-Martin, X. (1997): I Just Ran Two Million Regressions The American Economic Review, 87(2): 178-183.
Sanderson, M. (2010): International Migration and Human Development in Destination Countries: A Cross- National Analysis of Less-Developed Countries, 1970-2005. Social Indicators Research, 96(1): 59-83.
Scanlan, S. (2004): Women, Food Security, and Development in Less-Industrialized Societies: Contributions and Challenges for the New Century. World Development, 32(11): 1807-1829.
Schumacher, E. F. (1973a): Small is beautiful; economics as if people mattered. New York: Harper & Row.
Schumacher, E. F. (1973b): Western Europe's Energy Crisis: A Problem of Life-Styles. Ambio, 2(6): 228-232.
Sénécal C. – Hamel P. J. (2001): Ville compacte et qualité de vie: discussions autour de l'approche canadienne des indicateurs de durabilité. Canadian Geographer / Le Géographe canadien, 45(2): 306–318.
Stern, D. I. (2004): The rise and fall of the environmental Kuznets curve. World Development, 32(8): 1419-1439.
Stevenson, B. – Wolfers, J. (2008): Economic Growth and Subjective Well-Being: Reassessing the Easterlin Paradox. IZA Discussion Paper Series No. 3654.
Sylwester, K. (2000): Income inequality, education expenditures, and growth. Journal of Development Economics, 63(2): 379-398.
Tausch, A. (2011a): 41 Indicators of Development. Available electronically from Hichem Karoui Papers, Paris, http://www.hichemkaroui.com/?p=2017
Tausch , A. (2011b): Dataset for ‘Globalization, the human condition and sustainable development in the 21st Century. Social Sciences and Humanities 1(2), available electronically from Hichem Karoui Papers, Paris,http://www.hichemkaroui.com/?p=2383 .
Taylor, J. E. (1999): The new economics of labour migration and the role of remittances in the migration process. International Migration, 37(1): 63-88.
Taylor, J. E. (2006): International Migration and Economic Development. UN International Symposium On International Migration And Development, Turin, Italy, 28-30 June 2006.
UNDP (2009): United Nations Human Development Report. New York and Oxford: Oxford University Press.
Veenhoven, R. (1996): Happy Life-expectancy. A comprehensive measure of quality-of-life in nations. Social Indicators Research, (39): 1-58.
Weede, E. (1980): Beyond Misspecification in Sociological Analyses of Income Inequality. American Sociological Review, 45: 497-501.
Weede, E. (1981): Dependency Theories and Economic Growth: A Cross-National Study. Koelner Zeitschrift fur Soziologie und Sozialpsychologie, 33(4): 690-707.
Weede, E. (1983): Military Participation Ratio. Human Capital Formation and Economic Growth: A Cross- National Analysis. Journal of Political and Military Sociology, 11: 11-29.
Weede, E. – Kampf, S. (2002): The impact of intelligence and institutional improvements on economic growth.
Kyklos, 55(3): 361-380.
Williamson, J. A. (2002): Is Protection Bad for Growth? Will Globalization Last? Looking for Answers in History. Presented at the 13th IEHA Congress, Buenos Aires, August 22-26, 2002
World Bank (2005): Economic Growth in the 1990s: Learning from a Decade of Reform. Washington, DC.:
World Bank.
York, R. – Rosa, E. A. – Dietz, T. (2003): Footprints on the earth: The environmental consequences of modernity. American Sociological Review, 68(2): 279-300.
Ziesemer, T. H. W. (2009): Worker Remittances and Growth: The Physical and Human Capital Channels.
Jahrbuecher fuer Nationaloekonomie und Statistik, 229(6): 743-773.
Appendix Table 1. Global development – combining 26 indicators
Based on international standard data, available from http://www.hichemkaroui.com/?p=2017, column AC and AD in EXCEL Table 1. Interested readers are referred to the extensive data codebook with all variable definitions, available in pdf format from this website. As with every index, like the Human Development Index, etc., one might endlessly argue about the components to enter as well as the weighting of the different components. It is important to underline in this context that the index is an attempt to arrive at a reasonable combination of democracy, economic growth, gender equality, human development, research and development, and social cohesion. It is suggested that future research should look into the index construction by using different methodologies, including principal components etc.
• Combined Failed States Index
• Civil and Political Liberties violations
• Corruption avoidance measure
• Democracy measure
• Global tolerance index
• Rule of law
• Crisis Performance Factor
• economic growth IMF prediction growth rate in 2009
• economic growth IMF prediction growth rate in 2010
• economic growth in real terms pc. per annum, 1990-2005
• closing economic gender gap
• closing educational gender gap
• closing health and survivial gender gap
• closing of global gender gap overall score 2009
• closing political gender gap
• gender empowerment index value
• Infant mortality 2005
• female survival probability of surviving to age 65 female
• Human development index (HDI) value 2004
• Life Expectancy (years)
• Life Satisfaction (0-10)
• Country share in top world 500 Universities
• per capita world class universities
• tertiary enrollment
• quintile share income difference between richest and poorest 20%
• unemployment rate