Articles
Sustainability Requires Balanced Economic and Social Development: The Example of the V4 Countries
Magdolna Csath*
* Magdolna Csath, PhD, Professor of Economy, Member of the Hungarian Academy of Sciences, University of Public Services, Hungary, email: mail@magdacsath .t-online .hu, ORCID: https://
orcid .org/0000-0002-1975-1045
Abstract: It has been taken for granted for a long time that the main objective for economies has to be to maintain economic growth . Economic growth, however, especially when measured by gross domestic product (GDP) can be attractive while human and social conditions deteriorate . Globalisation has created global value chains, which are basically about locating activities into countries where they can be performed at the lowest costs . These processes can hold back economies from moving towards a higher level of development . The article examines the economic and social situation in the V4 countries in international context and on a long time horizon, by using the most important economic and social indicators . The main purpose of the analysis is to get an objective overview of the situation, and to suggest solutions to achieve a more harmonious economic and social development, which is the necessary precondition for avoiding middle income trap .
Keywords: social sustainability, GDP, middle income trap, innovation based development, global value chains, human capabilities
1. Introduction
Economic growth measured by GDP is an important indicator of any country’s economic success . It has, however, many limitations, too . The most important one is that GDP is unable to measure those social and human development indicators, which cannot be meas- ured in terms of money . Economies go through different stages of development . First they try to develop the economy by using their physical resources, like land, minerals, geological location and the physical and quantitative advantages of human capital . This development strategy can lead to the so-called middle income development stage . To progress further, however, economic strategies need to be changed . Measuring success by GDP-based growth does not help economies to step further . New thinking is necessary which con- siders human and social sustainability; a long-term thinking that places the qualities of human resources into the centre of economic policy making . Professional arguments warn that no country can be considered to be a developed one, which is not competing on
10.53116/pgaflr.2020.1.1
knowledge, creativity and innovation, but rather considers quantitative aspects to be more important than the qualitative ones . The new thinking therefore should start with recon- sidering economic structures, roles of value chains, education and learning strategies and future orientation .
The V4 countries are in a very important stage of development . Based on all relevant research findings and rankings, Czechia and Slovakia are already in the group of developed countries, while Hungary and Poland are still emerging countries .
This classification is made, however, based on the per capita income level calculated from GDP . Therefore, because of the limitations of the GDP indicator, it cannot be accepted without some doubt that Czechia and Slovakia have already safely avoided the danger of getting stuck in the middle income trap and have reached the stage of being innovation- and knowledge-based economies . The data – as we will see later – only prove that for some indicators they perform better than Hungary and Poland, but for others they do not stand out . Therefore, compared to the really developed knowledge-based countries like Austria or Denmark, the V4 countries together still have a long way to go to achieve a similar developed status . For this purpose they have to change economic development policies and the focus of investment as well . They also have to apply a wider variety of indicators, beyond GDP to measure real progress .
2. Literature overview
This research paper aims at demonstrating the importance of system thinking when evaluat ing performance indicators of different economies . This means going beyond meas- uring economic success by the usual GDP indicator, and considering human and social indicators to better describe sustainability of present economic achievements . This is also the suggested solution for less developed economies which want to avoid to get stuck in the middle income trap . Professional literature sources underline these arguments . Pilling (2018) describes how GDP can be a misleading indicator by pointing out that GDP is a gross number, which is the total sum of everything produced over a given time period . This means that it only measures income, but does not measure real wealth . In this sum, however, all plastic waste, burglar alarms and petrol consumed while cars are stuck in traf- fic are calculated as economic benefits .
The other problem with GDP is that it does not say anything about distributions, as GDP is an aggregate indicator . Regional differences in performance can become the weakest element limiting the chance for sustainable development . It is also a serious weak- ness of GDP that striving for increasing its value may actually lead to crisis situations caused by overproduction, overinvestment and overconsumption, which, as experienced in the years 2006–2008, may lead to financial crisis . To demonstrate the fallacy of relying on the results of GDP measurements, Pilling offers the following example: “If the food or service improves in your local restaurant, GDP will not notice . Ditto, if an airline’s safety record improves . In fact, GDP might prefer a plane crash – so that it can build a new plane .” (Pilling, 2018, p . 4)
Kapoor and Debroy (2019) warn that focusing on GDP to measure development ignores all the negative externalities of economic growth, including climate change and income inequality . GDP does not measure the quality of life, satisfaction and happiness, which can be decreased by the growing inequality and the deterioration of the natural environment .
Stiglitz, Fitoussi and Durand (2019) argue for emphasising human and social well- being, as this is the way to achieve sustainable development . The authors also call attention to the fact that because of the many deficiencies of the GDP indicator it is very dangerous to connect economic policy programs entirely to the aim of increasing GDP . They suggest assessing nonmonetary costs and benefits of public programs and policies as well .
Basically all comments on the dangers of using GDP as the only and most appropriate measurement of economic success remind us of the fact that in the beginning this indicator was not developed to assess well-being, human development or sustainability . Originally Kuznets1 is named as the inventor of GDP . Kuznets and his colleagues attempted to esti- mate the national income of the USA in 1932 to be able to measure the full extent of the Great Depression . The notion of GDP was further developed later, during the Second World War, by Keynes .2 Both authors, however, warned against using it as a type of any welfare measurement .
One of the latest arguments on GDP being a flawed metric comes from Hoekstra3 (2019) who states that GDP is fine if one wants to measure economic activity, but totally inadequate for measuring societal progress . He actually formed a “beyond – GDP”
community, in order to suggest better indexes for measuring economic success from a development point of view .
There are also various suggestions about how to measure sustainability and social progress . A very general definition for social sustainability suggests that it is a process of creating sustainable and successful places that promote wellbeing . From a business perspec- tive it is about understanding the impacts of corporations on people and society . (Adec Innovations, 2020)
Nair (2018) explains the origin of sustainability by saying that this idea grew out of the environmental movements in the 1960s and 1970s . But later the arguments have been extended to cover human and social sustainability issues as well .
Because of the complexity of sustainability – in the author’s opinion – governments have to take active role in securing the conditions of sustainable development .
Harris et al . (2001) refer to sustainability as intergenerational equity, ensuring that future generations have an inheritance of natural, social, manufactured and human capital at least equal to that of the present generation . He also points out that from the point of view of neoclassical economic theory sustainability can be defined in terms of maximisa- tion of human welfare over time .
1 Simon Kuznets (1901–1985), American economist and statistician. He prepared an assessment of the national income of the USA for the period 1929–1932.
2 John Maynard Keynes (1883–1946) further developed the concept and methodology of calculating GDP in his book:
Keynes (1936).
3 Rotger Hoekstra is an environmental economist, expert in well-being and sustainability metrics and policies.
Alibasic (2018) points to the important relationship between sustainability and resil- ience, therefore he suggests an integrated approach to sustainability and resilience planning at national as well as local level .
According to Sen4 (1999, 2000), social sustainability is one of the three pillars of sustainability, alongside economic and environmental . In his view social sustainability has six dimensions: diversity, equity, quality of life, maturity, democracy and governance, and social cohesion . He also argues for a shift in focus from incomes to outcomes, so from per capita income growth input to improved quality of life outcome .
Some authors are searching for a compromise between growth and sustainability . Bascom (2016) stresses that sustainability and economic growth can be in harmony when growth is based on education, innovation, social cohesion, and does not harm human health and the environment .
Dile (2017) argues that sustainability and economic development should not be mutually exclusive . A cleverly planned business investment can achieve economic gains while supporting sustainability . He also stresses that sustainability does not relate only to the natural environment . It is also about quality of life, good quality jobs and geographi- cally balanced development .
Mazzucato (2018) is more concrete: she relates growth to sustainability by pointing out that growth only supports sustainability if it is smart (based on investments into inno- vation), sustainable (i .e . greener), and more inclusive (so that it does not produce inequali- ties) . Mazzucato already touches upon the importance of economic structure . This subject is more deeply analysed in the professional studies on middle income trap .
Kanchooschat (2015) defines middle income trap the following way: it is the situa- tion in which a country fails to grow further into a high-income level despite attaining middle income status for a certain period of time . Among the reasons, he puts great emphasis on the failure of modernising the economic structure . Without creating an economic structure which is able to produce and export products and services with high proportion of local innovation and value creation, it is impossible to move to a high income status . In economic terms this means that if the competitive advantage of an economy is its cheap labour and subsidies offered to investors creating assembly type jobs, then this country will get stuck in a middle-income trap situation .
Other authors try to find more concrete reasons why countries get stuck in the middle income trap . For example, Mendez-Parra (2016) lists the following two typical reasons why some countries became stuck in middle income trap:
Ƿ Many countries successfully achieve middle income status by using subsidies based industrial policy to attract foreign investments, but then later strong industrial interest groups may attempt to block policy reforms to achieve transformation to innovation based economy, because they want to keep their subsidies and protection .
4 Amartya Sen (1933–), Nobel Laureate in economic sciences, Indian economist and philosopher.
The transition process, as the author emphasises, requires considerable state investments into education and innovation . Especially the quality of science and mathematics education has to be improved . In order to avoid middle income trap, a technological development is also needed which helps to close the technology gap of an economy . According to Milberg and Houston (2005), technology gap is the difference between the technological level and innovativeness of a country, and that in a technologically leading country . The gap is reflected in R&D expenditures, the number of engineers and scientists employed, and consequently in the level of productivity .
High road development – as Huggins and Thomson (2017) stress – has to mean high wages, too . Aiginger and Böheim (2015) offer similar arguments . They also point to the fact that avoiding middle income trap needs abandoning price competitiveness and choosing a so-called high road strategy, based on research, skills, ecological ambitions, empowering employment policy and excellent institutions . High road policies therefore can support economic growth while also caring about human, social and environmental sustainability .
Summarising the conclusions which can be drawn from the literature, it is evident that sustainability is also related to the level of economic development a country can achieve . Innovation, knowledge and skills, as well as good quality jobs are important preconditions of sustainable development, which provide the necessary resources and capabilities to avoid a middle income trap situation, and to move towards a high income status .
3. The present research
This article intends to prove that economic growth, even if it is very attractive is not suffi- cient for sustainable development . Sustainable development has a long term view compared to the short term concept of measuring growth with GDP, an indicator that professionals demonstrated not to be a satisfactory one .
The article selected the V4 countries to demonstrate this supposition . A wide range of statistical data have been searched for this reason, and different statistical methods and illustrations have been used to prove the arguments about how economic growth could better serve human and social sustainability goals . The arguments are strengthened by analysing the V4 countries in an international context and making statistical comparisons between indicators of some better developed countries and those of the V4 countries .
In the conclusion, comparative tables support the suggestion related to how V4 coun- tries should better harmonise economic growth and social development .
4. The economic growth achievements of the V4 countries
In recent years, the V4 countries have experienced an exceptional rate of economic growth . Table 1 indicates that the growth rate was the highest in the latest years in Poland and Hungary .
Table 1 .
GDP growth in the V4 countries (2015–2019, %)
Country 2015 2016 2017 2018 20195
Czechia 5 .3 2 .5 4 .4 2 .8 2 .5
Slovakia 4 .8 2 .1 3 .0 4 .0 2 .3
Poland 3 .8 3 .1 4 .9 5 .1 4 .0
Hungary 3 .8 2 .2 4 .3 5 .1 4 .0
First position Czechia Poland Poland Poland
Hungary Poland Hungary
Last position Poland
Hungary Slovakia Slovakia Czechia Slovakia
Source: Eurostat However, if we consider economic convergence measured by the GDP per capita (in PPS) as a percentage of the EU average, we learn that in the case of Hungary and Poland in 2018, 14 years after joining the EU the convergence indicator is only 71% (Figure 1) . This number is 56% less than the Austrian value, and 53% less than the German one .
135 125 115 105 95 85 75 65
Austria
Denmark Germany
Sweden Finland
Czechia Slovakia
Poland Hungary
128 127 124 122
111
91
78 71 71
EU27=100
Figure 1 .
GDP per capita in PPS (2018) (EU27 = 100)
Source: Eurostat
5 The 2019 values are forecasts.
Within the V4 countries the Czech economic convergence is the strongest, although it is partially explained by the start from a higher value . This data indicate that convergence, in spite of the strong growth values, is not improving fast enough in the other countries .
From the point of view of the population, purchasing power adjusted GDP per capita indicator is especially important, because it measures material well-being . Figure 2 indi- cates how far the V4 countries are from the developed countries in the light of this indicator . We will explore reasons for these data later . We can, however, suppose an impor- tant reason right away: the lower wage levels .
+34.5 +36.8 +32.0 +42.7 +27.9 +37.9 +58.6 +52.1 +73.5 +88.6
0 5000 10000 15000 20000 25000 30000 35000 40000 45000
euro
2005 2018
Figure 2 .
Purchasing power adjusted GDP per capita, and its growth from 2005 to 2018
Source: Eurostat The highest income growth has happened in Poland (88 .6%) within the V4 countries, but it was only sufficient for a convergence of 71% in 2018 . The GDP per capita value in the presented developed countries are much higher than in the V4 countries . The lowest level and growth rate is in Hungary .
These data show nationwide values; therefore, they may hide regional differences, which are important signs of regional development . A regionally balanced economy is more resilient, and better prepared for avoiding unexpected crisis situations . It can also better serve local human and social development objectives . The two typical indicators which measure regional disparities are the GDP per capita and the GDP per person employed . The latter one is also one of the productivity indicators . In accordance to the
latest, 5 March 2020 Eurostat news release, regional GDP per capita ranged from 30% to 263% of the EU average in the EU in 2018 . There are considerable differences among the V4 countries, too .
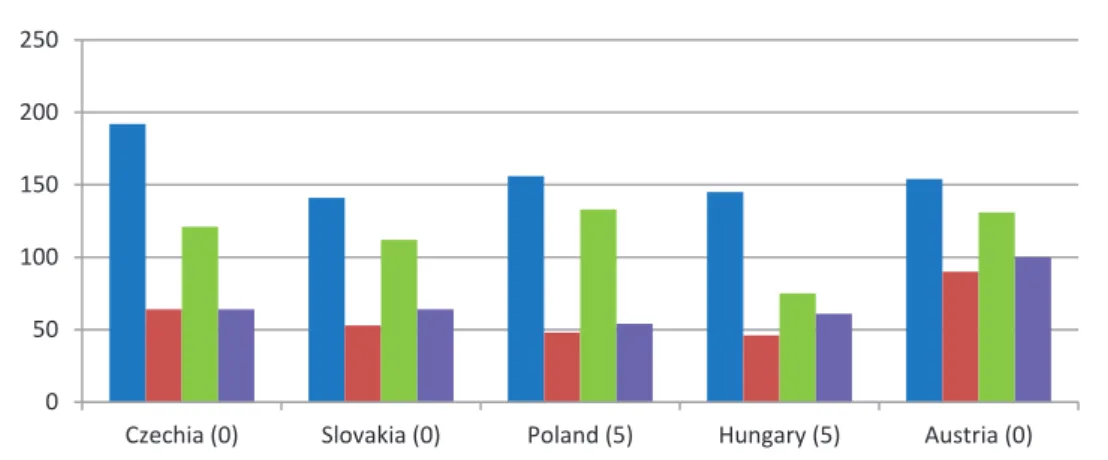
Figure 3 demonstrates the largest and smallest value for the GDP per capita and the GDP per person employed indicators in the V4 countries and Austria . Austria is selected because of its strong economic ties with the V4 countries, and also because of its geographic proximity . The freshest data for EU27 are presented .
0 50 100 150 200 250
Czechia (0) Slovakia (0) Poland (5) Hungary (5) Austria (0)
The largest GDP per capita value (PPS) The smallest GDP per capita value (PPS) The largest GDP person employed value (PPS) The smallest GDP per person employed value (PPS)
In brackets: number of regions with less than 60 percentage GDP per capita (EU27 = 100)
Figure 3 .
Regional GDP indicators (EU27 = 100, 2018)
Source: Eurostat What can we learn from the values? GDP per capita is a general indicator measuring new value added . GDP per person employed, on the other hand, illustrates the new value creation by the employees . However new value creation depends not only on the employees, but much more on the technological and managerial sophistication, as well as the knowledge intensity of businesses operating in an economy . The quality of jobs is also a determining factor of productivity . Large regional differences in the GDP per capita indicator demonstrate larger disparities in regional development levels . Lower productivity levels may be an indicator of lower innovativeness and knowledge creating capability of the entire economy . In Hungary, the regional differences are large, but productivity differences are minimal . This suggest a lagging productivity level in the entire economy . On the other hand, in Poland the regional GDP per capita indicator differs almost with the same ratio
than in Hungary (3 .25, 3 .15), but productivity disparities are large, suggesting an economic structure with higher and lower value added sectors in the different regions . Austria, on the other hand, demonstrates a well- balanced and harmonious economic structure from the perspective of GDP per capita, as well as GDP per person employed (ratios: 1 .7, 1 .3)
Finally, the number of regions with lower than 60% GDP per capita as percentage of EU average is another important warning sign of large regional disparities .
Table 2 .
Number of NUTS 2 regions and regions with GDP per capita below 60% (EU27 = 100) Country The number of NUTS 2 regions Regions with GDP per capita below 60%
(EU = 100)
Czechia 8 0
Slovakia 4 0
Poland 17 5 (30%)
Hungary 8 5 (63%)
Austria 9 0
Source: Eurostat It is especially worth mentioning that in Hungary, where the general GDP growth has been one of the highest in the recent years within the V4 countries, regional disparities are the largest, as 63% of all the NUTS 2 regions have only achieved a less than 60%
convergence to the EU average .
Based on the numbers we can conclude that regional differences are generally higher in the V4 countries than in Austria . Within the V4 countries, the largest regional dispari- ties occur in Hungary and Poland . One reason for Poland can obviously be the size of the country . In the case of Hungary another worrying sign is the generally very low GDP per person employed productivity indicator, which may point to the lower level of technolo- gical, innovative and managerial sophistication, and the large proportion of low quality, poorly paid jobs .
Concluding this economic introduction we face the question: why are the key macro data measuring economic achievements so contradictory in the V4 countries? What reasons may explain the slower than expected convergence, and the lower level living standard measured by the GDP per capita indicator? We try to answer these questions in the following sections . Obviously we have to start by analysing economic structures which may be responsible for some of the economic weaknesses of the V4 countries .
5. Economic structure and types of jobs in the V4 countries
Innovative enterprises are the sources of competitiveness of any economy . They create knowledge-based, high value-added and well paid jobs . It is therefore a very important indicator of what percentage of the enterprises are innovative in an economy . Innovativeness means several things for businesses . An innovative enterprise can continuously come up
with new product ideas, or develop new processes and search for new markets . Innovation is also more than product, process and market innovation . Enterprises have to learn con- tinuously, renewing their organisational, management and marketing systems, which is also innovation .
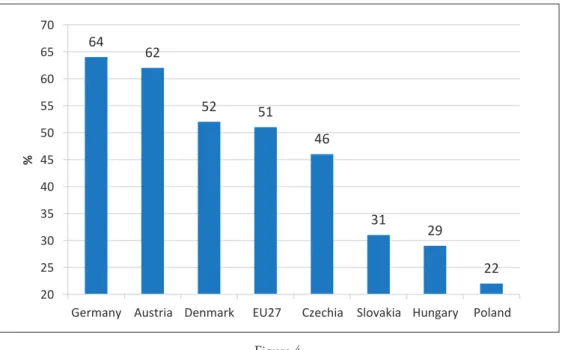
Figure 4 illustrates the percentage of enterprises performing any type of innovation in the observed time period .
The numbers for three of the V4 countries are very low . This presumes at the same time a lower proportion of good quality and well paid jobs, less options for human devel- opment based on demanding and challenging jobs .
64 62
52 51
46
31 29
22 20
25 30 35 40 45 50 55 60 65 70
Germany Austria Denmark EU27 Czechia Slovakia Hungary Poland
%
Figure 4 .
The proportion of innovative enterprises (all enterprises = 100) (2016, %)
Source: Eurostat As indicated on Figure 4, the proportion of innovative enterprises is much higher in the developed countries . Within the V4 countries the Czech value is the highest . As mentioned earlier, the V4 countries are homes of operations companies (mostly assembly-type ones) from developed EU countries . Their share of value added – as seen on Figure 5 – is especially high in Hungary and Slovakia, but they do not seem to contribute to increasing the proportion of innovative enterprises . This is demonstrated on Figure 6, which shows two extremely important innovativeness-related indicators .
51.4 48.1
43.3
36.8
27.8 26.5
24.8 23.2
21.5 20
25 30 35 40 45 50 55
%
Figure 5 .
Share of value added by foreign-controlled enterprises in the non-financial business economy (2016, %) Source: Eurostat
0 2 4 6 8 10 12 14 16
Czechia Slovakia Poland Hungary Austria Germany Denmark
%
R&D/VA % R&D/employment per total % Figure 6 .
R&D expenditure as percentage of value added, and R&D employment as percentage of the total persons employed in foreign controlled enterprises (2017, %)
Source: Eurostat
The data show that foreign-controlled businesses spend very small proportion of their local value added on R&D, and among all the persons they employ, R&D employment is minimal compared to – for example – the Danish, German or Austrian values .
This is an indication that these companies basically operate low-value added, assembly operations in these countries, while in the presented developed EU countries innovation related jobs are more typical . Because of their large share in the V4 countries’ economy this situation can actually create difficulties for these countries if they want to move to a more knowledge-based economic structure . The types of jobs available in an economy are also signs of economic development .
The employment by professional status and occupation demonstrates the quality of available jobs, which also reflects wage levels . Obviously, managers and professionals have higher salaries than plant and machine operators and assemblers, or people working in so-called elementary occupations . On the other hand, types of occupations also describe the knowledge structure of an economy .
If the proportion of, for instance, plant and machine operators and assemblers is too high, that indicates a large proportion of assembly type jobs . It is also important to see the knowledge capability of the economy, which can be characterised by the proportion of professional jobs . A longer time horizon in turn demonstrates changes in the economic and knowledge structures . If an economy wants to avoid the so-called middle income trap, it has to decrease the proportion of assembly and elementary jobs, and increase the knowledge-based jobs .
0 5 10 15 20 25 30 35
2005 2010 2018
Figure 7 .
Employment in professional occupation in 2005, 2010, 2018 in the 15–64 age range (%) Source: Eurostat
This is especially important for the younger generation, as otherwise it tends to emigrate to countries where the higher quality jobs with the associated higher salaries are more easily available . On Figures 7, 8 and 9 we can observe6 the proportion of professional, plant and machine operator and assembler, as well as the elementary type of jobs in the 15–64 years old age range, in three years, in the V4 countries and in 5 developed economies . Figure 10 shows the same proportions for all professional status for the 15–39 years old age range in 2018 in the same countries . Beyond the V4 countries five developed, competitive countries are selected for comparison .
0 2 4 6 8 10 12 14 16 18
2005 2010 2018
Figure 8 .
Employment of plant and machine operators and assemblers in 2005, 2010, 2018 in the 15–64 age range (%)
Source: Eurostat
6 The types of jobs are classified in accordance to ISCO 08. (International Standard Classification of Occupation 2008, ILO.)
0 2 4 6 8 10 12
2005 2010 2018
Figure 9 .
Employment in elementary occupations in 2005, 2010, 2018 in the 15–64 age range (%) Source: Eurostat
0 5 10 15 20 25 30
%
Professional
Plant and machine operators and assemblers Elementary occupa�ons
Figure 10 .
Employment by different professional status and occupation in the 15–39 age range in 2018 (%) Source: Eurostat
From Figure 7 we can conclude that in all years the proportion of professionals are much higher in the 15–64 age group in the more developed countries, with the exception of Poland (19 .8%) . In the case of Slovakia and Hungary, the proportion is much lower than the EU average . The three most competitive countries, Denmark, Finland and Sweden have the highest proportion of professionals in this age group . Germany is a surprising exception with its lower than EU average value . In the younger (15–39) age group – with the exception of Poland again – the V4 countries perform poorly in comparison with the three most competitive countries, and even compared to the EU average . The lowest proportion can be found again in Slovakia and Hungary . It is also worth checking the tendencies from 2005 to 2018 . The largest increase in the proportion of professionals can be experienced in Austria, and the lowest in Slovakia . The second lowest increase has happened in Hungary .
As far as the proportion of plant and machine operators and assemblers is concerned, the differences between the V4 and the developed countries are striking in both age groups . The highest proportion in the 15–64 age group in 2018 can be found in Hungary (15%), the lowest in Austria (5 .7%) and Denmark (5 .2%) . The Danish value is only 35% of the Hungarian one . In the case of the 15–39 age group Slovakia is leading with 14 .8% . The lowest value is again in Denmark (3 .5%) . This value is only 24% of the Slovak one . Considering changes from 2005 to 2018 in the 15–64 age group in Poland and Hungary, the proportion of plant and machine operations and assemblers has increased, and in Czechia it has decreased . All the developed countries have significantly decreased employ- ment in this category .
The proportion of those working in elementary occupations in the 15–64 age group has decreased in all countries, with the exception of Hungary . In Germany, the number is unchanged . Surprisingly, the differences among the countries are not so high for this occu- pation . However, within the V4 countries the Hungarian value is the highest (9 .8%), and only the Hungarian value has increased since 2005 . In the younger, 15–39 age group the Danish value is the smallest (1 .3%) and the Hungarian one is the highest . Finally, let us have a look at a special form of employment, the precarious form . This is a form of employ- ment in which employees have a short term work contract, most of the time about 3 months . This situation means uncertainty and insecurity for the employees with almost no chance of moving up to a quality job .
Figure 11 indicates that in both the total economy, and the industry and construction sectors in the V4 countries – with the exception of Czechia – these types of jobs are overrepresented .
In conclusion, we can make the following observations based the analysed data:
Ƿ in the V4 countries the so-called “blue collar”, assembly and low skilled employ- ment is proportionally large .
Ƿ Poland performs the best regarding professional employment . This may be one explanation for the highest GDP per person employed productivity for Poland in the percentage of the EU27 average (Figure 3) . In spite of this, Poland is also the home of the region with the lowest level for this indicator, too (54%) . The propor- tion of plant and machine operators and assemblers is also quite high in Poland (10 .3%), although lower than in the other V4 countries .
Ƿ it is an especially worrying sign that even within the younger generation age group (15–39 years) the proportion of plant and machine operators’ and assemblers’
employment is very high, and the proportion of professional occupation is – with the exception of Poland – very low in the V4 countries .
These numbers mirror a less developed economic structure dominated by foreign assembly operations . This fact– especially in the case of Slovakia and Hungary – is a warning sign of the danger of getting stuck in a “low-road” cost-competitiveness strategy which inhibits them from moving to a “high-road” knowledge-based competitiveness position .
0 0,5 1 1,5 2 2,5 3 3,5 4
Poland EU27 Hungary Slovakia Austria Czechia
%
Industry and construc�on Total economy Figure 11 .
Precarious employment for the 15–64 age group in the industry and construction sectors and in the total economy 2018 (%)
Source: Eurostat
6. The role of government expenditure structure in economic development
Governments can enhance economic competitiveness by strengthening the knowledge sector . The structure of government expenditure is a good indicator of priorities of govern- ment economic policies . The latest data on government expenditure by function were published by the Eurostat on February 21, 2020 . The spending priorities of the V4 countries and three selected developed countries are compared in Table 3, 4, 5 . Table 3 demonstrates government expenditures related to public debt transactions, economic affairs, and different areas of defence as percentage of the total public expenditure .
The V4 countries all spend much more than the three analysed developed countries and the EU27 average on “economic affairs”, which is probably related to the stimulation of the economy in order to achieve higher growth .
Table 3 .
Government expenditures on economic affairs and defence as percentage of total public expenditure (2018, %)
Country Public debt
transactions Economic
affairs Police
services Prisons In sum Public expenditure as % of GDP
Czechia 2 .0 14 .8 2 .4 0 .5 19 .7 40 .7
Slovakia 3 .5 13 .2 2 .5 0 .5 19 .7 41 .8
Poland 3 .6 12 .1 2 .6 0 .6 18 .9 41 .6
Hungary 5 .3 16 .4 3 .0 0 .4 25 .1 46 .7
Austria 3 .6 12 .0 1 .4 0 .3 17 .3 48 .6
Denmark 2 .2 6 .5 1 .1 0 .3 10 .1 50 .9
Germany 2 .3 7 .6 1 .7 0 .2 11 .8 44 .6
EU27 4 .0 9 .4 1 .9 0 .3 15 .6 46 .7
Source: Eurostat For Hungary it is a special weakness that because of the much higher debt (compared to the GDP level) than in the other V4 countries it has to spend much more on debt services . It is also surprising that the V4 countries spend more on police services and prisons than the other countries .
In Table 4, government expenditures differentiated by function are portrayed as percentage of GDP . Hungary and Czechia spend the least on social protection . In the case of Czechia, the reason may be – as will be shown by the different human development indicators – the more developed, balanced and inclusive society . For Hungary it is a government policy that everybody who is able to work has to work, if not elsewhere then at least in the public work scheme system . This is one explanation for the less resources spent on social protection .
Table 4 .
Government expenditure by function (EU27, 2018, % of GDP) Country Social
protection Health Education Economic
Affairs Recreation, culture, religion
EU average 19 .2 7 .0 4 .6 4 .4 1 .1
Czechia 12 .0 7 .6 4 .6 6 .0 1 .5
Slovakia 14 .3 7 .3 4 .0 5 .5 1 .1
Poland 16 .2 4 .8 5 .0 5 .0 1 .3
Hungary 13 .3 4 .7 5 .1 7 .7 3 .2
Austria 20 .1 8 .2 4 .8 5 .9 1 .2
Denmark 21 .9 8 .3 6 .4 3 .3 1 .6
Germany 19 .4 7 .2 4 .2 3 .4 1 .1
Source: Eurostat
It is also surprising that Poland and Hungary spend the least on health, however, Hungary spends generously on recreation (sport), culture and religion .
Education is financed the most heavily in Denmark . In term of economic affairs – as observed earlier – the V4 countries (especially Hungary) are in the front .
Finally let us examine the human development related government expenditures in the percentage of total public expenditure . The values of these indicators are probably the most important if a country cares not only about the economic growth measured by GDP, but also about human development and social aspects in the society .
Table 5 .
Government expenditure directly related to human development, as percentage of total public expenditure (2018, %) Country Health Family and children Old age Pre-primary and
primary education
Protection of
biodiversity In sum
Czechia 18 .7 2 .7 18 .1 2 .7 0 .6 42 .8
Slovakia 17 .5 2 .5 18 .4 2 .6 0 .1 41 .1
Poland 11 .6 6 .1 22 .1 5 .1 0 .0 44 .9
Hungary 10 .1 3 .6 14 .3 2 .7 0 .1 30 .8
Austria 16 .8 4 .3 25 .5 3 .0 0 .0 49 .6
Denmark 16 .3 8 .5 16 .2 5 .7 0 .4 47 .1
Germany 16 .2 3 .8 21 .2 2 .9 0 .1 44 .2
EU27 15 .0 3 .7 22 .3 3 .4 0 .2 44 .6
Source: Eurostat In Table 5 we can observe that health related expenditures as percentage of total public expenditure are the lowest in Hungary and Poland . Denmark and Germany are the leaders . Poland and Denmark spend the most on family and children, and Slovakia the least . Old age population is supported the most in Austria, and the least in Hungary . Children are the future not only for the economy, but also for the society as a community . This is mostly emphasised in Denmark and Poland . Finally, biodiversity as an important feature of quality of life is the most emphasised factor in Czechia and Denmark .
Summing up the conclusions, the V4 countries spend the most on economic affairs in percentage of GDP and that of the total public expenditure . This may be a reason for the excellent GDP growth numbers . On the other hand, human and social type of public expenditures, although they are at different levels in different countries, are not as high as in the case of the presented developed countries . Economic growth is, of course, important, but cannot be more important than human and social development . First of all because human and economic development, on the longer run, are the preconditions of competi- tiveness . Secondly, economic growth is morally acceptable only if the results of it are mirrored in the entire society .
7. The way to competitiveness: investment in human capabilities
In the previous section we analysed public expenditure by function as percentage of GDP, and that of total public expenditure . We have concluded that the most emphasised field in the V4 countries is spending on economic affairs . Let us go into more detail now, and compare health and R&D expenditures of the V4 countries with those of three developed countries . These areas are very important for human and social sustainability, as well as economic competitiveness . We can also contrast human and knowledge investments with the strength of human capital as a partial indicator of human and knowledge investments .
In Figure 12, R&D expenditure can be seen in euro per capita and as percentage of GDP .
1.95% 2.22%
2.2%
1.41%
1.2%
1.16%
0.8% 0.45%
0 200 400 600 800 1000 1200
euro/capita
Figure 12 .
R&D expenditure (euro per capita, percentage of GDP, 2018)
Source: Eurostat As we can see, the GDP related numbers of the V4 countries are very much far away from those of the analysed developed countries . If we also check the absolute numbers, we experience even larger differences . Austria spends 13 times more euro on R&D for one inhabitant than Slovakia . Denmark spends close to 10 times more than Poland .
It is obvious that with such a low level of R&D investment, as knowledge investment, it is almost impossible for these countries to move to a knowledge-based economic struc- ture and competitiveness .
As Table 6 shows, public expenditure on education on the other hand is similar within the V4 countries, but lower than in the selected developed countries . Especially the three Scandinavian countries invest a high proportion of GDP into education .
Table 6 .
Government expenditure on education in different years (% of GDP)
Countries 2010 2015 2018
Czechia 5 .1 4 .9 4 .6
Slovakia 4 .5 4 .2 4 .0
Poland 5 .5 5 .3 5 .0
Hungary 5 .5 5 .2 5 .1
Austria 5 .1 4 .9 4 .8
Denmark 7 .1 7 .0 6 .4
Germany 4 .4 4 .2 4 .2
Finland 6 .5 6 .2 5 .5
Sweden 6 .4 6 .4 6 .9
Source: Eurostat It is alarming though that from 2010 to 2018 every country – with the exception of Sweden – has decreased public expenditure on education as percentage of GDP . Of course, in the case of countries with high level of GDP – like Austria, Denmark or Germany – this is not so tragic . But in the case of Hungary, for example, this may have detrimental effect on the future of the society, as well as on the future competitiveness of the economy .
Adult participation in learning is also crucial, especially in times of revolutionary technological changes, like in today’s times . Figure 13 shows that this indicator is also very low in the V4 countries, compared to the four developed countries . The fifth, Germany, is a surprise with lower adult participation in learning than in Czechia .
0 5 10 15 20 25 30 35 40
%
Figure 13 .
Adult participation in learning7 (2019, %)
Source: Eurostat
7 Share of people aged 25 to 64 who stated that they received formal or non-formal education and training in the four weeks preceding the survey (Eurostat).
For the countries with low values for investment into human knowledge it should be an alarming fact that, taking into account the often emphasised argument that knowledge is the currency of the future, then they are not strengthening enough this currency .
8. The strength of human capital
The strength of human capital is a very important element of the knowledge position of a country . It can be measured from different perspectives . In this paper we measure strength first from the perspective of knowledge . Later we focus on some additional social characteristics .
One important indicator which characterises the strength of human capital is the proportion of people with tertiary education . Among them the proportion of the so-called STEM – Science, Technology, Engineering, Mathematics – graduates is outstandingly important .
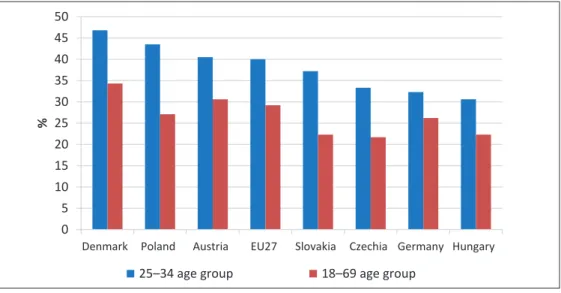
Figure 14 presents the proportion of people with tertiary education in the best employable (25–34 years old) age group and in the active population (18–69 years old age group), for the V4 countries and three developed countries .
0 5 10 15 20 25 30 35 40 45 50
Denmark Poland Austria EU27 Slovakia Czechia Germany Hungary
%
25–34 age group 18–69 age group Figure 14 .
Proportion of people with tertiary education in the 25–34 and 18–69 age range (2018, %) Source: Eurostat Among the V4 countries Poland leads according to both indicators . The best overall results can be observed in Austria and Denmark . The Hungarian value is weak according to both indicators . In the larger age range the Czech and Slovak values are also below the EU average . Surprisingly the German values are also low, they do not stand out at all from the values of the V4 countries .
The proportion of STEM graduates in the 20–29 years old age group per 1,000 inhabitants – as indicated in Figure 15 – is the lowest in Hungary and Slovakia .
0 5 10 15 20 25
Poland Denmark Austria Germany Czechia Slovakia Hungary
number/1000 capita
Figure 15 .
Proportion of STEM graduates in the 20–29 years old age range per 1,000 inhabitants (2017, %) Source: Eurostat Finally let us consider another important human factor, the employment opportunities in high-tech knowledge jobs . It is not easy to judge the situation in this case: whether there are few high-tech jobs available, because the majority of the companies offer jobs mostly at the lowest value-added level of the value chain, or the properly trained people are not available in the necessary numbers, as Figure 14 and 15 may suggest . The most probable answer is that a combination of both options may be valid . Table 7 offers some explanation for the problem .
Table 7 .
Scientists, engineers and high-tech employment Country Scientists and engineers (15–74 ages)
as percentage of total population (2018, %)
Persons employed in science and technology (15–74 years) as percentage
of total population, (2018 %)
EU27 4 .4 21 .1
Czechia 4 .3 21 .6
Slovakia 2 .6 16 .9
Poland 4 .5 19 .7
Hungary 3 .6 18 .0
Austria 6 .1 24 .2
Denmark 6 .9 29 .6
Germany 5 .3 27 .3
Finland 7 .0 27 .5
Sweden 8 .2 32 .3
Source: Eurostat
On Table 7 the first column shows the availability of scientists and engineers . The second one shows the proportion of persons employed in science and technology . Both indicators are measured as percentage of total population . The data are from the V4 countries and five developed countries . First of all it is obvious that the V4 countries do not perform too well according to these two indicators . The percentage of scientists and engineers is the highest in Sweden and Finland, the lowest in Slovakia and Hungary .
In terms of persons employed in science and technology as a percentage of total popu- lation, again, Finland and Sweden are the leaders, and the laggards are Slovakia and Hungary . The data underline the assumption that neither jobs nor people to fill them are available in sufficient proportion to support a knowledge-based competitiveness trajectory .
These statements are supported by the observations of the IMD .8 The IMD Talent Ranking 2019 stresses the importance of human wealth for long term economic and social development . The index is developed based on the analysis of three areas:
Ƿ investment into knowledge and development of human resources;
Ƿ attractiveness of the country with regard to attracting and keeping high skilled, talented people (“appeal”);
Ƿ readiness for the future (skills, science graduates, international experiences etc .) .
0 10 20 30 40 50 60
Talent posi�on
Figure 16 . IMD Talent Ranking 2019
Source: IMD, 2019
8 Institute for Management Development, Lausanne, Switzerland.
Figure 16 pictures the rank of the V4 and 5 developed countries . The lower numbers indicate the better positions .
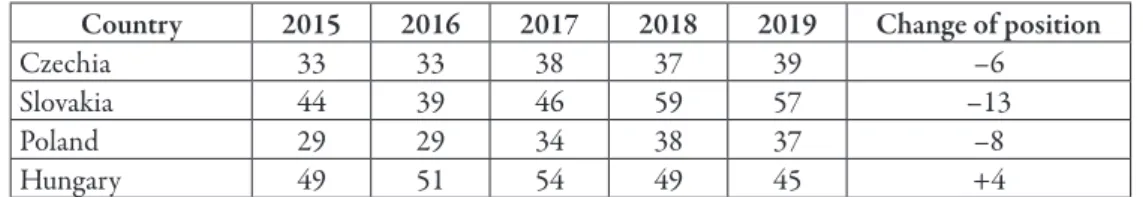
It is probably not surprising that the countries investing more into human capital are in much better position . Among the 63 countries examined by the IMD, Denmark is the second, and Sweden is the third . If we also analyse tendencies in the V4 countries, we can learn that, surprisingly, Czechia, Slovakia and Poland have slipped back . Hungary has improved its position (Table 8) .
Table 8 .
Talent ranking change in the V4 countries
Country 2015 2016 2017 2018 2019 Change of position
Czechia 33 33 38 37 39 –6
Slovakia 44 39 46 59 57 –13
Poland 29 29 34 38 37 –8
Hungary 49 51 54 49 45 +4
Source: IMD, 2019 Hungary’s position is still poor after the improvement: 45th out of the 63 countries .
If we go into even more details we learn that Hungary’s attractiveness for talented people (appeal) is weak (56th position) . On the other hand, all V4 countries are poorly prepared for the future, i .e . they do not invest enough in skills development (readiness) .
Table 9 .
The positions of the V4 countries in the three areas surveyed by IMD (2019)
County General position Investment and development Appeal Readiness
Czechia 39 40 45 39
Slovakia 57 47 54 59
Poland 37 27 46 45
Hungary 45 33 56 57
Source: IMD, 2019 In conclusion we have to reinforce the fact that, although the V4 countries have achieved good economic performance in terms of GDP growth, this has not been achieved through investing enough into human skills . Rather, probably two special reasons have played a greater role: attracting foreign capital and stimulating the economy from EU funds and domestic sources in forms of public investments . As far as contribution of foreign companies to the GDP is concerned, we have to remind the reader that the repatriated profit is also included in the GDP . It is also known that especially when uncertainties are increasing, foreign companies send back home the earned profit in larger proportion . In order for the V4 countries to achieve sustainable development and not only economic growth, investment into people and knowledge should be the focus of national strategy . This would also help increase quality of life, and the level of human development . Let us
now turn to some social indicators of the V4 countries as compared to those of other, more developed countries .
9. International research findings on human development
Human Development Index
The best known human development index is the HDI9 index . It is a composite index based on four indicators, which are life expectancy at birth (years), expected years of schooling (years), mean years of schooling (years) and GNI10 per capita (PPP) . HDI is measured on a scale of 0 to 1 .0, with 1 .0 being the highest possible value . The index was first launched in 1980 . In the last report on HDI, 189 countries were analysed .
Figure 17 shows the rank of the V4 countries and Austria between 2003 and 2019, in five years .
(-3) (5)
(4) (6)
(-8)
10 15 20 25 30 35 40 45 50
2003 2005 2013 2015 2017 2019
Rank
Czechia Slovakia Poland Hungary Austria
Figure 17 .
HDI rank for the V4 countries and Austria in selected years
Source: UNDP, different years Austria is chosen for comparison for its strong economic ties with the V4 countries and its geographic proximity . The Austrian position is the best in every year in spite of the fact that its position has worsened from the 17th to the 20th .
9 Human Development Index, developed and reported by the UN Development Programme (UNDP).
10 GNI: Gross National Income.
With the exception of Hungary, V4 countries have improved their position . While in 2003 Hungary was the second among the V4 countries, by 2019 it slipped back to the last position . This is not a surprise, as all human and knowledge investment indicators of Hungary are among the worst within the V4 countries .
One of the worst indicators of Hungary influencing HDI ranking is life expectancy at birth . Figure 18 proves that life expectancy at birth is the lowest in Hungary every year .
76.1
Czechia 79.1
74.1
Slovakia 77.4 75
Poland 77.7
73
Hungary 76.2 79.5
Austria 81.8
72 74 76 78 80 82
2005 2008 2010 2013 2015 2018
Figure 18 . Life expectancy at birth
Source: Eurostat Although population change is not an element of the HDI index, it is still worth pointing out that population is an important economic resource of any country . Therefore, a strongly shrinking population is a sign of social, as well as economic problem . Table 10 exhibits the changes in the number of population in 5 consecutive years in the V4 countries and Austria .
Table 10 .
Population change over the period of 2015–2019 (January 1) in the V4 countries and Austria
Country 2015 2016 2017 2018 2019 Change:
2019–2015 Czechia 10,538,275 10,553,843 10,578,820 10,610,055 10,649,800 +111,525 Slovakia 5,421,349 5,426,252 5,435,343 5,443,120 5,450,421 +29,072 Poland 38,005,614 37,967,209 37,972,964 37,976,687 37,972,812 –32,802 Hungary 9,855,571 9,830,485 9,797,561 9,778,371 9,772,756 –82,815 Austria 8,584,926 8,700,471 8,772,865 8,822,267 8,858,775 +273,849 Source: Eurostat
Out of the 5 countries analysed, population has increased in three . In Poland and Hungary population has declined . Measured against the population of the country, the decline over the time horizon from 2015 to 2019 in Hungary has been dramatic: 0 .8% . In the case of Poland it is 0 .08% . Decreasing population means decreasing labour force and knowledge basis . It is therefore a process that needs serious attention .
Social Progress Indicator
Another important index is the Social Progress Index, which is the research result of the Social Progress Imperative .11 It has the following vision: “We dream of a world in which people come first . A world where families are safe, healthy and free . Economic develop- ment is important, but strong economies alone do not guarantee strong societies . If people lack the most basic human necessities, the building blocks to improve their quality of life, a healthy environment and the opportunity to reach their full potential, a society is failing regardless what the economic numbers indicate . The Social Progress Index is a new way to define the success of our societies . It is a comprehensive measure of real quality of life, independent of economic indicators . The Social Progress Index is designed to complement, rather than replace, economic measures such as GDP .”
In accordance with this vision, Social Progress Index is calculated based on data collected from three main areas:
Ƿ Basic human needs;
Ƿ Foundations of wellbeing;
Ƿ Opportunities .
In each of the three main areas four indicators are measured:
Table 11 .
Social Progress Index Indicators
Basic Human Needs Foundation of wellbeing opportunities Ƿ Nutrition and basic medical
care Ƿ Access to basic knowledge Ƿ Personal rights
Ƿ Water and sanitation Ƿ Access to information and
communications Ƿ Personal freedom and choice
Ƿ Shelter Ƿ Health and wellness Ƿ Inclusiveness
Ƿ Personal safety Ƿ Environmental quality Ƿ Access to advanced education Source: Social Progress Imperative, 2019 On Figure 19 we can observe a significant difference in social progress among the V4 countries and the analysed developed ones . The lowest values are the better ones!
11 The CEO of the “Social Progress Imperative” is Michael Green.
2 4 5 8
20 24
33 35 39
0 5 10 15 20 25 30 35 40 45
Posi�on (the lowest is the best)
Figure 19 .
Social Progress Index positions 2019 (Number of countries analysed: 149)
Source: Social Progress Imperative, 2019 Hungary is in the worst position and Czechia – close to Austria – in the best within the V4 countries . The leading countries are the three Scandinavian countries, which are among the most competitive ones, too . As far as the V4 countries are concerned, it is not the basic needs which hold them back, but rather the values for the other two indicator groups:
foundation of well-being and opportunities . These indicator groups contain the indicators related to education, health and innovation, analysed earlier .
Life satisfaction
Life satisfaction is a soft indicator, based on survey, but still it may suggest how people feel about the different issues in their country .
The well-being of Europeans is regularly analysed by the Eurostat . The latest report was published on March 12, 2020 . The overall index, for which the best value is 10, is calculated based on objective statistical data, as well as subjective measures of satisfaction . Quality of life is examined in the fields of housing, employment, education, health, safety, governance and the environment . People’s use of time and social relations are also investigated .
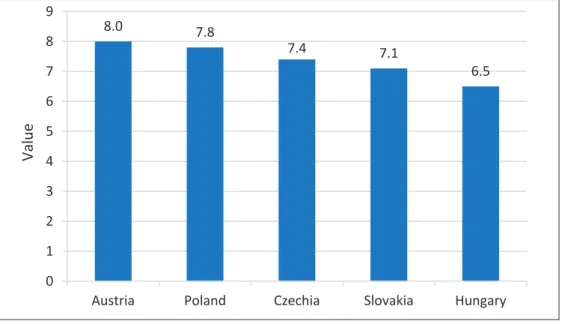
The value of the overall satisfaction index is shown for the V4 countries and Austria on Figure 20 .
8.0 7.8
7.4 7.1
6.5
0 1 2 3 4 5 6 7 8 9
Austria Poland Czechia Slovakia Hungary
Value
Figure 20 . Overall life satisfaction
Source: Eurostat Within the V4 countries, people are the most satisfied in Poland, and the less satisfied in Hungary .
In conclusion we have to focus attention on the serious deficiencies for quite a number of human and social indicators within the V4 countries . Comparing them to those of the most developed countries, the salient differences can be found in the extent of investment into people, knowledge, and consequently, in the strength of human capital . Those countries are obviously the most developed and the most competitive which nurture and care about their human wealth and social conditions the most . Favourable economic growth indicators do not sufficiently monitor the real social achievements of the countries . They have to be supplemented with additional knowledge and social indicators in order to better understand future development trajectories . For the V4 countries it is obvious that if they want to step up to a higher level of development path, they have to invest more into their human resource .
10. Summary and conclusions
Let us summarise now the most important economic, knowledge and social positions of the V4 countries based on the selected indicators .
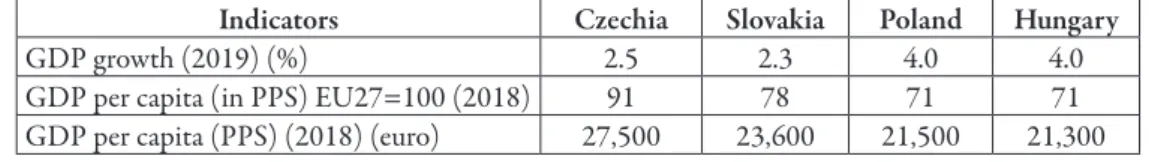
Table 12 shows that from the economic point of view the differences which charac- terise the V4 countries are not extremely large . Poland and Hungary performs well for GDP growth, Czechia, on the other hand, leads for two convergence indicators .
Table 12 .
Positions of the V4 countries according to three economic indicators (based on the latest available data)
Indicators Czechia Slovakia Poland Hungary
GDP growth (2019) (%) 2 .5 2 .3 4 .0 4 .0
GDP per capita (in PPS) EU27=100 (2018) 91 78 71 71
GDP per capita (PPS) (2018) (euro) 27,500 23,600 21,500 21,300 Source: Eurostat Table 13 .
Positions of the V4 countries according to structural indicators in the latest available year Indicators Czechia Slovakia Poland Hungary Best position Percentage of innovative enterprises
(2016) 46 31 22 29 Czechia
Share of value added by foreign
companies (2016) (%) 43 .3 48 .1 36 .8 51 .4 Poland
R&D expenditure in value added in
foreign companies (2017) (%) 3 .4 2 .5 2 .2 2 .2 Czechia
R&D employment in total in foreign
companies (2017) (%) 1 .9 1 .1 1 .8 1 .6 Czechia
Professional employment in 2018
(15–64 years) as % of total economy 16 .0 12 .4 19 .8 15,2 Poland Assembly operators in 2018 (15–64
years) as % of total economy 13 .9 14 .6 10 .3 15 .0 Poland Elementary occupations in 2018
(15–64 years) 5 .3 7 .8 6 .1 9 .8 Czechia
Professional employment in 2018
(15–39 years) as % of total economy 18 14 21 .2 16 .1 Poland Assembly operators in 2018 (15–39
years) as % of total economy 13 .9 14 .8 10 .1 14 .4 Poland
Elementary occupations in 2018
(15–39 years) as % of total economy 4 .8 7 .2 4 .9 9 .6 Czechia Precarious employment in 2018
(15–64 years) as % of total economy 0 .3 1 .4 3 .8 2 .0 Czechia Source: Eurostat Table 13 verifies the fact that the Czech economic structure is probably the healthiest in terms of innovative and knowledge-based employment . Poland comes second, with a high proportion of professional employment and a low percentage of assembly operators . This
may be due to the lowest percentage of foreign controlled enterprises, which typically offer assembly jobs .
Table 14 .
Public investment in people, knowledge and social issues
Indicators Czechia Slovakia Poland Hungary Best position Expenditure on health (as % of
total, 2018) 18 .7 17 .5 11 .6 10 .1 Czechia
Expenditure on family and children
(as % of total, 2018) 2 .7 2 .5 6 .1 3 .6 Poland
Expenditure on old age (as % of
total, 2018) 18 .1 18 .4 22 .1 14 .3 Poland
Expenditure on pre-primary and primary education (as % of total,
2018) 2 .7 2 .6 5 .1 2 .7 Poland
R&D expenditure as % of total,
2018) 1 .2 0 .45 0 .8 1 .16 Czechia
Public expenditure on education as
% of GDP (2018) 4 .6 4 .0 5 .0 5 .1 Hungary
Adult participation in learning
(2019) (%, 25–64 years) 8 .2 3 .6 4 .9 6 .0 Czechia
Source: Eurostat Based on Table 14 we can conclude that in terms of knowledge and social investment Czechia and Poland perform equally well .
Table 15 .
The strength of human capital
Indicators Czechia Slovakia Poland Hungary Best position Proportion of people with tertiary
education in 2018 (25–34 years) 33 .3 37 .2 43 .5 30 .6 Poland Proportion of people with tertiary
education in 2018 (18–69 years) 21 .7 22 .3 27 .1 22 .3 Poland Proportion of STEM graduates,
2017 (20–29 years) per 1,000
inhabitants 16 .8 14 .7 23 .6 12 .1 Poland
Scientists and engineers as % total
population 4 .3 2 .6 4 .5 3 .6 Poland
IMD Talent position (2019) 39 57 37 45 Poland
Source: Eurostat, IMD, 2019
In terms of the strength of human capital Poland leads for every measured indicator . Next is Czechia .
Finally let us compare a few human development indicators!
Table 16 .
Human development indicators
Indicators Czechia Slovakia Poland Hungary Best position
HDI index (2019) 26 36 32 43 Czechia
Life expectancy at birth (2018) 79 .1 77 .4 77 .7 76 .2 Czechia
Social Progress Index (2019) 24 35 33 39 Czechia
Life satisfaction (2018) 7 .4 7 .1 7 .8 6 .5 Poland
Source: Eurostat For human development indicators, which are developed from a range of objective and subjective indicators, Czechia is ahead within the V4 countries .
Although many additional indicators could have been analysed and correlations could have also been searched for, we can conclude based on the values of the indicators shown that, first of all, the V4 countries are in similar according to some, and different according to other economic, knowledge and social indicators .
For many indicators Czechia performs the best, however, in terms of human capital strength, Poland is ahead of the other countries . Hungary and Slovakia are in general in the last two positions . From the points of view of sustainable economic and social develop- ment, only Czechia and Poland have a few indicator values close to those of the developed countries . This is a warning sign . It is not sufficient to put emphasis on the growth of economy if the results are not properly transmitted to society indicators . But it is not enough either to boost the economy by attracting foreign capital and help it capitalise on cheap labour force . V4 countries should move to knowledge-based competition to achieve strong human and social development stage, and that way to avoid middle income trap . This makes it absolutely necessary to invest more in knowledge, innovation and health, in sum, into their population . Otherwise there is no chance for speeding up convergence with the more developed countries in the EU .
References
Adec Innovations (2020) . What is Social Sustainability? Adec innovations, ESG Solutions . www .esg .adec- innovations .com/about-us/faqs/what-is-social-sustainability/
Aiginger, K ., & Böheim, M . (2015) . Fostering sustainable economic growth by redefining competitiveness and industrial policy . Brief for GSDR 2015 . Prepared for the UN Global Sustainability Development Report 2015 . https://sustainabledeveleopment .un .org/content/documents/633483-economic growth by redefining competitiveness and industrial policy .pdf
Alibasic, H . (2018) . Sustainability and Resilience Planning for Local Governments: The Quadruple Bottom Line Strategy . Springer International Publishing AG . https://doi.org/10.1007/978-3-319-72568-0
Bascom, C . R . (2016, July 9) . From Economic Growth to Sustainable Development . The Sustainability XTM Magazine . https://sustainabilityx .co/economic-growth-to-sustainable-development-5d441e9a595e Dile, E . (2017) . Green Metrics . Common Measures of Sustainable Economic Development . International
Economic Development Council . www .iedconline .org/clientuploads/Downloads/edrp/IEDC_Greenmetrics . Eccles, R . G ., & Karbassi, L . (2018, April 2) . The Right Way to Support the Sustainable Development Goals . pdf MIT Sloan Management Review . https://sloanreview .mit .edu/article/the-right-way-to-support-the-uns- sustainable-development-goals/
Eurostat . Real GDP growth rate – volume . https://ec .europa .eu/eurostat/web/products-datasets/-/tec00115&
lang=en
Harris, J . M ., Wise, T . A ., Gallagher, K . P ., & Goodwin, N . R . (2001) . A Survey of Sustainable Development:
Social and Economic Dimensions . Island Press, Washington; Covelo, London . Hoekstra, R . (2019) . Replacing GDP by 2030 . Cambridge University Press .
Huggins, R ., & Thompson, P . (Eds .) (2017) . Handbook of regions and competitiveness . Edward Elgar Publishing . IMD World Competitiveness Yearbook 2019 . IMD . Lausanne, Switzerland .
Kanchoochat, V . (2015) . The Middle-Income Trap and East Asian Miracle lessons . In: Rethinking Development Strategies after the Financial Crisis . Volume I: Making the Case for Policy Space (pp . 55–66) . UNCTAD . https://unctad .org/en/PublicationsLibrary/gdsmdp20151_en .pdf
Kapoor, A ., & Debroy, B . (2019, October 4) . GDP is Not a Measure of Human Well-Being . Harvard Business Review . https://hbr .org/2019/10/gdp-is-not-a-measure-of-human-well-being
Keynes, J . M . (1936) . The General Theory of Employment, Interest and Money . Palgrave Macmillan . Mazzucato, M . (2018) . The Value of Everything . Penguin Random House .
Mendez-Parra, M . (2016, December 14) . How to avoid the “middle-income trap” . Overseas Development Institute (ODI), London . www .odi .org/blogs/10472-how-avoid-middle-income-trap
Milberg, W ., & Houston, E . (2005) . The High Road and Low Road to International Competitiveness: Extending the Neo-Schumpeterian Trade Model Beyond Technology . International Review of Applied Economics, 19(2), 137–162 .
Nair, C . (2018) . The Sustainable State . Berrett-Koehler Publishers .
Pilling, D . (2018, January 17) . 5 ways GDP gets it totally wrong as a measure of our success . World Economic Forum . www .weforum .org/agenda/2018/01/gdp-frog-matchbox-david-pilling-growth-delusion
Sen, A . (1999) . Development as Freedom . Alfred A . Knopf .
Sen, A . (2000) . Social Exclusion: Concept, Application and Scrutiny . Social Development Papers No . 1 . Office of Environment and Social Development . Asian Development Bank, Manila .
Social Progress Imperative . Deloitte’s Strategic Partnership with SPI . www2 .deloitte .com/global/en/pages/
about-deloitte/articles/social-progress-imperative-index .html
Stiglitz, J . E ., Fitoussi, J .-P ., & Durand, M . (2019) . Measuring what Counts . The New Press . (Kindle Edition) UNDP Human Development Report . http://hdr .undp .org/en/content/human-development-report-2003, 2005,
2013, 2015, 2017, 2019 .
https://doi.org/10.1017/9781108608558 https://doi.org/10.4337/9781783475018
https://
doi.org/10.1007/978-3-31 9-70344-2
https://doi.org/10.1080/02692170500031646