CORRUPTION AND DEVELOPMENT:
A COMPARATIVE APPROACH TO SOCIOECONOMIC AND POLITICAL DIMENSIONS WORLDWIDE
Luca Salvati, Kostas Rontos, Ioannis Vavouras1
ABSTRACT The present study investigates relevant economic, social and political dimensions of development worldwide, focusing on (apparent and latent) links between perceived corruption, economic and human development, government effectiveness and the quality of the political system taken as representative variables of countries’ social systems. These variables were selected as the basic determinants of the level of overall development in a country, since combinations of these factors determine clusters of countries with different development patterns. The results of this study indicate that effective development policies require integrated strategies that incorporate efforts to reduce corruption and increase human development and government effectiveness. These strategies are sustainable in the long run when associated with institutional transformations. More specifically, if democracy is not consolidated and the political system is not grounded on the basis of freedom, socioeconomic development cannot be achieved and maintained in the long term, even with a high level of per-capita income.
KEYWORDS: corruption, human development, government effectiveness, political system, worldwide dynamics
1 Luca Salvati, PhD., is staff researcher at the Italian Council for Agricultural Research and Economics (CREA), Viale S. Margherita 80, I-52100 Arezzo, Italy, e-mail: luca.salvati@uniroma1.it; Kostas Rontos, PhD., is professor of Social Demography and Statistics at the University of the Aegean, Department of Sociology, Militini, Greece, e-mail: k.rontos@soc.aegean.gr; Ioannis Vavouras is professor of Economic Policy at Panteion University of Social and Political Sciences, Department of Public Administration, Athens, Greece, e-mail: vavouras@panteion.gr.
INTRODUCTION
Development has been mainly evaluated from an economic perspective, with social and institutional aspects being underestimated for several reasons, including the fact that the latter cannot be as easily measured as the former.
Economic figures are assessed in almost all countries with comparable approaches and relatively simple and widely acceptable indexes such as income per capita, while the social and institutional aspects of human action can only be successfully expressed through more complicated procedures about which there is only partial agreement. However, positive and normative interest in the social and institutional dimensions of development remains high, as economic growth is recognized as a partial condition of the wealth of nations.
Wealth equality, a fair distribution of economic benefits, the effective reduction of corruption, good governance, better social security, high-quality health and education systems are relevant factors characterizing the level of overall development in modern societies. A higher level of governance, as it is usually perceived, through more effective government and high standards of political rights and democracy allow nations to satisfy social needs more efficiently, so that citizens may live in a comfortable, fair and secure sociopolitical environment. The recent worldwide economic crisis has proved that what often lies behind an economic crisis is a hidden social and institutional crisis.
Economic development is not guaranteed in the long term unless it is associated with a high level of social and political development. The countries of the world affected more deeply by the economic crisis and sovereign debt crisis seem to be those in which the level of social and political development are moderate or even low. This statement is not surprising since social cohesion and democratic institutions help with discovering and implementing appropriate solutions for overcoming economic problems.
International agencies have recently developed methodologies for measuring variables that express the social and political dimensions (or aspects) of development. These empirical frameworks consider the overall development of countries as a multidimensional phenomenon associated with a variety of social, economic and institutional factors, including per-capita income, human development, government effectiveness, reduction of income (and wealth) inequalities, social transformations, reduced corruption and democratic political systems.
The objective of the present study is to investigate a broad range of factors (income per capita, human development, government effectiveness, political freedom in the forms of political rights and civil liberties, and corruption), intended as relevant indicators of the level of a country’s development. Based
on a preliminary investigation by Rontos et al. (2013), the present study focuses on the way multiple combinations of these factors determine distinct development patterns worldwide. Our analysis reveals that these factors are partly correlated, and inter-linkages are particularly important in determining the extent of the development of individual countries. Assuming that political rights and civil liberties represent the level of political development of countries, while the remaining variables represent the socioeconomic dimension of overall development, a multivariate strategy was implemented with the aim of (i) identifying relevant, latent components of development related to the factors described above, and (ii) profiling similarities among countries and homogeneous clusters across continents based on the adopted indicators.
EXPLORING MULTIPLE DIMENSIONS OF SOCIOECONOMIC DEVELOPMENT
The most widely used indicator of level of economic development is real income per-capita. Although criticized as an inadequate proxy of the level of overall development – mainly as an inefficient measure of living standards and quality of life prevailing in a country – per-capita income is still recognized as the best single available measure of average level of economic development. The level of overall development is also associated with the degree of human development, widely considered a wider notion than economic development. Human development refers to the expansion of people’s freedoms and capabilities to live their lives as they choose (UNDP 2009). Human development is both a process and an outcome. It not only involves the process through which human choices are enlarged, but it also focuses on the outcomes of the enlarged choices (UNDP 2002).
Overall development is also associated with the degree of government effectiveness. An effective public sector promotes all three dimensions of development. Kaufmann et al. (2009) define governance as “the traditions and institutions by which authority in a country is exercised. This includes the processes by which governments are selected, monitored and replaced;
the capacity of the government to effectively formulate and implement sound policies; and the respect of citizens and the state for the institutions that govern economic and social interactions among them.”
A strong connection also exists between the level of overall development and the quality of the political system. Underdevelopment is widely considered to be both a symptom and a cause of the malfunctioning of democratic institutions (Warren 2004). Moreover, democracy and consequent public accountability
reduce the costs of development. In a sense, the political system or the “political macrostructure” is responsible for determining the political motivation of all players in a state system. The reaction to these factors determines the behavior of state bureaucracy (Lederman et al. 2005). As a result, a highly developed and well-functioning democracy serves as a tool for increasing the level of overall development (Zhang et al. 2009). Similarly to the vision of political science, the new wave of institutional economics argues that institutions play a decisive role in sustainable development and growth, ultimately claiming that democracy stimulates growth in a direct (or indirect) way (e.g. Acemoglu et al. 2002).
A relevant variable associated with economic, social and institutional dimensions of development is the level of perceived (public-sector) corruption in a country, indicating the abuse of entrusted power for private gain. It has been acknowledged from the first stages of human civilization that whoever is in a position to exercise power may also be in a position to use their public office for individual benefit. Public-sector corruption is usually defined as the abuse of public power for private benefit (Tanzi 1998, 2000) or the abuse of public office for private gain (Martinez-Vazquez et al. 2007). Johnston (2001) has formulated an analysis of the concept and the various definitions of corruption.
The World Bank has defined public sector corruption as the abuse of public authority for private interest (World Bank 1997). OECD defines public sector corruption as the misuse of public office, roles or resources for private benefit, material or otherwise (OECD 1996). While related to personal gain on some occasions, corruption can have several facets, such as bribery, embezzlement, fraud, extortion and nepotism (Amundsen 1999). Beneficiaries may include so- called third parties, namely family, friends or the political party to which the individual belongs. While corruption is seen as a “disease” inherent to public power and an indication of bad governance (Treisman 2000; Paldam 2002; de Vaal – Ebben 2011; Lalountas et al. 2011), the “grease theory” – which argues that corruption “lubricates the wheels” and fosters efficiency – might complicate these conclusions, proposing a more general view of the phenomenon which is widely diffused across all continents (Leff 1964; Huntington 1968; Lambsdorff 2007; Aidt 2009). Although corruption can be observed in both the private and the public sector, the vast bulk of economic literature examines only public sector corruption, for two main reasons. First, the phenomenon is mainly associated with the public sector, and second, widely accepted private-sector corruption indices have not yet been constructed, rendering the relevant empirical research extremely difficult.
Corruption is a complex and multidimensional phenomenon with several causes and effects and numerous associated factors. The most important of these are level of economic development, type of political authority, quality of
institutional framework, effectiveness of justice system, degree of globalization, level of competition, structure and size of public sector, as well as cultural quality, geographical location and history. In summary, widespread corruption largely indicates the existence of institutional and political weaknesses as well as economic and social underdevelopment. Corruption has been accepted as the single most significant barrier to both democratization and economic development (Rose-Ackerman 1999; Sung 2002; Rontos et al. 2013).
DATA AND METHODOLOGY Data
Our analysis is based on six variables made available for 167 countries, referring to the year 2010 with no missing data. In regard to the ensemble of indicators adopted in this study, more recent data sometimes replaced missing values for some of the 167 countries considered in the analysis. Variables were derived from official statistics and other reliable international data sources, as explained in the following sub-sections. The final data matrix prepared by the authors is available for further studies upon request.
Corruption
The corruption perceptions index (CPI), widely used in comparative investigations and provided annually by the nongovernmental organization Transparency International, was incorporated into this study with elementary country data referring to the year 2010. The CPI is a composite index based on a variety of data derived from 13 surveys carried out by 10 independent organizations that measure corruption on a scale from 0 to 10, where 0 represents the highest possible corruption level. High scores indicate a low perceived level of corruption in a given country. Despite the fact that the CPI is not the outcome of the objective quantitative measurement of corruption – representing the most relevant conceptual limitation of this indicator – it reveals how this phenomenon is perceived within local societies. The major strength of the CPI lies in the combination of multiple data sources in a single index, a fact that increases the reliability of each country’s score (Lambsdorff 2006).2
2 For an extended analysis and assessment of the various indicators of corruption, see mainly UNDP (2008).
Per-capita income
Per-capita Gross National Income in purchasing power parity or current international dollars (GNIpc,ppp) is used to approximate the level of economic development in each country. GNIpc,ppp is gross national income (GNI) converted to international dollars using purchasing power parity rates. An international dollar has the same purchasing power over GNI as a US dollar has in the United States.3 GNIpc,ppp is a key indicator in economic analyses when the objective is to compare broad differences between countries in living standards since purchasing power parities take into account the relative cost of living in various countries. GNIpc,ppp is an indicator widely used in international comparisons of economic development (World Bank 2010a).
Human development
The Human Development Index (HDI) is a summary estimation of the level of human development based on non-income measures that integrates measures of life expectancy in birth, mean years of schooling, expected years of schooling and gross national income (GNI) per-capita. Estimated by the United Nations Development Program (UNDP), it measures the average achievements in a given country in three relevant dimensions of human development: a long and healthy life, access to knowledge, and a decent standard of living. Despite its inherent limitations, the index is a useful comparative measure of the level of human development. Based on the HDI, countries are classified into three categories:
(i) high human development with HDI > 0.8, (ii) medium human development with 0.5 < HDI < 0.8, and (iii) low human development with HDI < 0.5. The data used refer to the year 2010.
Government effectiveness
To express Government Effectiveness, the relevant World Bank government effectiveness indicator (GE) is used. This indicator is very useful because it aims at capturing the quality of public services provided, the quality of the civil service and its degree of independence from political pressure, the quality of policy formulation and implementation, and the credibility of the government’s commitment to such policies. The aim of the indicator is therefore to capture
3 See http://data.worldbank.org/indicator/NY.GNP.PCAP.PP.CD.
the capacity of the public sector to implement sound policies. GE is one of the six indicators of broad dimensions of governance (the so-called worldwide governance indicators (WGI)) that have covered over 200 countries since 1996 and are produced by Kaufmann et al. (2010) and the World Bank (2010b). Values of GE range between -2.5 and 2.5. Actually, the variable has been standardized (with mean 0 and standard deviation 1), so that cross-country- and time-related differences in the measurement scale are avoided. Higher values correspond to better governance. This indicator assesses subjective perceptions regarding government effectiveness and is not the outcome of quantitative measurement.
Political rights
The “political rights” index (PR) provided by the organization Freedom House (2010) integrates three indicators; namely, electoral process, political pluralism, and participation/functioning of government. The index is estimated by the Freedom House organization (2013). The PR index ranges from 1 (a very free country) to 7 (a country which is not free). According to the PR index, countries are characterized as Free (F) if they score 1.0-2.5 on the 1-7 scale, Partly Free (PF) if they score 3.0-5.0 on the 1-7 scale, and Not Free (NF) if they score 5.5-7.0 on the 1-7 scale.
Civil liberties
The “Civil Liberties” index (CL) is estimated by the Freedom House organization (2013)4 and is based on the evaluation of four partial indicators, namely, freedom of expression and belief, associational and organizational rights, rule of law, personal autonomy, and individual rights. According to the CL index, countries are characterized as free (F) if they score 1.0-2.5 on the 1-7 scale, partly free (PF) if they score 3.0-5.0 on the 1-7 scale, and not free (NF) if they score 5.5-7.0 on the 1-7 scale.
4 For more details, see Methodological Summary, Freedom House (2013).
Methodology
The collected variables were standardized prior to analysis. A three-step multivariate strategy based on a pair-wise Spearman non-parametric rank correlation analysis, a Principal Component Analysis (PCA), and a non- hierarchical Cluster Analysis (CA) was developed with the aim of characterizing the socioeconomic and political system of each country according to the selected economic and non-economic features that describe the level of overall development in each country. Multivariate analysis allows for a comprehensive classification of countries based on partly redundant input variables (e.g. Salvati 2013; Pili et al. 2017; Duvernoy et al. 2018).
Non-parametric correlations
A pairwise Spearman non-parametric co-graduation analysis was carried out separately for each variable to test if significant correlations exist over the whole ensemble of countries (n = 167). Significant correlations at p < 0.001 were identified after Bonferroni’s correction for multiple comparisons (Zitti et al. 2015). A non-parametric analysis was preferred to a classical parametric analysis (e.g. using Pearson correlation coefficients) with the aim of detecting both linear and non-linear significant pairwise relationships between variables, without stringent requisites about normality (Rontos et al. 2016).
Principal Component Analysis
A PCA was undertaken on the six variables available for the investigated countries in order to extract and summarize the latent factors describing the socioeconomic context and the possible relationships with corruption and to complement the results obtained from the non-parametric Spearman correlation analysis. As the PCA was based on the correlation matrix, the number of significant axes (m) was chosen by retaining the components with eigenvalue > 1. Outputs of the PCA include eigenvalues of the main components, variable loadings, and country scores.
K-means Clustering
Non-hierarchical k-means clustering was carried out with the aim of separating countries into a few groups with homogeneous socioeconomic and political patterns and corruption levels. The best partition (i.e. the optimal number of clusters for group separation) was chosen according to the Cubic Clustering Criterion that works through maximizing the proportion of within-group variance to between- group variance. Outputs of the CA include the average of each of the six considered variables by cluster, together with cluster membership and the multivariate distance from the centroid of each cluster by country. An Analysis of Variance (ANOVA) was finally used to identify which variables contribute most to the cluster differentiation.
RESULTS
Non-parametric correlations
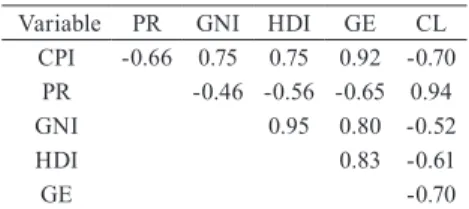
Pairwise Spearman co-graduation analysis indicates the existence of important relationships among the considered variables (Table 1). The CPI was correlated to all the remaining variables, increasing with GE, GNI and HDI and decreasing with CL and PR. The highest correlation coefficient was found for the relationship between GNI and HDI, possibly indicating that gross national income can be considered a proxy for the level of socioeconomic development in the countries investigated in the present study. While being positively correlated to CL, PR was negatively associated with GE. Finally, GE was negatively correlated to CL. In general, the relationships between the above variables are the ones postulated by relevant theory.
Table 1 Pairwise Spearman non-parametric correlation analysis between the varia- bles investigated in each country (bold indicates significant correlations at p < 0.001 after Bonferroni’s correction for multiple comparisons).
Variable PR GNI HDI GE CL
CPI -0.66 0.75 0.75 0.92 -0.70
PR -0.46 -0.56 -0.65 0.94
GNI 0.95 0.80 -0.52
HDI 0.83 -0.61
GE -0.70
Source: Authors’ elaboration using survey dataset, various statistical sources; see Section Data.
Principal Component Analysis
PCA extracted two relevant axes, accounting respectively for 73.6% and 16.8% of total variance with a cumulated variance explained by the two main axes of more than 90% (Table 2). All variables were found to be associated with factor 1 (PR and CL with positive loadings, the remaining four with negative loadings) which indicates an axis of economic development together with increasing corruption level. However, the highest contributions to the axis are from GE, CPI and HDI. Factor 2 is negatively associated with civil liberties and political rights, possibly indicating that the cultural and institutional factors influencing these variables are only partly correlated to the level of socioeconomic development in a country.
Table 2 Summary results of the Principal Component Analysis applied to the matrix composed of countries (by row) and the six investigated variables (by column)
Variable Component loadings Contribution
PC 1 PC 2 PC 1 PC 2
CPI -0.92 -0.19 0.19 0.03
PR 0.76 -0.62 0.13 0.38
GNI -0.82 -0.48 0.15 0.22
HDI -0.85 -0.25 0.16 0.06
GE -0.95 -0.14 0.21 0.02
CL 0.82 -0.54 0.15 0.28
Variance (%) 73.6 -
Cumulated variance (%) 16.8 90.4
Source: Authors’ elaboration using survey dataset, various statistical sources; See Section Data.
Table 3 reports the countries’ scores for the two main components. Developed countries with consolidated democracies had negative scores on both the first and second axes while economically-disadvantaged and poor countries with very unstable political systems are clustered along the positive side of the first and second axes.
Table 3 Component scores for each country for the two principal components
Country PC1 PC2 Country PC1 PC2 Country PC1 PC2
Afghanistan 1.52 -0.33 Germany -1.74 -0.24 Nigeria 0.99 0.31
Albania 0.04 0.39 Ghana -0.06 1.66 Norway -2.14 -1.00
Algeria 0.65 -0.93 Greece -0.80 0.37 Oman -0.06 -1.86
Country PC1 PC2 Country PC1 PC2 Country PC1 PC2
Angola 1.14 -0.37 Guatemala 0.56 0.22 Pakistan 0.87 0.16
Argentina -0.26 0.72 Guinea 1.53 -0.65 Panama -0.43 1.01
Armenia 0.50 -0.61 Guinea–Bissau 1.03 0.78 Papua New
Guinea 0.72 0.85
Australia -1.89 -0.34 Guyana 0.17 1.02 Paraguay 0.42 0.79
Austria -1.81 -0.31 Haiti 1.14 0.42 Peru -0.07 0.65
Azerbaijan 0.74 -0.89 Honduras 0.59 0.24 Philippines 0.33 0.43
Bahrain -0.08 -1.83 Hong Kong -1.50 -2.04 Poland -0.96 0.82
Bangladesh 0.71 0.79 Hungary -0.91 0.86 Portugal -1.17 0.55
Barbados -1.34 0.54 Iceland -1.69 -0.01 Qatar -1.13 -3.86
Belarus 0.88 -1.65 India 0.18 1.07 Romania -0.33 0.69
Belgium -1.65 -0.16 Indonesia 0.18 1.02 Russia 0.50 -1.31
Benin 0.38 1.71 Iran 0.76 -1.30 Rwanda 0.81 -0.51
Bhutan 0.19 -0.42 Iraq 1.16 -0.41 Samoa -0.17 1.08
Bolivia 0.26 0.69 Ireland -1.64 -0.08 Sao Tome and
Principe 0.30 1.59 Bosnia
Herzegovina 0.24 0.17 Israel -1.22 0.07 Saudi Arabia 0.29 -2.32
Botswana -0.43 0.35 Italy -0.89 0.20 Senegal 0.52 1.05
Brazil -0.27 0.85 Jamaica -0.12 0.66 Serbia -0.26 0.82
Brunei -0.59 -2.85 Japan -1.54 -0.40 Seychelles -0.42 -0.29
Bulgaria -0.33 0.72 Jordan 0.36 -1.11 Sierra Leone 0.87 1.40
Burkina Faso 0.83 0.67 Kazakhstan 0.51 -1.11 Singapore -1.57 -3.05
Burundi 1.22 0.58 Kenya 0.74 0.48 Slovakia -0.95 0.78
Cambodia 1.06 -0.39 Kiribati -0.01 1.98 Slovenia -1.31 0.35
Cameroon 1.21 -0.64 Korea (South) -1.18 0.03 Solomon
Islands 0.65 0.76
Canada -1.91 -0.39 Kuwait -0.54 -1.77 South Africa -0.29 0.90
Cape Verde -0.32 1.77 Kyrgyzstan 0.92 -0.54 Spain -1.32 0.24
Cent. African
Republic 1.31 0.27 Laos 1.26 -0.98 Sri Lanka 0.31 -0.03
Chad 1.65 -0.56 Latvia -0.74 0.72 Sudan 1.64 -1.00
Chile -1.19 0.73 Lebanon 0.23 -0.27 Swaziland 0.92 -0.93
China 0.65 -1.64 Lesotho 0.44 0.99 Sweden -1.99 -0.48
Colombia 0.06 0.04 Liberia 0.91 1.05 Switzerland -2.04 -0.72
Comoros 1.01 1.06 Libya 0.97 -2.04 Syria 0.98 -1.31
Congo –
Brazzaville 1.39 -0.04 Lithuania -0.91 0.89 Tajikistan 0.98 -0.50
Costa Rica -0.70 1.22 Luxembourg -2.07 -0.98 Tanzania 0.62 0.79
Country PC1 PC2 Country PC1 PC2 Country PC1 PC2
Cote d’Ivoire 1.29 -0.16 Madagascar 0.95 -0.05 Thailand 0.28 -0.47
Croatia -0.69 0.68 Malawi 0.63 0.81 Togo 1.07 0.41
Cyprus -1.41 0.22 Malaysia -0.28 -0.69 Tonga 0.33 0.02
Czech
Republic -1.07 0.64 Maldives 0.33 0.30 Trinidad and
Tobago -0.51 0.36
Denmark -1.94 -0.47 Mali 0.66 1.58 Tunisia 0.41 -1.48
Djibouti 1.00 -0.06 Malta -1.17 0.55 Turkey -0.25 0.05
Dominica -0.76 1.19 Mauritania 1.13 -0.31 Turkmenistan 1.32 -1.53 Dominican
Republic 0.01 1.11 Mauritius -0.72 0.79 Uganda 0.86 0.26
Ecuador 0.24 0.56 Mexico -0.22 0.41 Ukraine 0.17 0.92
Egypt 0.68 -0.83 Moldova 0.43 0.46 United Arab
Emirates -0.62 -2.83
El Salvador -0.04 0.77 Mongolia 0.14 1.36 United
Kingdom -1.64 -0.09 Equatorial
Guinea 1.30 -1.78 Montenegro -0.27 0.43 United States -1.75 -0.44
Eritrea 1.63 -0.96 Morocco 0.50 -0.17 Uruguay -1.01 0.91
Estonia -1.22 0.61 Mozambique 0.77 1.00 Uzbekistan 1.25 -1.44
Ethiopia 0.99 0.03 Namibia -0.19 1.06 Vanuatu 0.01 1.26
Finland -1.98 -0.39 Nepal 0.84 0.59 Venezuela 0.56 -0.37
France -1.54 0.00 Netherlands -1.92 -0.47 Vietnam 0.87 -0.94
Gabon 0.69 -1.00 New Zealand -1.84 -0.14 Yemen 1.15 -0.30
Gambia 0.94 -0.08 Nicaragua 0.69 0.36 Zambia 0.72 0.85
Georgia 0.11 -0.20 Niger 1.06 0.50
Source: Authors’ elaboration using survey dataset, various statistical sources; See Section Data.
K-means clustering
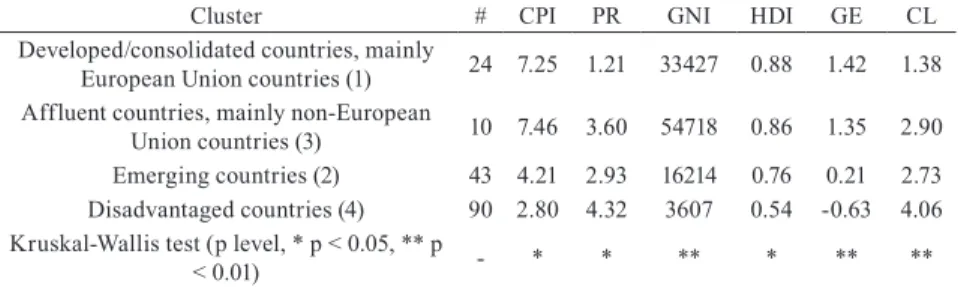
Cluster analysis identified four homogeneous groups of countries (Table 4). Two groups include highly developed countries. The full list of countries according to the cluster membership is shown in Table 5. The greatest dissimilarities exist between rich non-European countries and economically- disadvantaged countries, and between economically-disadvantaged countries and emerging countries. A considerable distance exists also between developed European countries and disadvantaged countries. A non-parametric analysis of variance identifies variables used in k-means clustering that differ significantly across the clusters (Table 5). The variables contributing the most to cluster differentiation are GNI, GE and CL.
The cluster with the highest number of countries (n = 90) includes the economically disadvantaged and poor countries in Africa, Asia and Latin America with the lowest CPI score (indicating the highest level of corruption) and the highest PR and CL scores (indicating the lowest political rights and civil liberties observed across the selected countries). Per capita GNI is less than 4,000 international dollars per year and HDI is the lowest among clusters, together with a low GE. Examples of countries belonging to this cluster are Cape Verde, Congo, Guyana, Honduras, Kiribati, Pakistan, Samoa and Uzbekistan.
Table 4 Results of k-means clustering: average value by variable and group
Cluster # CPI PR GNI HDI GE CL
Developed/consolidated countries, mainly
European Union countries (1) 24 7.25 1.21 33427 0.88 1.42 1.38 Affluent countries, mainly non-European
Union countries (3) 10 7.46 3.60 54718 0.86 1.35 2.90 Emerging countries (2) 43 4.21 2.93 16214 0.76 0.21 2.73 Disadvantaged countries (4) 90 2.80 4.32 3607 0.54 -0.63 4.06 Kruskal-Wallis test (p level, * p < 0.05, ** p
< 0.01) - * * ** * ** **
Note: The number in parenthesis indicates cluster label, as reported in Table 5. Kruskal-Wallis non-parametric analysis of variance was run to identify significant differences in the statistical distribution of each of the six variables among clusters.
Source: Authors’ elaboration using survey dataset, various statistical sources, See Section Data.
A total of 43 countries were classified as emerging countries with a considerably higher economic level and higher social and political development compared to the previous cluster, but unstable political systems and the worst government effectiveness. CPI average score is moderately low, indicating quite strong perceptions of level of corruption together with relatively high PR and CL scores, indicating a modest level of political rights and civil liberties. On average, per-capita GNI is higher than 15,000 international dollars per year with an intermediate score for the level of human development. Examples of countries belonging to this cluster are Argentina, Bahrain, Chile, Brazil, China, India, Mexico, Russia and Saudi Arabia.
Only ten countries were classified as affluent countries with high levels of economic development (the highest GNI per-capita; on average, 54,718 international dollars) relatively high government effectiveness and a fairly good level of human development. However, in some of these countries both PR and CL are relatively high, suggesting heterogeneity in the political systems of the two sub-classes participating in the cluster, i.e. (i) high-income and firmly democratic countries (United States, Luxembourg, Switzerland and Norway), and (ii) high-income and partly free (Hong Kong, Kuwait and Singapore) or not
free countries (United Arab Emirates, Brunei, and Qatar). Interestingly, the CPI average score is the highest observed in the first sub-class (8.0), indicating low or very low levels of corruption. In the second sub-class, the related countries are associated with higher levels of corruption (6.5) than the first, with the exception of Singapore (9.3), which is considered one of the least corrupted countries in the world.
Finally, 24 countries were classified as developed and consolidated democracies, located mainly in the European Union with high economic and social development and the highest HDI, on average. PR and CL both reach the highest score, indicating the highest level of political rights and civil liberties.
The CPI average score is similar to that observed for the affluent, mainly non- European Union countries and indicates a low corruption level with the highest government effectiveness among the clusters. Examples of countries belonging to this cluster are Australia, Austria, Belgium, Canada, Finland, Greece, Israel, Italy, Japan, Netherlands, New Zealand, Spain, Sweden, United Kingdom, France, Germany and Denmark.
Table 5 Cluster membership by country and distance from the cluster’s centroid
Country Cluster Country Cluster Country Cluster
# Distance # Distance # Distance
Afghanistan 4 1.1 Germany 1 1.8 Nigeria 4 0.6
Albania 4 2.0 Ghana 4 0.8 Norway 3 1.3
Algeria 4 1.8 Greece 1 2.5 Oman 1 3.3
Angola 4 0.6 Guatemala 4 0.4 Pakistan 4 0.3
Argentina 2 0.4 Guinea 4 1.1 Panama 2 1.4
Armenia 4 0.8 Guinea–Bissau 4 1.0 Papua New Guinea 4 0.5
Australia 1 1.3 Guyana 4 0.1 Paraguay 4 0.6
Austria 1 2.4 Haiti 4 1.0 Peru 4 2.3
Azerbaijan 4 2.3 Honduras 4 0.1 Philippines 2 0.1
Bahrain 2 2.0 Hong Kong 3 3.0 Poland 2 1.1
Bangladesh 4 0.7 Hungary 2 1.3 Portugal 1 3.3
Barbados 2 1.0 Iceland 1 1.8 Qatar 3 8.9
Belarus 2 1.2 India 2 0.1 Romania 2 0.9
Belgium 1 1.8 Indonesia 4 0.2 Russia 2 1.1
Benin 4 0.8 Iran 2 2.0 Rwanda 4 1.0
Bhutan 4 0.6 Iraq 4 0.1 Samoa 4 0.3
Country Cluster
Country Cluster
Country Cluster
# Distance # Distance # Distance
Bolivia 4 0.4 Ireland 1 0.1 Sao Tome Principe 4 0.7
Bosnia Herzegovina 4 2.1 Israel 1 3.3 Saudi Arabia 2 2.7
Botswana 2 1.1 Italy 1 0.8 Senegal 4 0.7
Brazil 2 2.2 Jamaica 4 1.6 Serbia 2 2.2
Brunei 3 2.0 Japan 1 0.4 Seychelles 2 2.5
Bulgaria 2 1.2 Jordan 4 0.9 Sierra Leone 4 1.1 Burkina Faso 4 1.0 Kazakhstan 2 2.4 Singapore 3 0.9
Burundi 4 1.2 Kenya 4 0.8 Slovakia 2 2.2
Cambodia 4 0.6 Kiribati 4 0.0 Slovenia 1 3.0
Cameroon 4 0.5 Korea (South) 1 2.0 Solomon Islands 4 0.6
Canada 1 1.9 Kuwait 3 0.6 South Africa 2 2.5
Cape Verde 4 0.0 Kyrgyzstan 4 0.6 Spain 1 1.0
Cent. African
Republic 4 1.2 Laos 4 0.5 Sri Lanka 4 0.6
Chad 4 0.9 Latvia 2 0.1 Sudan 4 0.6
Chile 2 0.6 Lebanon 2 1.1 Swaziland 4 0.8
China 2 1.6 Lesotho 4 0.7 Sweden 1 2.6
Colombia 4 2.2 Liberia 4 1.3 Switzerland 3 1.9
Comoros 4 1.0 Libya 2 0.1 Syria 4 0.6
Congo –
Brazzaville 4 0.2 Lithuania 2 0.6 Tajikistan 4 0.6
Costa Rica 2 2.1 Luxembourg 3 2.7 Tanzania 4 0.9
Cote d’Ivoire 4 0.7 Madagascar 4 1.1 Thailand 4 1.9
Croatia 2 0.9 Malawi 4 1.1 Togo 4 1.1
Cyprus 1 1.2 Malaysia 2 0.9 Tonga 4 0.4
Czech Republic 2 2.9 Maldives 4 1.7 Trinidad Tobago 2 3.3
Denmark 1 3.0 Mali 4 1.1 Tunisia 4 2.2
Djibouti 4 0.5 Malta 2 3.2 Turkey 2 0.4
Dominica 2 1.8 Mauritania 4 0.5 Turkmenistan 4 1.6 Dominican
Republic 4 2.2 Mauritius 2 1.1 Uganda 4 1.0
Ecuador 4 1.7 Mexico 2 0.8 Ukraine 4 1.2
Egypt 4 1.0 Moldova 4 0.1 United Arab Emir. 3 3.2
El Salvador 4 1.2 Mongolia 4 0.0 United Kingdom 1 0.8 Equatorial Guinea 2 2.3 Montenegro 2 1.5 United States 3 3.0
Country Cluster
Country Cluster
Country Cluster
# Distance # Distance # Distance
Eritrea 4 1.3 Morocco 4 0.4 Uruguay 2 1.2
Estonia 2 1.2 Mozambique 4 1.1 Uzbekistan 4 0.2
Ethiopia 4 1.1 Namibia 4 1.1 Vanuatu 4 0.3
Finland 1 1.3 Nepal 4 1.0 Venezuela 2 1.8
France 1 0.4 Netherlands 1 3.3 Vietnam 4 0.2
Gabon 2 1.4 New Zealand 1 1.9 Yemen 4 0.5
Gambia 4 0.7 Nicaragua 4 0.4 Zambia 4 0.9
Georgia 4 0.5 Niger 4 1.2
Developed/consolidated countries,
EU Code 1 Affluent countries, mainly non-EU Code 3
Emerging countries Code 2 Disadvantaged countries Code 4
Source: Authors’elaboration using survey dataset, various statistical sources; See Section Data.
DISCUSSION
The analysis presented in this study highlights that the level of economic development, the perception of the level of corruption, the degree of human development, the extent of government effectiveness and the quality of the existing political system are important dimensions shaping overall developmental patterns worldwide. Empirical results corroborate earlier assumptions, demonstrating that corruption is low where all other factors considered here are high (level of economic development, degree of government effectiveness, quality of human development and political democracy). Corruption is also correlated to the nature of polity and political institutions, indicating that a well-functioning democracy may serve as a relevant tool for a country’s development. Based on these findings, social and political efforts should be made – in addiction to strictly economic policies – to increase or consolidate the level of overall development.
This statement is in line with the observed correlation between governance effectiveness and CPI, possibly indicating the role of the state in the creation of a
“fair” society, reconnecting to the assumptions mentioned above. Improving the quality of public services, increasing the independence of state bureaucracy from political pressures, improving the effectiveness of processes of policy formulation (and implementation) and the credibility of the government’s commitment to such policies reduces the motives of voters, state officials and politicians to resort to corruption. As a result, these policies may increase overall development.
Per-capita income is strongly correlated with the degree of corruption worldwide. High values of GNIpc,ppp are associated with high values of CPI,
indicating a low perceived level of corruption. However, the effective control of corruption should not be misinterpreted and considered a “luxury good”
that people demand once their incomes increase to a certain level (Sioussiouras – Vavouras 2012). This is achieved only through the adoption and effective implementation of the appropriate long-term economic, social and political processes. The level of corruption is particularly high in low-income countries because corruption is considered, to some extent, to be a “survival strategy.” In these countries, increasing personal income is a strong motive and is becoming stronger due to conditions of utter deprivation and low public sector salaries. In order to survive and support their families, low-paid public sector employees may need to moonlight or accept small bribes, especially when their jobs are associated with a high degree of uncertainty, mainly due to political instability, that reduces the probability of future wage appropriation. According to this line of thought, corruption is a “disease” caused by poverty, or a by-product of poverty that only diminishes when economies develop, as the multivariate analysis implemented in our study may demonstrate. A high level of human development is positively correlated with all remaining factors considered in this study. Improving quality of life and rising levels of education, apart from rising incomes, also increase the level of overall development. Investments into human capital should be considered the most productive form of investment associated with overall development.
The political system seems to be another critical factor that affects the level of overall development worldwide. A strong negative correlation was observed between (i) PR and CL and (ii) CPI and GE. The higher the PR and CL (that is, the more a country is associated with reduced freedom), the higher the corruption and the lower the government effectiveness. The political system seems to be less well associated with economic development as expressed by GNI in the present study, possibly due to high heterogeneity in countries’ datasets.
Consequently, the long-lasting and true democratic forms of government and the establishment of a genuine democratic tradition prove to be decisive factors, guaranteeing a high overall development level, contributing specifically to a decrease in corruption and government effectiveness levels. The smooth functioning of democratic institutions and civil liberties is thus considered a prerequisite for achieving and maintaining high levels of development. Notions such as transparency, collectivism, rule of law, freedom of expression, association and organization, constitute the ingredients for a successful and smooth operation of a lawful state (Rothstein – Teorell 2008). Western-type democracies owe their prosperity and overall development to a great extent exactly to these factors, which are partly redundant – as Principal Component Analysis has outlined clearly. As indicated by non-parametric correlations and the PCA, substitutability among factors is partial and significant pair-wise relationships are often non-linear,
suggesting that a renewed developmental vision should formulate strategies that are adapted to individual contexts and underlying conditions of growth, which are changing rapidly following recent socioeconomic challenges.
According to the mean value of the above variables that represents multiple aspects of socioeconomic development, world countries may be clustered into four categories with a specific profile. The first cluster includes wealthy (mostly European) countries that have medium-high economic performance accompanied by the highest scores in political and social development as expressed by the very low corruption, the highest political rights, civil liberties, human development and government effectiveness. In achieving this combination we can say that Europe is the region with the highest overall development in the world, with a balanced form of development with strong concern for society and the political system. In this sense, economic development is partly sacrificed in order to maintain and improve the functioning of social and political institutions.
However, moderate heterogeneity was also observed in this cluster, possibly associated with a consolidating divide between western and northern European countries and southern (Mediterranean) countries (e.g. Carlucci et al. 2017). The second cluster represents the very rich countries of North America (USA), and the Middle East with the lowest corruption and high government effectiveness, but also with some problems with political development. The aforementioned countries seem to give priority to economic and social development but have a moderate gap in political development in respect of Europe, a fact that may reduce the overall development level.
A third cluster contains emerging countries with medium-low per-capita, relatively high perceived corruption levels and low political development and government effectiveness. The score for human development is not much less than the score for the aforementioned clusters. Political problems and a government with very low effectiveness in these countries seem to be serious handicaps to achieving a higher level of overall development, as described in the present study.
Finally, a fourth cluster containing more than 50% (actually 53.9%) of the countries examined in this analysis includes economically-deprived economies (with GNI equal to 22% of that of the emerging countries) and low scores for all indexes of social and political development. Low performance in all dimensions of development is typical of this cluster and is additional evidence that social, political and economic aspects of development are interrelated and no single one can be omitted from the developmental path. High values for these dimensions create “virtuous cycles” for development, while low values create “vicious cycles” of development.
Policy instruments suitable for increasing the level of overall development of countries require an integrated strategy for reducing corruption and stimulating
both human development and government effectiveness. However, in order to be effective, these strategies should be associated with the necessary democratic transformations. If the political system is considered “not free,” a high overall level of development cannot be achieved and maintained, mainly because corruption cannot be effectively reduced in spite of the prevailing high income levels. The examples of Brunei, Kuwait and United Arab Emirates confirm this conclusion, with the astonishing exception of Singapore which, although considered a high income and partly free country, is one of the least corrupted countries in the world. This outcome could be attributed to cultural factors not examined in the present study. A high overall level of development is thus achieved and maintained in the long term only when socioeconomic development is associated with the consolidation of democracy. Increasing incomes is a necessary but not sufficient condition for increasing overall development.
CONCLUSIONS
The aim of this paper was to propose a classification of world countries according to relevant political, economic and social factors. While previous studies have empirically investigated the extent of corruption in various countries by analyzing differences in the respective values of the corruption perception index, the variables used in the present study are gross national income per head in purchasing power parities, the non-income human development index, the political rights index, and the civil liberties index. Based on the selected indicators, analysis of the socioeconomic context in the investigated countries provides some interesting results from a policy perspective by developing a comprehensive analysis of corruption corrected by socioeconomic factors (e.g.
Tiihonen 2003). The research in this paper tested the hypothesis that developing countries have unbalanced socioeconomic contexts due to rapid economic growth with impact on corruption levels. Although affluent and socially- developed countries are relatively well distinguished from both emerging and economically-disadvantaged countries, these categories do not reflect the marked heterogeneity observed within countries. The lack of homogeneity within the groups should be attributed to institutional, territorial, political and cultural factors rather than to crude differences in the level of economic growth quantified by way of per capita income. This suggests that policies against corruption should target a complex, although balanced set of causes that are not only limited to the strictly economic performance of the country but range from the social sphere to political, cultural, institutional and environmental
attributes. Further studies that employ a hierarchical clustering of world countries according to the multivariate, diachronic attributes of socioeconomic development are thus necessary for understanding the gains and losses in economic performance and competitiveness across countries, and for clarifying the more subtle differences in the social and political systems of specific country clusters characterized by similar levels of income and economic productivity.
REFERENCES
Acemoglu, D., Johnson, S., Robinson, J.A. (2002). “Reversal of Fortune:
Geography and Institutions in the Making of the Modern World Income Distribution,” The Quarterly Journal of Economics, Vol. 117, No 4, pp. 1231–
1294.
Aidt, T.S. (2009). “Corruption, institutions, and economic development,” Oxford Review of Economic Policy, Vol. 25, pp. 271-291.
Amundsen, I. (1999). Political corruption: An introduction to the issues.
Working Paper 99:7. Bergen, Chr. Mickelsen Institute
Carlucci M., Grigoriadis, E., Rontos, K. and Salvati, L. (2017). “Revisiting an Hegemonic Concept: Long-term 'Mediterranean Urbanization' in between city re-polarization and metropolitan decline,” Applied Spatial Analysis and Policy, Vol. 10, No 3, pp. 347-362.
de Vaal, A. and Ebben, W. (2011). “Institutions and the relations between corruption and economic growth,” Review of Development Economics, Vol.
15, No 1, pp. 108-123.
Duvernoy, I., Zambon, I., Sateriano, A. and Salvati L. (2018). “Pictures from the Other Side of the Fringe: Urban Growth and Peri-urban Agriculture in a Post-industrial City (Toulouse, France),” Journal of Rural Studies, Vol. 57, pp. 25-35.
Freedom House (2010). Freedom in the world 2010. Global erosion and freedom.
Freedom House (2013). Freedom in the world 2013. Democratic breakthroughs in the balance.
Huntington, S.P. (1968). Political order in changing societies. New Haven, Connecticut, Yale University Press
Johnston, M. (2001). “The definitions debate: Old conflicts in new guises,” in: Jain, A.K. (Ed.), The Political Economy of Corruption. London, Routledge, pp. 11-31.
Kaufmann, D., Kraay, A. and Mastruzzi, M. (2009). Governance matters VIII:
Aggregate and individual governance indicators 1996-2008. Policy Research Working Paper No. 4978, World Bank
Kaufmann, D., Kraay, A. and Mastruzzi, M. (2010). The worldwide governance indicators: Methodology and analytical issues. World Bank, Policy Research Working Paper No. 5430
Lalountas, D.A., Manolas, G.A. and Vavouras, I.S. (2011). “Corruption, globalization and development: How are these three phenomena related?”
Journal of Policy Modeling, Vol. 33, pp. 636-648.
Lambsdorff, J.G. (2006). “Causes and consequences of corruption: What do we know from a cross-section of countries?” in: Rose-Ackerman, S. (Ed.), International handbook on the economics of corruption. UK, Edward Elgar, pp. 3-51.
Lambsdorff, J.G. (2007). The institutional economics of corruption and reform.
Cambridge, UK, Cambridge University Press
Lederman, D., Loayza, N.V. and Soares, R.R. (2005). “Accountability and corruption: Political institutions matter,” Economics & Politics, Vol. 17, No 1, pp. 1-35.
Leff, N. (1964). “Economic development through bureaucratic corruption,” The American Behavioral Scientist, Vol. 8, pp. 8-14.
Martinez-Vazquez, J., Arze del Granado, J. and Boex, J. (2007). Fighting corruption in the public sector. Contributions to economic analysis, 284.
Amsterdam: Elsevier
OECD (1996). “Ethics in the public service: Current issues and practice,” Public Management Occasional Papers No. 14, Paris.
Paldam, M. (2002). “The cross-country pattern of corruption. Economics, culture and the seesaw dynamics,” European Journal of Political Economy, Vol. 18, pp. 215-240.
Pili, S., Grigoriadis, E., Carlucci, M., Clemente, M. and Salvati, L. (2017).
“Towards Sustainable Growth? A Multi-criteria Assessment of (Changing) Urban Forms,” Ecological Indicators, Vol. 76, pp. 71-80.
Rontos, K., Grigoriadis, S., Sateriano, A., Syrmali, M., Vavouras, I. and Salvati, L. (2016). “Lost in Protest, Found in Segregation: Divided Cities in the Light of the 2015 'Oki' Referendum in Greece,” City, Culture and Society, Vol. 7, No 3, pp. 139-148.
Rontos, K., Salvati, L. and Vavouras, I. (2013). “Socioeconomic and political dimensions of development worldwide,” Sociology and Criminology, vol. 1, No 1, pp. 1-8.
Rose-Ackerman, S. (1999). Corruption and government: causes, consequences, and reform, New York: Cambridge University Press
Rothstein, B. and Teorell, J. (2008). “What is quality of government? A theory of impartial government institutions,” Governance, Vol. 21, No 2, pp. 81-99.
Salvati, L. (2013). “Urban expansion and high-quality soil consumption - an inevitable spiral?” Cities, Vol. 31, pp. 349-356.
Sioussiouras, P., Vavouras, I. (2012). “Political Rights, Development and Corruption in the Balkan and Arab Mediterranean Countries,” Mediterranean Quarterly Journal Vol. 23, pp. 89-103.
Sung, H.-E. (2002). “A convergence approach to the analysis of political corruption: A cross-national study,” Crime, Law and Social Change, Vol. 38, pp. 137-160.
Tanzi, V. (1998). Corruption around the world: Causes, consequences, scope and cures. IMF Working Paper, No. 63.
Tanzi, V. (2000). Policies, Institutions and the Dark Side of Economics, Cheltenham: Edward Elgar
Tiihonen, S. (2003). “Central government corruption in historical perspectives,”
in: Tiihonen, S. (Ed.), The History of Corruption in Central Government.
Amsterdam: IOS Press, pp. 1-36.
Transparency International (2008). Poverty and corruption. Working Paper No.
2/2008.
Transparency International (2010). Corruption perceptions index.
Transparency International (2011). Frequently asked questions about corruption, http://www.transparency.org/news_room/faq/corruption_faq#faqcorr1 Treisman, D. (2000). “The causes of corruption: A cross-national study,” Journal
of Public Economics, Vol. 76, pp. 399-457.
UNDP (2002). Arab human development report.
UNDP (2008). A user’s guide to measuring corruption
UNDP (2009). Human development report 2009: Overcoming barriers: Human mobility and development, New York: Palgrave.
UNDP (2010). Human development report 2010: The real wealth of nations:
Pathways to human development, Palgrave Macmillan, New York
Warren, M.E. (2004). “What does corruption mean in a democracy?” American Journal of Political Science, Vol. 48, No 2, pp. 328-343.
World Bank (1997). World development report 1997, Washington D.C.: Oxford University Press
World Bank (2010a). World development indicators database, 15 December World Bank (2010b). The worldwide governance indicators, 2009 update.
Aggregate indicators of governance 1996-2009. www.govindicators.org Zhang, Y., Cao, L. and Vaughn, M.S. (2009). “Social support and corruption:
Structural determinants of corruption in the world,” Australian and New Zealand Journal of Criminology, Vol. 42, pp. 204-217.
Zitti, M., Ferrara, C., Perini, L., Carlucci, M. and Salvati, L. (2015). “Long-term Urban Growth and Land-use Efficiency in Southern Europe: Implications for Sustainable Land Management,” Sustainability, Vol. 7, No 3, pp. 3359-3385.