DOI: 10.1556/606.2018.13.3.4 Vol. 13, No. 3, pp. 31–40 (2018) www.akademiai.com
THE IMPACT OF BUILDING ORIENTATION ON ENERGY PERFORMANCE: A CASE STUDY IN NEW
MINIA, EGYPT
1 Sara ELHADAD, 2 Bálint BARANYAI, 3 János GYERGYÁK
1 Marcel Breuer Doctoral School, Faculty of Engineering and Information Technology University of Pécs, Boszorkány u. 2, H-7624 Pécs, Hungary
and Department of Architecture, Faculty of Engineering, Minia University 61111 Minia, Egypt, e-mail: sarareda@mu.edu.eg
2 Department of Energy Design, Faculty of Engineering and Information Technology University of Pécs, Boszorkány u. 2, H-7624 Pécs, Hungary
e-mail: balint.baranyai@mik.pte.hu
3 Department of Architecture and Urban Planning, Faculty of Engineering and Information Technology, University of Pécs, Boszorkány u. 2, H-7624 Pécs, Hungary
e-mail: gyergyak.janos@mik.pte.hu
Received 2 January 2017; accepted 24 April 2018
Abstract: The energy consumption of residential buildings represents the majority part of energy usage in Egypt. The aim of this study is to assess the energy performance of a dwelling in New Minia City, Egypt through different orientations. The energy consumption of the case study building is 52560 kWh annually. However, this energy demand could be reduced by 5.8% if the building is oriented to the north direction. The difference of the energy consumption between the best and the worst building orientations, North and South, respectively, reached up to 7.5%. The location of the actual building has a noticeable effect on the energy consumption.
Keywords: Energy consumption, Residential buildings, Energy performance, Orientation, New Minia
1. Introduction
Nowadays the world buildings sector accounted for 40% of total world’s energy consumption, in which the residential buildings are responsible for the two third and the commercial ones for one third, according to the Economic Co-operation and Development Organization (ECDO) [1]. Boake mentioned that buildings are accounted about 40%-70% of global carbon dioxide emissions [2]. Therefore there is a tendency for expectation to reduce the energy consumption by energy efficient building design method to consume less energy all over the world
In Egypt, the energy consumption increases due to growing populations. The energy demand in Egypt has increased by 7.5% per year [3]. This increment is crucial compared to the annual average world’s growth in energy consumption of 2.6% [4];
where the household sector is the biggest consumer of energy contributed by 43.3% [5];
the industry accounted by 28.4%; commercial buildings 10.4%; and the energy used for street lighting and agriculture are equivalent to 4.4% [6]. Energy demand of a building depends on several design factors that can be optimized, like transparency ratio, orientation; shape factor, thermal and physical properties of building materials. Several previous studies investigated that the building orientation is one of the most important parameter for energy efficient design and thermal comfort as the orientation is a primary parameter that has influence on the percentage of sun radiation exposed to the building, on ventilation, on thermal comfort, and on lighting.
Ahmeti et al. [7] studied the energy consumption of the residential sector in city of Prishtina, Kosovo by using the energy management method. Váradi-Varga and Kistelegdi [8] discussed the possibility to apply the energy performance modernization in ‘Squirell Garden’ Nursery School in Csurgó, Hungary by enhancing the comfort level of children and teachers in the nursery school. Baranyai et al. [9] stated the applicability of the ‘Energy design Roadmap’ method for planning smart energy-plus buildings. Kiss and Reith [10] tested the ways of reducing energy consumption in cities through different urban and architectural tools and also, analyzed the possibilities of using renewable energy sources in cities.
Jaber and Ajib [11] assessed the optimal orientation of the building, windows size, thermal insulation thickness for residential building. Morrissey et al. [12] discussed the passive solar design in moderate climates; Friess and Rakhshan [13] studied several measures of passive design to enhance energy efficiency in the United Arab Emirates.
Egypt needs to move towards a more sustainable building design approach to face energy and environmental challenges. It is necessary to develop an integrated strategy, to make buildings consume less energy. Orientation and building envelope are considered one of the most fundamental design features of energy-efficient buildings.
Thus, this paper focused on the effect of building orientation on the energy consumption. Therefore, the main aim of this paper is to analyze and quantify the importance of the building orientation to provide appropriate thermal comfort and high energy performance for the building that lead to reduce the energy consumption of the dwelling. Also, study the impact of the location of the building, especially when the latitude and weather is different through (Cairo, Aswan and Alexandria) on energy consumption.
2. Methodology
2.1. Reviewing the construction materials according to the Egyptian standards
The first stage started by reviewing the material properties of buildings based on the Egyptian standards. Attia S. [14] introduced the thermal properties of Egyptian building materials. Table I shows the composition of building elements used in the case study through building materials, thickness and thermal transmittance coefficient (U-value).
Table 1
Building envelope properties
Element Building Materials Thickness(m) U value (w/(m2*k) External wall 5mm Plaster+25mm Egyptian Portland
cement mortar+ 250mm Double red brick+25mm Egyptian Portland cement
mortar+5mm Plaster
0.31 0.79
Internal wall 5mm Plaster+25mm Egyptian Portland cement mortar+125mm Single red brick+25mm Egyptian Portland cement
mortar+5mm Plaster
0.185 0.95
Internal floor 10mm Concrete tiles+20mm Egyptian Portland cement mortar+50mm
Sand+200mm Plain concrete
0.28 1.824
Roof 10mm Concrete tiles+20mm Egyptian Portland cement mortar+50mm
Sand+20mm Betomine damp insulation+150mm Rein force concrete
0.25 1.71
External floor 10mm Concrete tiles+50mm Sand+20mm Egyptian Portland cement mortar+200mm Plain concrete+250mm
Soil
0.71 1.172
Glazing 20mm Single glazed glass 0.02 5.0
2.2. Conducting a field survey of the existing building
The second stage carried out by conducting field survey in New Minia city, one of the newly constructed cities. The construction of New Minia city has started in 2004, the city is located east of the Nile in front of the old city and 250 km from the capital (Cairo). The total area is about 100 km2 and the urban mass is about 26.5 km2 (residential areas, service, industrial, tourist and recreational). Regarding to the housing sector: the total number of units in the city about 41.544 units about 22.722 units (constructed and under construction) owned by government, About 18.822 residential units were constructed by the private sector, by Government and others.
Fig. 1 presents the different topologies that constructed in the residential buildings of the city.
2.3. Building data
The building analyzed through this paper is located in Minia, Egypt about 250 km from Cairo at latitude 28.08 N, longitude 30.73 E, the case study building is a family house, which was built in 2016. It is a two-story building with a total floor area of 300 m2, with volume 980 m3. It consists of 9 rooms and a courtyard.
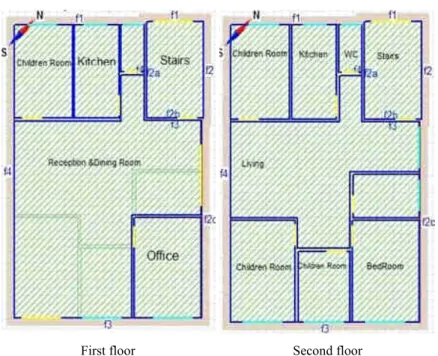
Fig. 2 shows the indication of the room’s distribution and the location of the main entrance in the façade of the floor plan and first floor of the dwelling.
Fig. 1. The different residential typologies in New Minia City
First floor Second floor
Fig. 2. Building zones for first and second floor plan of the dwelling object of study
2.4. Simulation building tool
Among several simulation tools, Indoor Climate and Energy (IDA ICE 4.7) was used to perform the energy simulations and the indoor climate of buildings in this study.
IDA ICE simulation software is licensed; the Faculty of Engineering and Information Technology, University of Pécs has the Educational version for multiple users. IDA ICE is an innovative and trusted whole-year detailed and dynamic multi-zone simulation application for study of thermal indoor climate as well as the energy consumption of the entire building.
Eight simulations were applied by changing the orientation by 45º among them, setting the existing building facade orientation (south-east) as a reference. Fig. 3 represents this procedure. After this the total energy demand for cooling, heating and lighting calculated for each case.
Façade + 0º (S-E) Façade + 45º(S) Façade + 90º(S-W) Façade + 135º(W)
Façade+180º(W-N) Façade + 225º(N) Façade + 270º(N-E) Façade + 315º(E) Fig. 3. Building simulation for each orientation
3. Results and discussion
Energy analysis of the existing situation: The main façade of the building faces south-east. The total delivered energy of the existing building annually was 52560 kWh.
The following Table II shows the delivered energy for the current situation relying on final use. The energy is mostly used for cooling demand by 74.46% of the total delivered energy, secondly heating demand, which represented by 12.20% of total energy and the rest was accounted for 13.34% of total energy.
Table II
Results of the existing situation (façade oriented to S-E) Delivered Energy Existing (S-E), KWh
Lighting 2766
Cooling 39137
Heating 6411
Domestic Hot water 4246
Total 52560
Regarding to the variation of cooling and heating demand during the simulation year, this trend is represented in the following Fig. 4.
As it can be observed in Fig. 4, the majority of the cooling demand accounted from May to October. On the other hand, heating demand represented from November to March.
Fig. 4. Cooling and heating demand during the simulation year
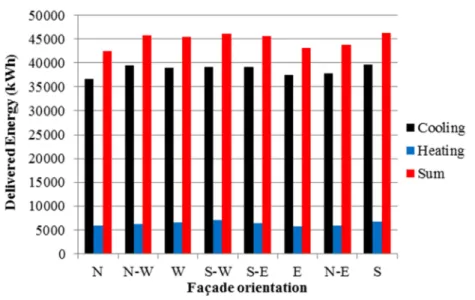
Energy analysis for all orientations: Fig. 5 shows the delivered energy for each orientation, to understand how they vary through varying this parameter.
The results show that only heating and cooling demand change relying on the orientation of the building and very small variation in delivered energy for domestic hot water and lighting with orientation. It can be observed that the highest energy consumption for cooling demand and this agree with climate condition in the case study.
As it is shown in Fig. 6 the total delivered energy for cooling and heating are minimum for northern orientation and the remaining delivered energy are the same for all orientations therefore the optimal orientation related to energy consumption is north Façade. In contrast, south façade represent worst orientation that consumes the largest
W
0.0·10 4 0.5·10 4 1.0·10 4 1.5·10 4 2.0·10 4 2.5·10 4 3.0·10 4 3.5·10 4 4.0·10 4
0 1000 2000 3000 4000 5000 6000 7000 8000
Jan Feb Mar Apr May Jun Jul Aug Sep Oct Nov Dec
From 01/01/2017 to 31/12/2017
amount of energy. In arid climate, in which the cooling demand requires the largest amount of energy the north orientation is more efficient for energy consumption.
Fig. 5. Variation of delivered energy with the façade orientation
Fig. 6. Delivered energy for heating, cooling and the combination of both for each orientation
Table III introduces the differences in delivered energy between the best and existing orientations found for this building.
The difference between optimal and existing orientation is 3052 kWh annually, where the major difference in cooling demand by 2456 out of 3052 about 80 %.
Table III
Difference in delivered energy between N (best) and S-E (existing) orientation Delivered Energy Best (N), kWh Existing (S-E), kWh Difference, kWh
Lighting 2765 2766 -1
Cooling 36681 39137 -2456 (6.7%)
Heating 5816 6411 -595
Domestic Hot Water 4246 4246 0
Total 49508 52560 -3052 (5.8%)
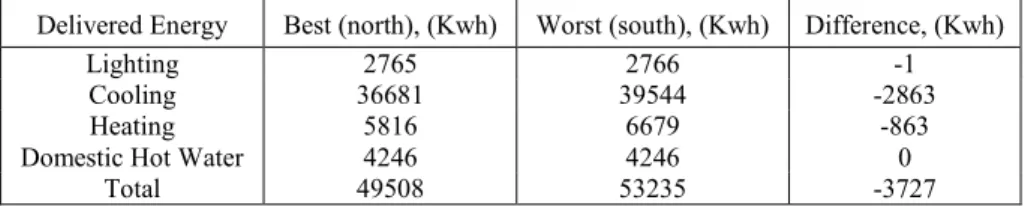
Table IV depicts the differences in energy consumption between the best and worst orientations for this dwelling.
The difference between the best and worst orientation is 3727 kWh for one year which 7.5 % saving in energy consumption, which the major difference in cooling demand by 2863 out of 3727.
Table IV
Difference in delivered energy between N (better) and S (worst) orientation Delivered Energy Best (north), (Kwh) Worst (south), (Kwh) Difference, (Kwh)
Lighting 2765 2766 -1
Cooling 36681 39544 -2863
Heating 5816 6679 -863
Domestic Hot Water 4246 4246 0
Total 49508 53235 -3727
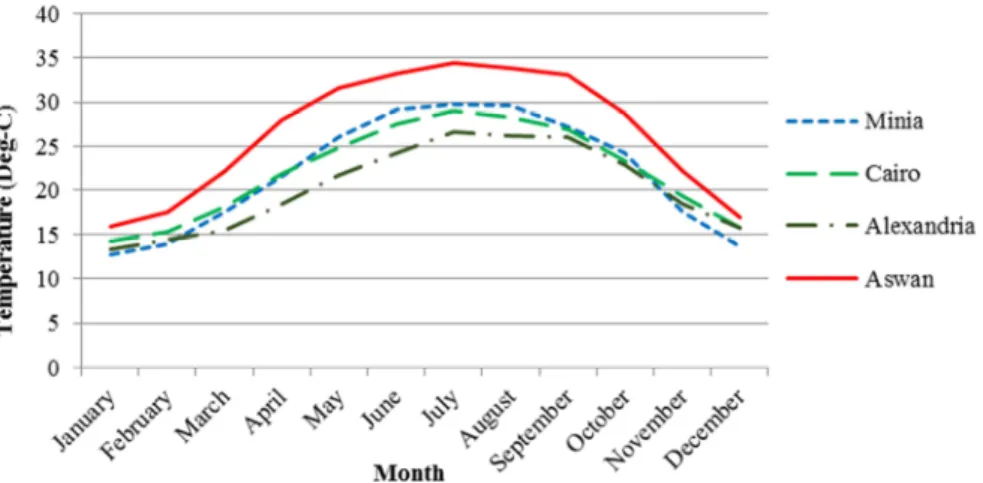
In the next phase of the study the impact of building location on energy consumption was investigated through three different climatic regions: Cairo, Alexandria and Aswan cities as it is shown in Fig. 7 with different latitude 30.1, 31.2 and 24 respectively.
Aswan represents very hot and arid region and Alexandria represents coastal area with more humidity and moderate summer temperatures.
Analysis of energy performance made for 4 locations with different climate condition to achieve all objectives.
As it can be observed in Fig. 8 energy consumption is very much affected by the location of the actual dwelling. Alexandria (coastal area) represents the minima energy consumption by 41906 kWh per year. In contrast, the energy consumption is maxima in Aswan (very hot area) by 91555 kWh per year up to 67 % compared to the case study (Minia city).
4. Conclusion
In hot and arid climate like Egypt, the large portion of energy used to provide cooling, lighting and different equipment of buildings. The building orientation has a noticeable effect on reducing energy consumption of the building.
Fig. 7. Variation of temperature during a year for four cities
Fig. 8. Total delivered energy for different location
In this paper, the results showed that the building orientations mainly lead to reduce cooling demand of building compared with lighting and domestic hot water. The results showed that the optimal orientation was when the building faces north and the worst orientation was when the building faces south. The energy is mostly used for cooling demand by 74.31% of the total delivered energy, the heating demand represented by 12.20% of total energy and the rest of energy demands accounted for 13.34% of total energy.
The research found that the best building orientation can save up to 6.7% in cooling and 5.8% of total energy demand compared with the existing investigated orientation.
Indeed, the difference of energy consumption between the best and the worse orientations can reach 7.8% in cooling and 7.5 % of total energy demand. The location has even more significant effect on energy consumption up to 67% in the investigated cases.
References
[1] Nassief M. M. Evaluation of electricity consumption of a residential flat in Egypt, American Journal of Electrical Power and Energy Systems, Vol. 3, No. 2 2014, pp. 7−44.
[2] Boake T. M. What is sustainable design? Part One: Building an Environmental Ethic.
School of Architecture University of Waterloo, Waterloo, Canada, 2009.
[3] Annual Report 2011/2012, MOEE, Egyptian Electricity Holding Company, Egypt, 2013.
[4] Setiawan, A., Huang, T.-L., Tzeng, C.-T., & Lai, C.-M. The effects of envelope design alternatives on the energy consumption of residential houses in Indonesia, Energies, Vol. 8, No. 4, 2015, pp. 2788‒2802.
[5] Annual Report, EEHC, Egyptian Electricity Holding Company, 2013/2014
[6] Hanna G. B. Energy analysis for new office buildings in Egypt, International Journal of Science and Research, Vol. 4, No. 1, 2015, pp. 554‒560.
[7] Ahmeti P., Dalipi I., Basha A., Kistelegdi I. Current heating energy demand by the residential sector in city Prishtina based on the main resources, Pollack Periodica, Vol. 12, No. 1, 2017, pp. 147‒158.
[8] Váradi-Varga O., Kistelegdi I. The energy modernization of Mókuskert nursery school in Csurgó, Pollack Periodica, Vol. 9, No. 1, 2013, pp. 151‒161.
[9] Baranyai B., Póth B., Kistelegdi I. Planning and research of smart buildings and constructions with the ‘Energydesign Roadmap’ method, Pollack Periodica, Vol. 8, No. 3, 2013, pp. 15‒26.
[10] Kiss I., Reith A. Architectural and urban design tools for reducing energy consumption in cities, Pollack Periodica, Vol. 8, No. 3, 2013, pp. 151‒161.
[11] Jaber S., Ajib S. Optimum, technical and energy efficiency design of residential building in Mediterranean region, Energy and Buildings, Vol. 43, No. 8, 2011, pp. 1829–1834.
[12] Morrissey J., Moore T., Horne R, E. Affordable passive solar design in a temperate climate:
An experiment in residential building orientation, Renewable Energy. Vol. 36, No. 2, 2011, pp. 568‒577.
[13] Friess W., Rakhshan K. A review of passive envelope measures for improved building energy efficiency in the UAE, Renewable and Sustainable Energy Reviews, Vil. 72, 2017, pp. 485‒496.
[14] Attia S., Vanas O. The database of Egyptian building envelopes: a database for building energy simulations, Fifth National Conference of IBPSA-USA on Building Performance Simulation, Madison, Wisconsin, USA, 1-3 August 2012, pp. 96‒103.