& Chemical Gardens
Magnetic-Field-Manipulated Growth of Flow-Driven Precipitate Membrane Tubes
Djra Tak#cs,
[a]G#bor Schuszter,
[a]D#niel Sebo˝k,
[b]]kos Kukovecz,
[b]Dezso˝ Horv#th,
[c]and ]gota Tjth*
[a]Abstract:Chemobrionics is an emerging scientific field fo- cusing on the coupling of chemical reactions and different forms of motion, that is, transport processes. Numerous phe- nomena appearing in various gradient fields, for example, pH, concentration, temperature, and so on, are thoroughly investigated to mimic living systems in which spatial separa- tion plays a major role in proper functioning. In this context, chemical garden experiments have received increased atten- tion because they inherently involve membrane formation
and various transport processes. In this work, a noninvasive external magnetic field was applied to gain control over the directionality of membrane structures obtained by injecting one reactant solution into the other in a three-dimensional domain. The geometry of the resulted patterns was quanti- tatively characterized as a function of the injection rate and the magnitude of magnetic induction. The magnetic field was proven to influence the microstructure of precipitate tubes by diminishing spatial defects.
Introduction
Complex precipitation patterns and instabilities can be ob- tained by coupling precipitation reactions and diffusion.[1–3]
However, a higher level of hierarchy and a better control on the system may be achieved by introducing other transport processes, such as osmosis, migration, or convection. In this context, the growth of three-dimensional inorganic silicate pre- cipitate tubes, so called chemical gardens is focused from many different aspects.[4]To gain a better control on tube di- ameter and reactant composition, the traditional salt-dissolu- tion method has been first replaced by active injection.[5] The quality of the structures could be further improved by apply-
ing bubble-guidance where the enhanced buoyancy contribu- tion leads to straight tubes.[6] Composite precipitate mem- branes have also been produced, which may pave the way toward applications in heterogeneous catalysis.[7] Chemical garden patterns can be also achieved in the absence of silicate ions. The copper(II)-phosphate system has been extensively studied, and a phase diagram that maps compositions at which precipitate membrane tubes grow vertically at a con- stant rate has also been obtained.[8]Such membrane structures have facilitated the determination of osmotic contribution during the tube growth, which also provides a procedure to compare the permeability of membranes composed of differ- ent chemical elements.[9]
Flow-driven precipitation patterns are also investigated in horizontally and radially propagating systems. If the host liquid layer is sufficiently deep, buoyancy plays an important role in determining product properties, for example, the thermody- namically unstable polymorph of a given chemical compound can be synthesized.[10] As an alternative possibility, confining the system helps in reducing buoyancy contribution, which gives rise to more pronounced manifestation of chemical char- acter dependent product properties.[11–15]
To go one step further on the way of controlled synthesis of complex precipitation patterns, the application of an external driving force is a tempting possibility. Optical control, for ex- ample, has been utilized by Cooper et al.[16]to develop the de- sired polyoxometalate-based microtubes for which the major driving force is the local convection arising from the laser as a local heat source. In this context, manipulating with a magnet- ic field may provide the advantages of an easily adjustable field strength and direction, whereas it is noninvasive, but sen- sitive to composition-dependent magnetic susceptibility. Also, magnetic field may affect chemical equilibria and crystallization [a]D. Tak#cs, G. Schuszter, ]. Tjth
Department of Physical Chemistry and Materials Science University of Szeged
Rerrich B8la t8r 1., Szeged, 6720 (Hungary) E-mail: atoth@chem.u-szeged.hu [b]D. Sebo˝k, ]. Kukovecz
Interdisciplinary Excellence Center
Department of Applied and Environmental Chemistry University of Szeged
Rerrich B8la t8r 1., Szeged, 6720 (Hungary) [c] D. Horv#th
Department of Applied and Environmental Chemistry University of Szeged
Rerrich B8la t8r 1., Szeged 6720 (Hungary)
The ORCID identification number(s) for the author(s) of this article can be found under:
https://doi.org/10.1002/chem.201902830.
T 2019 The Authors. Published by Wiley-VCH Verlag GmbH & Co. KGaA.
This is an open access article under the terms of Creative Commons Attri- bution NonCommercial-NoDerivs License, which permits use and distribu- tion in any medium, provided the original work is properly cited, the use is non-commercial and no modifications or adaptations are made.
steps. Homogeneous chemical reaction propagation fronts, such as the cobalt(II)-catalyzed auto-oxidation of benzalde- hyde, were already investigated in the presence of an en- hanced magnetic field. In that particular system, the direction of the magnetic induction could be adjusted in such a way as to repel the product of the reaction and, thus, lead to hindered diffusion and slowed front propagation.[17,18]The front propa- gation speed of an other prominent reaction, the Belousov–
Zhabotinsky-reaction was also investigated in a magnetic field, and the magnet caused acceleration and deceleration mani- fested also in the shape of the front.[19]The magnetic field de- pendent diffusion of paramagnetic ions can be applied for the separation of solutes; also, labeled living cells can be sorted this way.[20–22]
Not only solutes and cells, but also entire jets of conducting liquids can be directed within the framework of magnetohy- drodynamics. Furthermore, if a precipitation reaction is taking place between the reactant solutions the motion of which is manipulated by magnetic field, solid 3D structures may be ob- tained with tailored properties. Traditional salt dissolution based chemical garden experiments have been performed in cylindrical test tubes placed in magnetic field (superconduct- ing magnet, 5–15 T) and the resulted precipitate tubes grew upward helically.[23,24] The chirality of the pattern could be switched by inverting the position of magnetic poles. Consid- ering that the zinc(II) and magnesium(II) salts applied are dia- magnetic, the evolution of the helical structures is explained on the basis of the boundary-assisted magnetohydrodynamics, in which the Lorentz force acts on the rising solution and indu- ces convection, the direction of which depends on the orienta- tion of the boundary and the magnetic field.
In this study, we investigate the chemical-garden-type tube growth in two different chemical systems, namely gadolinium- carbonate and gadolinium-phosphate systems in an inhomo- genenous static magnetic field. We quantify the effect exerted by a permanent bar magnet on the tubes obtained upon injec- tion. The role of chemistry is also addressed in a way that the results gained when applying different injection rates and magnetic fields are explained on the basis of membrane rigidi- ty and reaction rate.
Results and Discussion
Phase diagrams and quantitative pattern characterization Several precipitation patterns can be obtained depending on the density difference (D1=1host@1injected) of the reactant solu- tions when one liquid is injected into the other one in a 3D re- actor. The phase diagram of such precipitation patterns tradi- tionally depicts characteristic pattern regimes as a function of the reactant concentrations as shown in Figure 1. In the regime marked with blue triangles, D1,0 leads to patterns spreading on the bottom of the reactor, because buoyancy is not sufficiently strong to help the evolution of an upward growing pattern. Although a slight increase of D1already re- sults in a vertically growing precipitate structure (orange dia- monds in Figure 1), tubes with regular diameter can only be
achieved by maintaining a sufficiently large density difference (red squares in Figure 1). Further increased D1, however, may cause oscillatory breakage of the pattern (popping regime[5]in- dicated with green bullets in Figure 1) because buoyant force overcomes the tensile strength of the precipitate membrane.
The arrangement of phases is a function of the injection rate (Q) as well, considering that an enhanced upward flow cooper- ating with buoyancy can lead to the breakage of the structure.
Therefore, to reproducibly grow gadolinium phosphate precipi- tate tubes, 0.05mGdCl3and 0.3mNa3PO4solutions were used at low flow rates (0<Q<10 mLh@1,D1=0.0441 gcm@3), while 0.15MGdCl3and 0.5MNa3PO4solutions are used at high flow rates (30<Q<240 mLh@1,D1=0.0547 gcm@3). Within the con- centration range spanned for the gadolinium phosphate system, gadolinium carbonate always provides nicely growing precipitate tubes. To compare the results obtained for the two different chemical systems, [Gd3+] and also buoyancy contribu- tion are kept constant by choosing such CO32@ concentrations that the density difference between the host (Na3PO4 or Na2CO3) and the injected (GdCl3) solutions remains equal in the two systems. The selected range of flow rates (1<Q<
240 mLh@1) creates a laminar flow within the precipitate tube and in the liquid jet, characterized by Reynolds numbers be- tween 1 and 100.
For a quantitative pattern characterization, the linear growth rate (rl) and the outer diameter (d) of the tubes are measured at different injection rates for the two chemical systems. The tube diameter is found to be independent of Q in both sys- tems, although the gadolinium phosphate tubes exhibit nar- rower distribution (0.7–0.8 mm) for the parameter, unlike the gadolinium carbonate tubes where it varies between 0.4 and 0.9 mm. The difference in diameter distribution can be ex- plained by taking the mechanical properties of the formed tubes into account. The visual observation of the samples re- moved from the liquid reveals that, in Na3PO4 host solution, Gd3+ ions yield a rigid precipitate membrane, which confines the injected liquid more effectively and leads to smaller fluctu- ations in the diameter, whereas in Na2CO3host solution a more flexible membrane develops, allowing for larger variation. With sodium phosphate host solution, r1 is a linear function of Q, Figure 1.Phase diagram of precipitation patterns in the gadolinium-phos- phate system atQ=5 mL h@1. Horizontal spreading (~), irregular (^) and reg- ular (&) tube growth, and popping (*) regimes are indicated as well.
whereas it is only weakly dependent on Q for the carbonate system. The volume increase rate of the precipitate tubes (rV) is calculated from the measured tube diameter, which remains constant as the structure evolves during an experiment, and the linear growth rate as rV=rl(d/2)2p and it is plotted as a function ofQ in Figure 2. It is found thatrVis smaller than Q with one order of magnitude because the tip of the tube is open; thus, the jet of the injected solution rises up freely during the membrane growth and forms a precipitate on the upper surface of the host solution as it spreads. Injection rates significantly higher than volume increase rates also mean that the osmotic contribution is negligible under the experimental conditions maintained.
Before explaining further how the effect of injection rate and magnetic field can be quantified according to our tube growth experiments, the spatial distribution of magnetic in-
duction (B) must be explored within the region of interest, that is, in the spatial domain in which the reactor is placed relative to the magnet. After separately measuring thexandzcompo- nents of B, they are combined by vector addition and the result is plotted in Figure 3. It can be concluded from Fig- ure 3a thatBis quasi constant along thexaxes at a given dis- tance from the magnet within the experimentally relevant spa- tial domain, that is, there is no significant change in the mag- netic field along the tube growth direction. The decay of B with increasing distance (z) at the equator of the bar magnet can be described by Equation (1)
B¼ m0M
4p½l2þz2A3=2 ð1Þ
considering the measured data points (solid line in Figure 3b), in whichm0,M, andlare the permeability of vacuum, magneti- sation, and the length of the magnet, respectively. Equation (1) is derived from the concept of magnetism, that is,M~B,[25] by taking simple geometrical considerations into account to ad- dress the effect of a varying magnet distance. Magnetic induc- tion B decays rapidly with increasing distance from the magnet, thus tube growth experiments must be conducted in
a reactor placed close to it (~0–2 cm) to ensure detectable ef- fects.
When the tube growth experiment is carried out in the mag- netic field detailed above, the otherwise vertically growing pre- cipitate tube shows a tendency to grow towards the magnet.
Contact height (h), which is defined as the vertical distance be- tween the tip of the injection needle and the contact point of the precipitate tube and the reactor wall, is used to quantify the magnetic field effect (see Figure 4c). In the liquid jet, ions are transported mainly by advection, nevertheless Lorentz force alone is not expected to play a major role in shaping the patterns, because a significant separation between the anion and the cation of the injected solution does not build up.
However, the growing precipitate creates a new boundary forming a confined space, in which the mutual effect of boun- dary and magnetohydrodynamics has been known to lead to helical structures of chemical garden tubes, for which the Lor- entz force is responsible in the pattern formation.[23,24]We have therefore performed experiments to systematically decouple the effects of Lorentz force, paramagnetism, and precipitation, whereas buoyancy contribution and injection rate (Q= 60 mL h@1) were kept constant. In the first scenario, to test how important the Lorentz force is, AlCl3solution (0.3m) is injected into a Ca(NO3)2host solution (0.79m,D1=0.0579 gcm@3). Alu- minum and gadolinium form trivalent hydrated ions in aque- Figure 2.Volume increase rate (rV) as a function of injection rate (Q) for ga-
dolinium phosphate (*) and carbonate precipitate tubes (&). Composition:
[GdCl3]=0.05M, [Na3PO4]=0.30M, [Na2CO3]=0.54 M.
Figure 3.(a) Two-dimensional plot of magnetic inductionB(inscribed values in Tesla) as a function of distance from the side of the magnet taken at a plane going through the vertical center line of the reactor. (b) One-dimen- sional plot ofBtaken at the center ofx–yside of the magnet, that is, at the center ofxaxis in (a).
ous solution, thus the force exerted by the magnetic field on moving charged particles is the same in both cases. Also, Al3+
ions do not give precipitate with NO3@ ions. It is seen in Fig- ure 4a that the injected jet (visualized by methyl red indicator,
<0.2 vol%) rises up without any change in direction, thus we can conclude that Lorentz force has no contribution in chang- ing the tube orientation. In the second case, GdCl3 solution (0.15m) is injected into a Ca(NO3)2host solution (0.79m,D1=
0.0555 gcm@3), thus the effect of paramagnetism is present in the system in the absence of precipitation. The injected jet (vi- sualized by bromocresol green indicator,<0.2 vol%) is promi- nently attracted towards the magnet. The effect can be quanti- fied by measuring h that reaches a constant value typically after a transient period of a few seconds (time sequence of images in Figure 4d captured at Q=1 mLh@1). In the last sce- nario, when both paramagnetism and precipitate formation are present in the experiment, the GdCl3solution (0.15m) is in- jected into the Na3PO4 host solution (0.5m, D1=
0.0547 gcm@3). It can be concluded from Figure 4c, that the jet is attracted towards the magnet similarly to that seen in Fig- ure 4d(7 s), buthcannot change anymore because the precipi- tate tube forms shortly after the contact of the two reactants.
Therefore, paramagnetism seems to be the major contributor in modifying hydrodynamics during the tube attraction and an appropriately fast precipitation may help to preserve the
shape by confining the fluid flow within a more or less rigid membrane.
Effect of flow rate on tube growth
To investigate howhdepends on the coupling of hydrodynam- ics and precipitation in the presence of magnetic field, experi- ments are performed at fixed magnet–reactor configuration maintaining the smallest possible distance between them, whereas Q is systematically varied for three different cases. As a reference case without involving any precipitation, Gd3+ so- lution with 0.2 vol% bromocresol indicator was injected at low flow rates (1<Q=10 mL h@1). The contact height increases in conjunction with Q, because a faster stream carries a larger momentum, thus the jet cannot be attracted as easily towards the magnet (green triangles in Figure 5a). In the gadolinium phosphate system, however, h decreases with increasing Q (black bullets in Figure 5a) which is counterintuitive. Also, the
contact height measured at the lowest injection rate is signifi- cantly greater than the one corresponding to the indicator system. Such results can be understood by comparing the rate of injection to that of reaction. In flow-driven precipitation sys- tems, an enhanced flow preferably leads to membrane forma- tion for a given chemical composition. This is caused by the better mixing between the reactants in the vicinity of the reac- tion zone and thus a larger number of precipitate nuclei is pro- duced. Those colloid nuclei are linked through van der Waals interactions and are able to form coherent precipitate mem- branes.[15]IfQis sufficiently low, the slowly growing membrane Figure 4.Demonstration of the effects of the Lorentz force (a), paramagnet-
ism (b), and precipitation coupled to paramagnetism (c). Contact height (h) and its time evolution in parts (c) and (d), respectively. The magnet was placed next to the reactor and its position is indicated by red rectangles on the left.
Figure 5.Contact height (h) as a function of injection rate (Q) for low (a) and high (b) values for gadolinium phosphate (*) and carbonate (&) precipitate tubes, and for indicator system without precipitation (~). Composition:
[GdCl3]=0.05m, [Na3PO4]=0.30m, [Na2CO3]=0.54m(a); [GdCl3]=0.15m, [Na3PO4]=0.5m, [Na2CO3]=0.9m(b).
partially follows the stream line but also forces it to tilt towards the magnet in a smoother manner, thushbecomes larger than it would have been without the precipitate. This effect, there- fore, depends also on the flexibility of the membrane; more rigid membrane leads to largerh.IfQincreases, the precipitate nuclei composing the membrane are formed earlier and in a larger number thus the upward shift of the stream line is re- stricted. The higher the injection rate is, the more pronounced the restriction is which leads to lower h as presented with the black bullets in Figure 5a. Finally,his independent ofQfor the gadolinium carbonate system and its value is equal to that for the indicator system at the lowest injection rate (red squares in Figure 5a). As previously mentioned, carbonate robustly forms precipitate membranes within the entire concentration range spanned for the phosphate system. Moreover, the wall of gadolinium carbonate membranes is much thinner than in the case of phosphate; thus, they cannot be collected from the reactor after the experiments because they fall apart upon removal of the host solution. These facts allow us to assume that the structure of the thin gadolinium carbonate mem- branes is only slightly dependent on the flow conditions and, thus, no trend is found for the contact heights.
The effect of flow rate onhis also investigated at a signifi- cantly higher regime (30<Q<240 mL h@1) to see how the sys- tems behave when hydrodynamics dominates over precipita- tion. To obtain membranes sustaining such high flow rates, re- actant concentrations have been increased, as indicated in the Experimental Section. This also means that h–Q trends ob- served for low and high flow rates are comparable, unlike the absolute values ofh. It is found that, although h increases in conjunction with Q for each system, the membrane still re- stricts the upward shift of the jet because the systems involv- ing precipitation depict significantly lower contact heights (Fig- ure 5b). Therefore, hydrodynamics dominates the system at sufficiently high injection rates and the slight change of the flexibility and time evolution of the membrane upon enhanced mixing cannot lead to decreasinghvalues as observed for low injection rates.
Effect of magnetic field on tube growth
To investigate the effect of magnetic field on tube growth, the distance between the reactor and the magnet was varied from one experiment to the other, whereas the injection rate (Q=
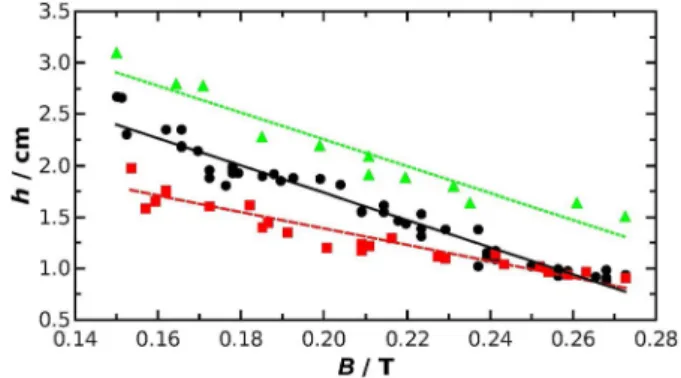
60 mL h@1) and reactant concentrations were kept constant at values applied in the high injection rate regime. The exact dis- tance between the magnet and the injection needle is deter- mined on the basis of the recorded images for each separate experiment. The substitution of such distances into the equa- tion of B–z curve obtained upon fitting Equation (1) leads to precise magnetic induction values for each tube growth ex- periment. The measured contact heights are plotted as a func- tion ofBin Figure 6 for the three different systems. As the re- actor is placed farther from the magnet, that is, B becomes lower,hlinearly increases for each case; the fitted lines are de- scribed by Equations (2)–(4):
ðh=cmÞ ¼ @ð13:2:0:5Þ ðB=TÞ þ ð4:4:0:1Þ,R2¼0:949 ð2Þ ðh=cmÞ ¼ @ð8:0:0:6Þ ðB=TÞ þ ð3:0:0:1Þ,R2¼0:897 ð3Þ ðh=cmÞ ¼ @ð13:0:1:0Þ ðB=TÞ þ ð4:9:0:3Þ, R2¼0:913 ð4Þ for phosphate, carbonate, and indicator system, respectively.
The slopes are the same within experimental errors for the indicator and phosphate systems because the precipitation is slow compared to the flow and, thus, paramagnetic attraction plays the major role. In the case of carbonate, for which pre- cipitation is fast, contact height decreases less steeply. At a given distance, that is, magnetic induction,his the highest for the indicator system because there is no precipitate membrane which could restrict the upward shift of the jet. If precipitation formation takes place in the experiment, the faster appearing membrane can restrict more effectively the jet. Considering that the precipitation of gadolinium phosphate is slower than the formation of gadolinium carbonate, one would expect higher contact height for the phosphate than for the carbon- ate system, which is in fact the case (see Figure 6). This effect of reaction rate diminishes with increasing B because h be- comes similar for the two precipitation systems.
Postsynthetic precipitate characterization
To reveal the effects of the induced flow and the applied mag- netic field on the microstructure and the chemical element dis- tribution of the precipitates obtained for the gadolinium-phos- phate system, samples have been collected from experiments either in batch or under flow conditions in the presence and absence of the magnetic field. Gadolinium-carbonate system could not be examined this way because the precipitate tubes fell apart upon removing the host solution from the reactor which again highlights how thin membranes are produced.
Figure 7 represents a selection of images recorded by scanning electron microscopy (SEM) and X-ray microtomography (mCT) instruments for experiments with 0.15 M GdCl3 and 0.5M NaPO4 solutions at Q=60 mL h@1; the reactor is placed right next to the magnet. In the well-stirred batch system, no sign of membrane structure is found but the precipitate forms poly- Figure 6.Contact height (h) as a function of magnetic induction (B) for ga- dolinium phosphate (*) and carbonate (&) precipitate tubes, and for indica- tor system without precipitation (~). Composition: [GdCl3]=0.15m, [Na3PO4]=0.5m, [Na2CO3]=0.9 M.
crystalline globules with a characteristic diameter of a few hun- dred nanometers (Figure 7a). However, if flow is introduced in the system by injecting one reactant into the other one, mac- roscopic membrane tubes grow which emphasizes the impor- tance of spatial gradients during synthesis methods because they prominently determine the product properties. Panel b) of Figure 7 depicts images of the precipitate membrane pro- duced in the absence of an external magnetic field.
The outer surface of the tube is smooth and homogeneously structured (Figure 7b.1 and 7b.3), unlike the interior part, which features numerous defects that are simultaneously re- vealed by SEM applied for damaged tube surface and by mCT for unharmed tube sections; Figure 7b.1 and 7b.2, respective- ly. The defects provide some insights into the microstructure of the underlying precipitate layers, in which polygonal sheet-
like entities are found in a large amount, which significantly differ from the other parts of the interior membrane surface (Figure 7b.4). When the same tube growth experiment is per- formed in the presence of magnetic field, significant difference is observed in the microstructure. Although the outer surface of the tube resembles that without magnet (Figure 7c.2), the interior part is smooth on the macroscale; there is no sign of defects over the 2.5 mm length of the sample (Figure 7c.1).
This may be attributed to the ordering magnetic force on the paramagnetic membrane, which weakens the effect of thermal fluctuations. Taking a closer view on the interior surface reveals a microstructure similar to that observed in between the seg- mentations of the tubes grown in the absence of a magnetic field (Figure 7c.3).
No characteristic difference in the chemical element distribu- tion has been found independently of the presence or absence of an external magnetic field, although the precipitate mem- branes have been investigated also by energy dispersive X-ray spectroscopy (EDX). This may be interpreted as the magnetic induction, despite being maintaned sufficiently large to attract the injected jet, cannot induce the spatial enrichment of the paramagnetic solute during the time scale of precipitation and it does not lead to differentiated crystal growth.
Conclusion
Membrane growth experiments were performed by injecting the solution of a paramagnetic solute containing Gd3+ ions into either a sodium carbonate or a phosphate solution to in- vestigate the effect of the magnetic field on the resulting pre- cipitate tubes. The vertically growing membranes were charac- terized by determining their outer diameter and linear growth rate. The diameter was found to be independent of the injec- tion rate for both chemical systems and the tubes were open at the tip as they evolved; thus, the osmotic contribution is not significant in the growth mechanism. Upon application of an inhomogeneous static magnetic field, the tubes were at- tracted towards the magnet, which was quantified by measur- ing the contact height as a function of injection rate and mag- netic induction. We have proven that the Lorentz force has no effect on the pattern, whereas paramagnetism and precipita- tion are the most prominent driving forces under the magnetic field provided by a permanent bar magnet. When the injection rate is slow compared to that of the chemical reaction, rigid precipitate membrane confines the fluid jet and raises the con- tact height. When the injection is sufficiently fast, the upward shift of the jet attracted toward the magnet is restricted by the evolving membrane. The gadolinium phosphate system pro- vided stable precipitate structures, unlike the gadolinium car- bonate system; thus, the phosphate membranes were used for the microstructure analysis. Although polycrystalline globules were produced in batch, the spatial gradients introduced by the injection resulted in the formation of membranes. The outer surface of such membranes were similar independently of the magnetic field effect, but the interior part of magnetical- ly guided tubes exhibited a much more ordered structure than that formed without the magnetic field. Finally, under the Figure 7.SEM andmCT (b.2 and c.1) images of gadolinium phosphate pre-
cipitate obtained in batch (a) and under flow conditions in the absence (b) and in the presence (c) of an external magnetic field.
maintained experimental conditions, no characteristic spatial arrangement of chemical element distribution was found, de- spite the flow and magnetic field applied. Considering that the intensity and the orientation of a magnetic field can be readily controlled, we believe that studying the membrane growth in the presence of a magnetic field as a noninvasive exterior driv- ing force is a promising path towards the improvement of product properties and, thus, the applicability of artificial chemical gardens.
Experimental Section
Methods
To grow precipitate tubes upon injection, the experiments were re- alized in a vertically positioned rectangular reactor with inner di- mensions of 1V1x10 cm constructed from 2-mm thick Plexiglass sheets as shown in Figure 8. The reactor was first filled with a host solution of either trisodium phosphate (Na3PO4·12H2O, 0.05–0.5m) or sodium carbonate (Na2CO3, 0.3–0.9m) upto a constant solution height (7.5 cm). The gadolinium(III) chloride solution (GdCl3·6H2O, 0.05–0.2M) is injected from below by a syringe pump (KdScientific 180) at various constant volumetric flow rates (Q, 1–240 mLh@1)
through a needle (inner diameter=0.5 mm; outer diameter= 0.8 mm) placed in the center of the bottom of the reactor. The needle slightly penetrated into the host solution to provide an ap- propriate basis for the precipitate tube to grow. Although the reac- tant concentrations were varied from one experiment to the other, conditions were maintained so that the injected solution is always less dense than the host electrolyte, thus buoyancy helps the upward growth of the tubes. The density of the reactant solutions has been measured by a density meter (Anton Paar DMA 500) with 10@4gcm@3precision.
To investigate what effect the magnetic field exerts on the tube formation under flow conditions, a permanent bar magnet (NiCuNi patented NdFeB core, 10V4x2 cm) was placed at different distan- ces along the z axis from the reactor so that the solution that leaves the needle upon injection is already in the vicinity of the magnet (see Figure 8). The characterization of the magnetic field was performed by measuring the spatial distribution of magnetic induction (B) in the zone where the reactor has been placed. A Hall effect sensor connected to a Gauss meter (AlphaLab GM2) was placed on a positionable table andBis measured in a region of 20V20V25 mm with 2 mm spatial resolution in each dimension.
Also, considering thatBis a vector quantity,xand zcomponents perpendicular to the magnetic force lines were determined.
Each tube growth experiment was performed at room tempera- ture, recorded by using a black and white digital camera (UniBrain), and reproduced at least three times. The growth rate and the tube diameter were determined by a gray-scale-based in-house soft- ware. The tubes obtained were collected from the reactor, washed with deionized water, and dried under ambient conditions. For postsynthetic characterization, scanning electron microscopy (SEM, Hitachi S-4700, 20 kV accelerating voltage, gold coating) was em- ployed to reveal the microstructure properties, energy dispersive X-ray spectroscopy (EDX, Rçntec QX2, 20 kV accelerating voltage) was used to investigate the spatial distribution of the chemical ele- ments incorporated, and X-ray microtomography (mCT, Bruker Sky- scan 2211, 70 kV accelerating voltage, nanofocusing mode, 1808 total rotation with 0.28 resolution, 2 s exposition time, averaging on two images) is applied to reveal the entire 3D structure of the samples.
Acknowledgements
This work was financially supported by the National Research, Development and Innovation Office (K119795), GINOP-2.3.2-15- 2016-00013, and M-ERA.Net-4248-MaSNEC projects. D.S. and ].K. acknowledge the support of GINOP-2.3.3-15-2016-00010.
This paper was also supported by the UNKP-18-4 New National Excellence Program of the Ministry of Human Capacities (D.S.).
Conflict of interest
The authors declare no conflict of interest.
Keywords: chemical gardens·magnetic properties·materials science·nonequilibrium processes·self-assembly
[1] M. Dayeh, M. Ammar, M. Al-Ghoul,RSC Adv.2014,4, 60034–60038.
[2] B. Dfflzs, I. Lagzi, I. Szalai,Langmuir2014,30, 5460 –5465.
[3] E. Tjth-Szeles, ]. Tjth, D. Horv#th,Chem. Commun.2014,50, 5580 – 5582.
[4] L. M. Barge, S. S. S. Cardoso, J. H. E. Cartwright, G. J. T. Cooper, L. Cronin, A. De Wit, I. J. Doloboff, B. Escribano, R. E. Goldstein, F. Haudin, D. E. H.
Jones, A. L. Mackay, J. Maselko, J. J. Pagano, J. Pantaleone, M. J. Russell, C. I. Sainz-Diaz, O. Steinbock, D. A. Stone, Y. Tanimoto, N. L. Thomas, Chem. Rev.2015,115, 8652– 8703.
[5] S. Thouvenel-Romans, O. Steinbock,J. Am. Chem. Soc.2003,125, 4338 – 4341.
[6] S. Thouvenel-Romans, J. J. Pagano, O. Steinbock, Phys. Chem. Chem.
Phys.2005,7, 2610 –2615.
[7] L. Roszol, O. Steinbock, Phys. Chem. Chem. Phys. 2011, 13, 20100 – 20103.
[8] ]. Tjth, D. Horv#th, R. Smith, J. R. McMahan, J. Maselko,J. Phys. Chem.
C2007,111, 14762 –14767.
[9] E. Rauscher, G. Schuszter, B. Bohner, ]. Tjth, D. Horv#th,Phys. Chem.
Chem. Phys.2018,20, 5766– 5770.
[10] B. Bohner, G. Schuszter, O. Berkesi, D. Horv#th, ]. Tjth,Chem. Commun.
2014,50, 4289 –4291.
[11] F. Haudin, J. H. E. Cartwright, A. De Wit, J. Phys. Chem. C 2015, 119, 15067– 15076.
[12] F. Haudin, V. Brasiliense, J. H. E. Cartwright, F. Brau, A. De Wit, Phys.
Chem. Chem. Phys.2015,17, 12804 –12811.
[13] B. C. Batista, O. Steinbock,J. Phys. Chem. C2015,119, 27045 –27052.
[14] Q. Wang, M. R. Bentley, O. Steinbock, J. Phys. Chem. C 2017, 121, 14120 –14127.
Figure 8.Sketch of the experimental setup. The positions of two opposing poles of the bar magnet are indicated with red (north) and blue (south) colors.
[15] E. Balog, K. Bittmann, K. Schwarzenberger, A. De Wit, G. Schuszter,Phys.
Chem. Chem. Phys.2019,21, 2910.
[16] G. J. T. Cooper, R. W. Bowman, E. P. Magennis, F. Fernandez-Trillo, C.
Alexander, M. J. Padgett, L. Cronin, Angew. Chem. Int. Ed. 2012, 51, 12754 –12758;Angew. Chem.2012,124, 12926 –12930.
[17] E. Boga, S. K#d#r, G. Peintler, . Nagyp#l,Nature1990,347, 749– 751.
[18] E. Boga, G. Peintler, I. Nagyp#l,J. Am. Chem. Soc.1990,112, 151 –153.
[19] R. Nishikiori, S. Morimoto, Y. Fujiwara, A. Katsuki, R. Morgunov, Y. Tani- moto,J. Phys. Chem. A2011,115, 4592 – 4597.
[20] M. Fujiwara, K. Mitsuda, Y. Tanimoto,J. Phys. Chem. B2006,110, 13965 – 13969.
[21] Z. Lei, B. Fritzsche, K. Eckert,J. Phys. Chem. C2017,121, 24576– 24587.
[22] M. Zborowski, L. Sun, L. R. Moore, P. S. Williams, J. J. Chalmers,J. Magn.
Magn. Mater.1999,194, 224–230.
[23] I. Uechi, A. Katsuki, L. Dunin-Barkovskiy, Y. Tanimoto,J. Phys. Chem. B 2004,108, 2527 – 2530.
[24] W. Duan, S. Kitamura, I. Uechi, A. Katsuki, Y. Tanimoto,J. Phys. Chem. B 2005,109, 13445–13450.
[25] R. P. Feynman, R. B. Leighton, and M. Sands,The Feynman Lectures on Physics, 6th printing, Addison-Wesley Publishing Company, Massachu- setts,1977.
Manuscript received: June 20, 2019 Accepted manuscript online: August 9, 2019 Version of record online: October 9, 2019