ASSESSING THE MICROBIAL COMMUNITIES INHABITING DRINKING WATER NETWORKS AND NITRIFYING ENRICHMENTS WITH SPECIAL
RESPECT ON NITRIFYING MICROORGANISMS
ZSUZSANNANAGYMÁTÉ*, KATALIN NEMES-BARNÁS, GERGELYKRETTand KÁROLYMÁRIALIGETI
Department of Microbiology, Eötvös Loránd University, Budapest, Hungary
(Received: 10 May 2017; accepted: 20 November 2017)
This study provides a comprehensive microbiological survey of three drinking water networks applying different water treatment processes. Variability of microbial communities was assessed by cultivation-based [nitrifying, denitrifying most probable number (MPN) heterotrophic plate count] and sequence-aided terminal restriction fragment length polymorphism (T-RFLP) analysis. The effect of microbial community composition on nitrifying MPN values was revealed. The non-treated well water samples showed remarkable differences to their corresponding distribution systems regarding low plate count, nitrifying MPN, and the composition of microbial communities, which increased and changed, respectively, in distribution systems.
Environmental factors, such as pH, total inorganic nitrogen content (ammonium and nitrite concentration), and chlorine dioxide treatment had effect on microbial com- munity compositions. The revealed heterogeneous nitrifying population achieved remarkable nitrification, which occurred at low ammonium concentration (14–51μM) and slightly alkaline pH 7.7–7.9 in chlorine dioxide disinfected water networks. No change was observed in nitrification-generated nitrate concentration, although nitrate- reducing (and denitrifying) bacteria were present with low MPN and characterized by sequence-aided T-RFLP. The community structures of water samples partially changed in nitrifying enrichments and had influence on the generated nitrifying, especially nitrite-oxidizing MPN regarding the facilitated growth of nitrate-reducing bacteria and even methanogenic archaea beside ammonia-oxidizing microorganisms and nitrite-oxidizing bacteria.
Keywords: nitrification, ammonia-oxidizing archaea, ammonia-oxidizing bacteria, drinking water, sequence-aided T-RFLP
*Corresponding author; E-mail:zsuzsanna.nagymate@gmail.com
Introduction
Drinking water is nutrient limited, oligotrophic, and extreme environment [1, 2]. Nevertheless, drinking water distribution systems (DWDS) harbor diverse microbial community [2] with relatively high cell number up to 106cell ml−1[3].
Thereby, microbial-mediated processes, such as biofilm development, nitrifica- tion, and biocorrosion, can occur in DWDS [4]. Ammonium-triggered nitrification can cause deterioration of water quality through, e.g., nitrite production, pH reduction [4, 5]. The first and rate-limiting step of nitrification is ammonia oxidation to nitrite [6]. Ammonia oxidation is performed by two phylogenetically distinct chemolithoautotrophic microorganism groups, ammonia-oxidizing bacteria (AOB), and ammonia-oxidizing archaea (AOA) possessing bacterial and archaeal ammonia monooxygenase (amoA) genes, respectively. Subsequently, the generated nitrite is oxidized to nitrate by nitrite-oxidizing bacteria (NOB). However, our knowledge and current view about two-step nitrification process is significantly changed by discovering “comammox” bacteria capable of completely oxidizing ammonia to nitrate [7–9].
Nitrifying microorganisms are widespread and found in environments (e.g., soil, wastewater, fresh, and marine water [10]) characterized by consider- ably different physico-chemical parameters. AOA and AOB often co-occur in the same environment [11], e.g., in DWDS [12]. However, the physico- chemical and geographic conditions of, e.g., drinking water have effect on the growth rate and the abundance of AOA and AOB [13]. Ammonium concentration, pH, and dissolved oxygen (DO) concentration are considered the main factors influencing the diversity and growth of AOA and AOB [14].
In DWDS, ammonium may originate from different sources, e.g., groundwater and/or chloramine decay [4]. In Hungary, ammonium is mainly of geological origin. AOA and several AOB, e.g., genera Nitrosomonas and Nitrosospira occur mainly in oligotrophic environment characterized with low ammonium concentration [11, 15, 16]. Several studies reported that ammonium concen- tration≥2 and>10–20 mM caused declined activity or inhibition, respectively, in nitrification process catalyzed by AOA [11, 14, 17, 18]. Drinking water generally characterized with neutral to slightly alkaline pH [5] coinciding the reported optimum pH 7–8 for most cultivated ammonia-oxidizing micro- organisms (AOM) [11, 17, 19]. DWDSs are generally well-oxygenated [5, 20], which can facilitate the growth of nitrifying microorganisms. However, oxygen depletion can occur especially at dead ends and during stagnation [5], causing anoxic or anaerobic conditions. AOA and AOB can tolerate low DO concentration below 10 μM [21, 22] and even anoxic conditions [5], respectively.
Cultivation-based counting methods as most probable number (MPN) technique are widespread and traditionally applied [20, 23] to enumerate nitrifying bacteria. Compared with molecular biological methods [e.g., fluorescentin situ hybridization (FISH) technique], cultivation-based enumeration techniques, such as MPN method, have a feature to underestimate the number of, e.g., nitrifying microorganisms. However, FISH technique was found to be less appropriate method to quantify nitrifying microorganisms in oligotrophic environments characterized with low ammonium and nitrifying cell counts, such as drinking water [24, 25]. Several AOB strains were isolated from diluted nitrifying MPN samples [23]. The effect of ammonium concentration [16, 26] and temperature [27] on nitrification activity was studied using enrichments. However, few studies examined the microbial community composition of enrichments or MPN media used for isolation or enumeration of nitrifying microorganisms [28].
The variability of microbial communities, with special regard to nitrifying microorganisms inhabiting ammonium containing drinking water networks, was assessed using cultivation-based methods (nitrifying, denitrifying MPN, and heterotroph plate count values) and sequence-aided terminal restriction fragment length polymorphism (T-RFLP) analysis based on bacterial and archaeal 16S rRNA andamoAgenes. Our aim was to reveal the relationships among microbial (bacterial and archaeal) and nitrifying communities and environmental factors.
The effect of different disinfectant agents on microbial and nitrifying communities was also investigated. The featured part of our work was to assess the microbial community composition of nitrifying MPN cultures. In this part of our work, we addressed two questions: (1) Does the nitrifying community composition of the MPNs reflect that in environmental samples?; (2) Could the microbial community of certain environmental samples affect the growth of nitrifying microorganisms and thereby the nitrifying MPN counts? For this purpose, nitrifying enrichments were prepared using nitrifying MPN media and drinking water samples originated from the examined water networks. The microbial communities of nitrifying MPN cultures were assessed by T-RFLP analysis based on bacterial and archaeal 16S rRNA and amoAgenes.
Material and Methods Sample sites and collection
Samples were collected from three different small drinking water networks (WN-1 to 3) located in County Fejér (Hungary) in October 2012. Raw water was supplied from underground aquifer at depth of 120–215 m. In WN-1,
chlorine-treated raw water was supplied to treatment basins where aeration was carried out. The treated water was transported to the water treatment plant and thereafter to consumer points of the DWDS (households). Based on their construction, the other two water networks, WN-2 and WN-3 had similarities.
Atfirst, raw water was transported to water treatment plants of WN-2 and WN-3 to achieve water treatment by dosing chlorine dioxide. The treated drinking water was transported to the water tower of WN-2 and then to consumer points.
In WN-3, the treated drinking water was first transported to households and thereafter to the water tower. Well water in each system contained ammonium, which was not removed during water treatment. Raw water samples were collected from wells (well water-W) and drinking water samples were collected after water treatment, at designated sampling points of the water treatment plant (P), and/or after water towers (T), and the endpoint of the distribution systems (tap water-E).
At each point, 1 and 2 L water samples were collected aseptically following flushing for 5 min. About 1 L water sample was used for estimation of heterotroph plate counts, nitrifying and denitrifying (nitrate-reducing) bacteria’s MPN and for inoculation of nitrifying (AOB and NOB) enrichments. About 2 L water samples were collected for environmental genomic DNA extraction. The pH was checked on site with a Multi 350i multimeter (WTW, Weilheim, Germany) and separate samples were taken for laboratory chemical analyses. Water samples were kept at 4 °C during transfer to the laboratory and were processed immediately upon arrival. The WW, DW, AM, NM abbreviations following the water sample names and the numbers of the water networks refer to the origin of the samples, such as well water, drinking water, ammonia-oxidizing, and nitrite-oxidizing enrichments, respectively.
Chemical analysis
Routine water chemistry measurements were performed by the accredited laboratory of Fejérvíz Waterworks Ltd. Concentration of inorganic nitrogen forms (ammonium, nitrite, and nitrate) and chemical oxygen demand (COD) were measured according to Hungarian standard methods, as follows: NH4+ MSZ EN ISO 11732:2005, NO2−, and NO3−MSZ 1484-13:2009, COD MSZ 448-20:1990. Total inorganic nitrogen content was calculated (TNi cal.) based on the sum of the inorganic nitrogen forms (ammonium, nitrite, and nitrate) at appropriate sampling points of the water networks. Based on 2-year (2011 and 2012) water chemistry data sets, biennial mean values were calculated to get a comprehensive overview of the characteristic of the water networks.
Cultivation-dependent methods and nitrifying enrichment techniques
To estimate the number of nitrifying bacteria, MPN analysis reported by Lipponen et al. [20] was applied. Nitrifying microorganisms’ selective enrich- ments were also prepared per water sample using nitrifying bacteria-specific MPN media [20] inoculated with water samples in 1:1 ratio. The prepared 9-9 ammonia- and nitrite-oxidizing enrichments were constructed in 120 ml bottles in a final volume of 90 ml (45 ml sample and 45 ml of adequate medium) and incubated for 9 weeks at 22 °C similarly to nitrifying MPN analysis. After incubation from all enrichments, 1 ml subsamples were checked for nitrite and nitrate. The same method was used for the evaluation of nitrifying MPN and enrichments. The growth of AOM was tested by detecting the presence of generated nitrite (or nitrate) by adding 40 μl of 0.2% diphenylamine in H2SO4 and measuring the blue color at absorbance 630 nm by microplate reader (Sunrise, Tecan, Switzerland). In NOB medium, the presence of nitrite was tested by adding 40μl Griess-Ilosvay reagents and measuring the red color at absorbance 540 nm by microplate reader (Sunrise). The presence of nitrite was scored positive and negative in AOB- and NOB-specific media, respectively. Molecular biological analysis was carried out for those enrichments that gave positive result for ammonia or nitrite oxidation.
Denitrifying and nitrate-reducing bacteria’s MPN were determined using nitrate broth [29]. Tenfold serial dilution was prepared from the water samples and 1 ml of each dilution in three parallels was inoculated into nitrate medium to 10 ml final volume. After incubation for 1 week at 28 °C, gas bubbles appeared in the Durham tubes indicating denitrification. At evaluation from all tubes, 1 ml subsamples were checked for nitrite generated from nitrate using 20 μl Griess– Ilosvay reagent. The MPN values were calculated as described by Rowe et al. [30].
Heterotrophic plate count (CFU/L) values were estimated by spread plate technique using 0.1 ml sample and an appropriate dilution on medium R2A [31]
(DSMZ 830) in three parallels and incubation was performed for 7 days at 22 °C.
DNA extraction
After incubation, the total volume of nitrifying enrichments resulting positive reaction for ammonia or nitrite oxidation and 2 L water samples were filtered on 0.22 μm pore size cellulose nitrate filters (Millipore, Billerica, USA). From samples concentrated on membranes, genomic DNA was extracted using UltracleanTM Soil DNA Isolation Kit (Mo Bio Laboratories, Inc., USA) according to the manufacturer’s protocol, supplemented by physical cell disruption.
The membranes were shaken in “Bead Solution tubes” (Mo Bio Laboratories)
containing microbeads at 25 Hz for 2 min with cell mill MM301 (Retsch, Haan, Germany) to enhance cell disruption.
PCR amplification and T-RFLP analysis
Community structure of bacteria, archaea, and nitrifying microorganisms of water samples and nitrifying enrichments was assessed by T-RFLP. In case of domain archaea, semi-nested PCR was carried out to amplify archaeal 16S rRNA gene fragment as described by Borsodi et al. [32]. Bacterial 16S rRNA gene was amplified using 27F forward and 519R reverse primers [33]. AOB and AOA were detected based on bacterial and archaealamoAgenes, respectively. The bacterial and archaealamoAgenes were amplified using amoA-F1 and amoA-R primers [34] and Arch-amo f, Arch amoA r primers [15], respectively. GenusNitrospira was detected based on 16S rRNA gene using 338F forward [35] and genus-specificNitrospirareverse NTSPA662R [36] primers. Denitrifying bacteria were detected based on nitrite-reductase genesNirS andNirK using cd3aF, R3cd primers and F1aCu, R3Cu primers, respectively [37]. The forward primer 27F, A340F, amoA-F1, Arch-amoA f of the targeted sequences (16S rRNA and amoAgenes) was labeled with hexachlorofluorsceinfluorescent dye for T-RFLP analysis. Thermal profiles of the PCR reactions were as follows: initial denatur- ation at 98 °C for 5 min, followed by 32 amplification cycles of 30 s at 94 °C, for 45 s at target sequence-specific annealing temperature as follows: bacterial, archaeal, andNitrospira genus-specific 16S rRNA genes at 52, 58, and 54 °C, respectively, bacterial and archaealamoAgenes at 50 and 53 °C, respectively, and nitrite-reductase genes (nirS andnirK) at 57 °C and 1 min at 72 °C, followed by final extension at 72 °C for 10 min. The PCR reaction mixture contained 1 U of LCTaq DNA Polymerase (recombinant) (Fermentas, Vilnius, Lithuania), 200μM of each deoxynucleoside triphosphate, 1× Taq buffer with (NH4)2SO4 (Fermentas), 2 mM MgCl2, 0.32μM of each primer, and 1–2μl DNA template in a final volume of 50 μl. Amplification was performed by GeneAmp PCR System (Model 2400, Applied Biosystems, Foster City, USA). PCR products were detected on 1% agarose gel stained with ethidium–bromide, visualized by UV light. For T- RFLP analysis, 10μl of target-specific PCR products was digested in 20μl reaction volume with 3 U restriction endonucleases (Fermentas) as follows:MspI andAluI for archaeal and bacterial 16S rRNA genes, MspI and BsuRI, for Nitrospira genus- specific 16S rRNA gene,Hin6I andTaqI for archaeal and bacterialamoA genes, respectively, incubating for 3 h at appropriate temperature (Fermentas). The digests were purified by ethanol precipitation. Capillary electrophoresis of fluorescently labeled terminal fragments (T-RF) was carried out using ABI prism 310 Genetic
Analyzer (Applied Biosystems). Chromatograms were analyzed by GeneScan (Applied Biosystems, version 3.7) software. Fragment size larger than 50 base pairs andfluorescence intensity higher than 50fluorescence units (peak height) were used to define T-RF peaks. Consensus profile of two parallel runs of each sample and alignment of T-RF’s of the different samples were done with T-Rex program [38].
Data matrices were created with T-RF’s ≥1% relative abundance. Statistical data analysis was performed by principal component analysis (PCA) as well as Shannon– Wiener (H), and Simpson (D) diversity indices were calculated based on T-RF data matrices using PAST software version 3.13 [39]. The environmental factors were fitted as vectors with “envfit”function with vegan (package vegan) onto the PCA ordination of bacterial and archaeal 16S T-RFLP and the significance offittings was tested with 10,000 random permutations in R programming environment [40, 41].
Molecular cloning and phylogenetic analysis
To identify the dominant T-RFs of the bacterial, archaeal, and nitrifying communities, clone libraries were constructed. Molecular cloning of EZ-10 Spin Column PCR Products Purification Kit (Bio Basic, Amherst, USA) purified PCR products were carried out using pGem®-T Vector System (Promega, Madison, USA) according to manufacturer’s instructions. Insert sequences were amplified using M13 primer sets [42] followed by nested PCR reaction with the applied specific primers (27F-519R, A340F-A934R,amoA–F1-amoA–R, and Arch–amoA f-Arch-amoA r) for the cloned gene fragments as described in section PCR amplification and T-RFLP analysis. Thermal profile of the M13 PCR reaction was as follows: initial denaturation at 98 °C for 3 min, followed by 32 amplification cycles of 30 s at 94 °C, for 45 s at 52 °C and 1 min at 72 °C, followed byfinal extension at 72 °C for 30 min. The reaction mixture of the M13 PCR was similar as in section PCR amplification and T-RFLP analysis. The amplified inserts were grouped according to their ARDRA (Amplified Ribosomal DNA Restriction Analysis) pattern, generated by the same restriction endonucleases as used for T-RFLP analysis. The partial 16S rRNA and amoA genes of the representative clones were sequenced, and their individual T-RF peaks were determined. The cloned gene fragments were sequenced by Sanger method using group specific forward primer at LGC Ltd. (Berlin, Germany). Sequences were aligned by Basic Local Alignment Search Tool (http://www.ncbi.nih.gov/BLAST) using the Gen- Bank nucleotide database, and the nearest cultivated relatives of the clones were identified by EzTaxon-e [43] database. Operational taxonomic units (OTUs) were assigned at 95% and 97% similarity threshold levels, representing microbial genera and species, respectively, according to Tindall et al. [44].
The DNA sequences obtained in this study were submitted to European Nucleotide Archive (accession numbers: LT549386-LT549445 for 16S rRNA gene and KX507014-KX507023 for bacterial and archaealamoAgene).
Results
Physical and chemical characterization of water samples
In well water, the main inorganic nitrogen form was ammonium with 0.45–0.72 mg NH4+–N l−1 concentration coinciding the biennial mean values (Table I). According to the biennial mean values, the concentration of oxidized nitrogen forms (nitrite and nitrate) appeared in the three distribution systems (Table I). However, oxidized inorganic nitrogen forms (nitrite and nitrate) appeared merely in the distribution systems of WN-3 at sampling time (Table I). Nitrogen conversion process could not be detected in WN-1, and according to the biennial mean and sampling time values, ammonia oxidation process was negligible in WN-2.
The water networks were characterized by slightly alkaline pH value (pH 7.7–8.4), which was approximately 0.5 unit higher in WN-1 and WN-2 than in WN-3 samples (TableI). WN-1 and WN-2 were characterized by moderately high COD values (0.9–1.54 mg O2/L) higher than the WN-3 samples (TableI).
Heterotroph plate count and bacterial community structure analysis of drinking water and nitrifying enrichment samples
The heterotrophic plate count (HPC) values were below 105 CFU/L on medium R2A in well waters (TableII). HPC showed no change in the distributed water of WN-1, which were characterized by the lowest values (<104 CFU/L).
Moreover, the bacterial communities of WN-1 were characterized by the highest diversity indices (D: 0.89–0.96, H: 2.83–3.61). Following chlorine dioxide treatment, HPC values increased to 9×10⁵ and 1.8×10⁶ CFU/L, with the maximum in E3-DW and T2-DW samples, respectively (TableII).
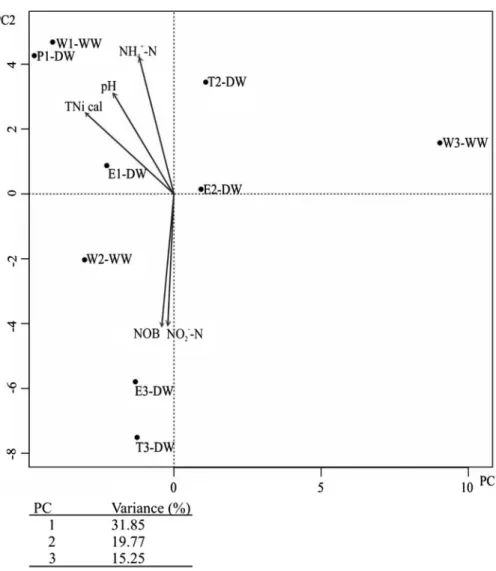
Differences were observed in the diversity (D: 0.78–0.96, H: 1.99–3.61) of the bacterial communities in the water samples, and the communities of the wells differed from that of the drinking water samples (Figure 1). The bacterial community of W3-WW sample characterized by the lowest HPC value (TableII) and diversity indices (H: 0.78, D: 1.99) showed remarkable separation from its corresponding water network and the other samples based on thefirst two principal components (Figure1). Fitting the environmental parameters onto the
TableI.Physicalandchemicalcharacteristicsofwatersamplesfromdifferentpointsofdrinkingwaternetworksinvestigatedatsamplingtimeandbasedonmean valuesof2-yeardatasets ValuesatsamplingtimeBiennialmeanvalues Sampling pointsNH4+ –N (mg/L)NO2− –N (mg/L)NO3− –N (mg/L)TNi cal.pHCOD (mgO2/L)NH4+ –N (mg/L)NO2− –N (mg/L)NO3− –N (mg/L)pHCOD (mgO2/L) W1-WW0.72<0.01<0.10.728.40.930.66±0.27<0.01<0.18.18±0.151.11±0.23 P1-DW0.59<0.01<0.10.598.21.480.48±0.270.05±0.120.06±0.018.17±0.110.90±0.24 E1-DW0.57<0.01<0.10.578.31.540.30±0.20.15±0.160.14±0.188.23±0.150.89±0.31 W2-WW0.51<0.01<0.10.517.90.930.52±0.07<0.01<0.18.10±0.141.04±0.19 T2-DW0.51<0.01<0.10.517.90.930.36±0.25<0.010.03±0.068.03±0.121.80±1.56 E2-DW0.470.02<0.10.498.01.330.4±0.130.02±0.030.02±0.058.06±0.160.95±0.32 W3-WW0.45<0.01<0.10.457.90.670.37±0.17<0.01<0.17.80±0.080.76±0.25 T3-DW0.240.050.200.497.90.720.22±0.040.10±0.050.12±0.097.70±0.280.62±0.14 E3-DW0.200.020.270.497.70.690.32±0.110.02±0.030.06±0.107.85±0.140.51±0.25
TableII.Theresultsofheterotrophicplatecount(CFU)andmostprobablenumber(MPN)estimationofammonia-(AOB),nitrite-oxidizingbacteria(NOB), nitrate-reducinganddenitrifyingbacteriaperliter,withstandarddeviation WaternetworksSamplenameAOBMNP/LNOBMNP/L— CFU/LNitrate-reducing bacteriaMPN/LDenitrifying bacteriaMPNl−1 WN-1W1-WWND(+)ND(−)5×10³±7×1033.7×105±1.5×10³ND P1-DWND(+)ND(−)2.5×10³±7×1023.7×105±1.5×10³ND E1-DWND(+)ND(+)4×10³±2.8×1031.7×104±1.2×10³ND WN-2W2-WW22±6(+)20.5±6(+)7.5×10⁴±3.3×1042.5×103±1.5×1033.7×105±1.5×10³ T2-DW1.6×103±210(+)3.7±11(+)1.8×10⁶±1.4×1052×103±1.6×1031.3×104±1.3×10³ E2-DW8.5×103±912(+)21±6(+)8.8×10⁵±7×1045×103±1.3×1031.9×105±1.5×10³ WN-3W3-WW3.6×102±52(+)34±6(+)5×10⁵±7×1055×103±1.3×1031.4×103±1.5×10³ T3-DW5.5×102±97(+)34×103±3648(+)5.5×10⁵±4.9×1059×103±1.3×1036.8×104±1.6×10³ E3-DW10.6×102±113(+)34×103±3648(+)9×10⁵±1.9×1053×103±1.5×1036.8×104±1.6×10³ Note:TheresultofnitrifyingMPNenrichmentsforammoniaornitriteoxidationareindicatedplusorminussignforpositiveornegativeresult,respectively,in parenthesesfollowingthenitrifyingMPNvalues.ND:notdetectable.
PCA ordination of the T-RFLPfingerprints, nitrite (mg NO2−–N l−1) concentra- tion and NOB MPN values (based onp<0.05 significance of thefitting) had effect on the separation of the bacterial communities of T3-DW and E3-DW samples from the other water samples (Figure 1). Furthermore, the calculated total inorganic nitrogen content (TNi cal.), ammonium (mg NH4+–N l−1) concentration, and pH values had effect on the observed separation of the bacterial communities of WN-1 samples (Figure 1).
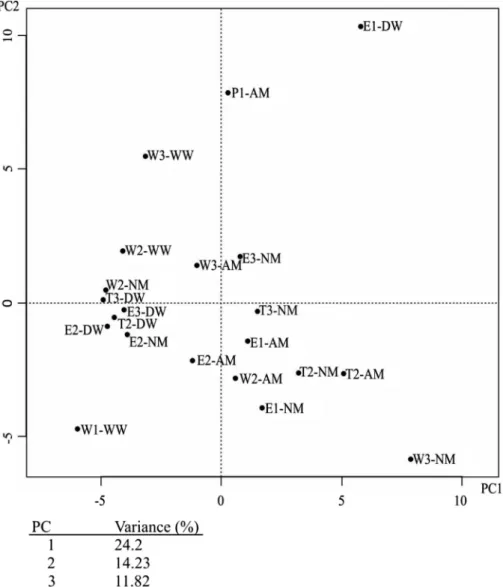
Figure 1.Two-dimensional principal component analysis (PCA) plot of T-RFLP data retrieved from investigated drinking water network bacterial communities. The environmental factors werefitted as
vectors onto the PCA ordination and only significant correlations of parameters are shown
Out of the 18 enrichments, 9 and 7 nitrifying enrichments gave positive result for ammonia and nitrite oxidation process, respectively. The bacterial community structure of water samples separated from their corresponding enrich- ments by the first two components (Figure 2) suggesting differently structured bacterial communities. Moreover, the different nitrifying enrichments showed considerable differences in their bacterial community structures (Figure 2).
Enrichments inoculated with WN-1 and W3-WW samples showed the greatest separation from their corresponding water and the other enrichment samples.
Regarding the selection of water and enrichment samples for molecular cloning, disinfection processes (non-disinfected vs. chlorine dioxide treatment) and diversity indices were considered. To identify the dominant T-RF peaks, clone
Figure 2.Two-dimensional principal component analysis (PCA) plot of T-RFLP data retrieved from investigated drinking water network and nitrifying enrichments bacterial communities
libraries were constructed from nitrifying enrichments (W2-AM and W2-NM) inoculated with non-treated groundwater (W2-WW) and chlorine dioxide-treated E3-DW and its corresponding enrichment samples (E3-AM and E3-NM), which had diverse (D: 0.72–0.92; H: 1.57–2.81) bacterial communities. The clone sequences revealed from water and nitrifying enrichment samples mainly belonged toα–,β–
and γ–proteobacteria, phyla Nitrospirea and Chlamydiae/Verrucomicrobia group.
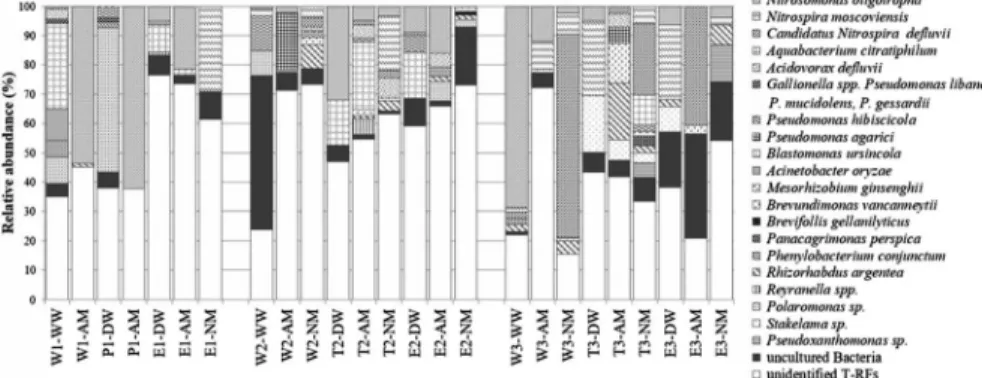
AOB and NOB and nitrate-reducing species-related sequences (Acidovorax defluvii, Aquabacterium citratiphilum, Pseudomonas spp., Polaromonas sp., Reyranella massiliensis, andStakelamasp.) were frequently detected in varying ratio in water and nitrifying enrichment samples. According to the comparative analysis of the water and enrichment samples, T-RFs of the identified clones revealed from water samples were generally present in enrichment samples (Figure3). Three members of the genus Pseudomonas (P. libanensis, P. mucidolens, and P. gessardii) were assigned by identical T-RF peak (Figure3) due to their 16S rRNA gene sequence homology, which was frequently detected in well water and water-treatment plant samples. Their presence was detected in several enrichments inoculated with drinking water samples. Besides Pseudomonas spp., several other heterotrophic bacteria, such as Rhizorhabdus argentea, Mesorhizobium ginsenghii, Reyranella soli, Brevundimonas vancanneytii, andA. defluvii, were detected solely in enrich- ment samples implying their low abundance in water samples (Figure3) and their facilitated growth in the enrichments. T-RF’s without closest cultivated rela- tives (<95% similarity) revealed mostly from wetland and soil samples (Figure3).
Representing up to 15% of the total peak area of the T-RFLP profiles in the bacterial communities of two well water and three enrichment samples (Figure3).
Figure 3.Stacked-bar graph shows the detection frequency of bacterial clones obtained from drinking water and nitrifying enrichments based on bacterial 16S rRNA gene digested byAluI. T-RF
peaks assigned by clone sequence at 97% and 95% similarity threshold levels, representing the closest cultivated relative species and genera, respectively, otherwise clone sequences were referred
to uncultured bacteria
Archaeal community structure in drinking water and nitrifying enrichment samples
Archaea were detected in almost all well and DWDS water samples by PCR method. The presence of Archaea was not detected in P1-DW sample and its corresponding nitrite-oxidizing enrichment (P1-NM) and in ammonia-oxidizing enrichments inoculated with WN-3 samples.
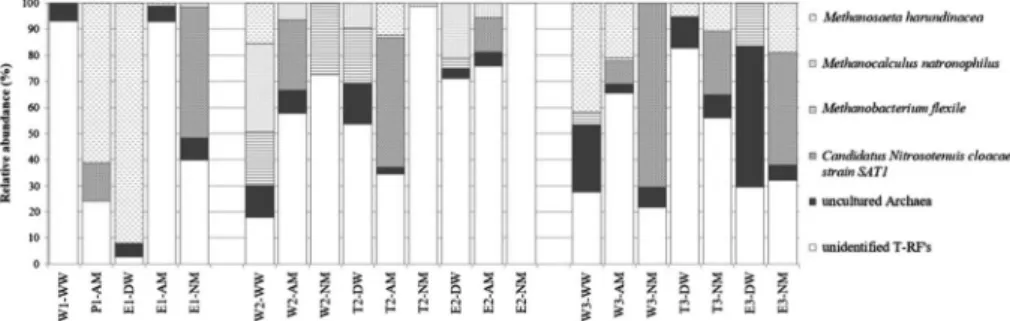
To identify the dominant T-RF peaks of the archaeal communities, clone libraries were constructed from well (W2-WW) and endpoint (E3-DW) samples. Several water and nitrifying enrichment samples were dominated by methanogenic microorganisms Methanobacterium flexile, Methanosaeta harundinacea, and Methanocalculus natronophilus belonging to phylum Euryarchaeota (Figure 4). T-RFs without previously isolated relatives (<95% similarity) represented up to 53.9% of the total peak area in archaeal communities. One of the most dominant T-RFs (8%–71%) was identified as
“Candidatus Nitrosotenuis cloacae”strain SAT1 by sequence-aided archaeal 16S T-RFLP method, which T-RF was detected solely in nitrifying enrich- ments (Figure4).
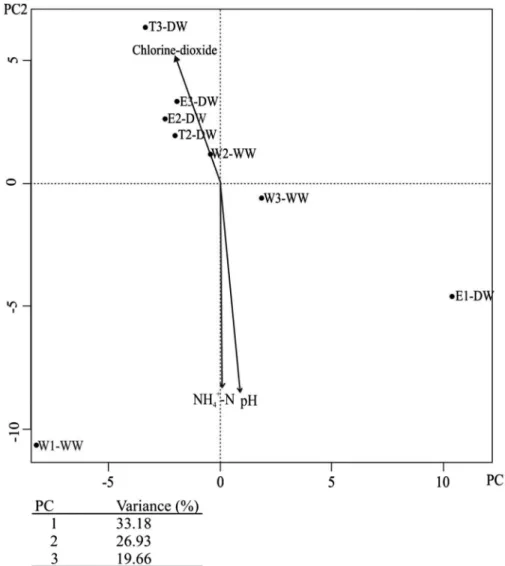
The archaeal community of well and drinking water samples was less diverse (D: 0.1–0.85, H: 0.3–2.2) than the bacterial communities. Generally, samples from wells separated from their corresponding DWDS’s sampling points (Figure5). Fitting the environmental parameters onto the PCA ordination of the archaeal communities, T-RFLPfingerprint, pH, and ammonium (mg NH4+–N l−1) concentration (based on p<0.05 significance of the fitting) had effect on the separation of WN-1 samples similarly as was observed in case of bacteria.
Figure 4.Stacked-bar graph shows the detection frequency of archaeal clones obtained from drinking water and nitrifying enrichments based on archaeal 16S rRNA gene digested byAluI. T-RF
peaks assigned by clone sequence at 97% and 95% similarity threshold levels, representing the closest cultivated relative species and genera, respectively, otherwise clone sequences were referred
to uncultured archaea
Furthermore, chlorine dioxide treatment had influence on the archaeal community composition of WN-2 and WN-3 samples.
Drinking water samples showed pronounced similarities to each other rather than their corresponding nitrifying enrichment samples, which also differed significantly from each other (Figure 6), suggesting differently structured com- munities as was observed in case of bacteria.
Figure 5.Two-dimensional principal component analysis (PCA) plot of T-RFLP data retrieved from investigated drinking water network archaeal communities. The environmental factors werefitted as
vectors onto the PCA ordination and only significant correlations of parameters are shown
Nitrifying community structure in drinking water and nitrifying enrichment samples
According to nitrifying bacteria’s MPN results, well and WN-1 samples were characterized with zero (WN-1) or low MPN values (<22 MPN/L) excepting
Figure 6.Two-dimensional principal component analysis (PCA) plot of T-RFLP data retrieved from investigated drinking water network and nitrifying enrichments archaeal communities
W3-WW, which was characterized with comparatively high (364 MPN/L) values (Table II). In DWDS, nitrifying MPN varied over a wide range (0–3.4×10⁴ MPN/L) with the maximum in water towers and endpoints (TableII). The highest AOB MPN (8.5×10³MPN/L) and NOB MPN (3.4×10⁴MPN/L) were detected in water network WN-2 and WN-3, respectively.
At evaluation, nitrifying enrichments inoculated with WN-1 samples characterized by zero nitrifying MPN (TableII), gave positive results for ammonia and nitrite oxidation processes in accordance with the detection of AOB and NOB, respectively, in the bacterial communities based on sequence-aided 16S T-RFLP.
In the bacterial communities of E1-DW, WN-2, and WN-3 water samples and nitrifying enrichments inoculated with WN-1, WN-2, and W3-WW, Nitro- somonas oligotropha was identified as sole AOB. N. oligotropha represented up to 68.5% of the total peak area of the bacterial 16S T-RFLP profiles, particularly, in WN-1 enrichments (Figure 3). Furthermore, N. oligotropha represented up to 4% of the total peak area of bacterial communities of nitrite- oxidizing enrichments (T2-NM, W3-NM, and E3-NM) (Figure 3) containing nitrite as sole inorganic nitrogen form. Its ratio was lower (<5%) and undetectable in ammonia-oxidizing enrichments inoculated with T2-DW and WN-3 samples, respectively (Figure3). Otherwise, T2-DW and WN-3 samples were characterized by moderately high AOB MPN (5.5–85×102MPN/L) (TableII) and the presence of AOB (Figure3). According to the results of bacterialamoAgene-specific PCR, AOB were merely detected in water samples of WN-3. BacterialamoAgene was not detected in water samples of WN-1 and WN-2. In contrast, after enrichment procedure, bacterialamoAgene was detected in enrichments inoculated with well (W1-AM, W2-AM, and W3-AM) and WN-1 water samples characterized by zero or low AOB MPN (Table II). Based on bacterial amoA gene T-RFLP, diverse (D: 0.7–0.85; H: 1.6–2.2) AOB communities were detected in water samples and enrichments. To identify the T-RF peaks of the AOB and AOA communities, clone libraries were constructed from composite sample of T3-DW and E3-DW.
Based on the sequence data of the bacterial amoA gene, few T-RFs could be identified. Clone sequences of the dominant T-RFs were related to uncultured AOB obtained from wastewater-treatment plant and from low nutrient containing groundwater. However,N. oligotrophacould not be detected inamoAgene-based clone library.
According to the results of the archaealamoAgene-specific PCR, AOA were detected in E1-DW and WN-3 samples characterized with zero and moderately lower AOB MPN (Table II), respectively. One of the dominant T-RFs of the diverse AOA communities (D: 0.78–0.9, H: 1.8–2.8) corresponded to three uncultured archaeon clones revealed from aquarium, freshwater, and wastewater treatment plant. Nitrosopumilus maritimus was identified by cloning method,
however, its ratio was under the detection limit in the AOA communities. The presence of AOA could not be detected in ammonia-oxidizing enrichments based on archaealamoAgene.
GenusNitrospirawas detected in all examined water networks and nitrite- oxidizing enrichments by genus-specific assay. Based on bacterial 16S T-RFLP analysis, the two identified members (Nitrospira moscoviensisand“Candidatus Nitrospira defluvii”) of the genusNitrospiracould not be detected or had low ratio (<2%) in the bacterial community of WN-1 and WN-2 water samples (Figure3).
N. moscoviensis was one of the dominant members of the bacterial community representing 25% of the total peak area in WN-3 (Figure3). Moreover, in the distribution system of WN-3 remarkable nitrification was achieved based on the concentration of inorganic nitrogen forms (TableI). The presence and ratio of the two identified members of the genusNitrospirashowedfluctuation in the bacterial communities of nitrite-oxidizing enrichments (Figure3). Furthermore, 9.5% and 40% of the total peak area of the bacterial community belonged toN. moscoviensis and“CandidatusNitrospira defluvii,”respectively, in ammonia-oxidizing enrich- ments inoculated with WN-3 water samples (Figure3).
Detection of denitrifying and nitrate-reducing bacteria by MPN and PCR method
Based on the MPN results, nitrate-reducing bacteria were present in the examined water networks. The water networks were characterized by low nitrate- reducing and denitrifying MPN (Table II). In WN-1 nitrate-reducing and denitrifying bacterias, MPN were zero, in accordance with the undetectable nitrite-reductase genes (nirS and nirK). The highest denitrifying MPN were usually detected at endpoints, with a maximum in E2-DW (1.91×10⁵MPN/L) (TableII).NirS was detected by PCR in distribution systems of WN-2 and WN-3.
Discussion
After water treatment, microbial regrowth can occur in the terminal sites of drinking water networks [1, 20] causing water quality deterioration including, e.g., nitrification process, which is a critical function in drinking water micro- biomes [2]. This study provides a comprehensive microbiological survey of three different small drinking water networks showing signs of nitrification episodes based on biennial data sets of inorganic nitrogen forms.
The microbial community structures of the wells, characterized by low HPC values, nitrifying, nitrate-reducing, and denitrifying bacteria’s MPN, differed significantly from drinking water samples. The point of chlorine addition, namely
dosing it to the groundwater of WN-1, probably contributed zero nitrifying and denitrifying MPN and low HPC values in well water and in the sampling points of DWDS. HPC, nitrifying and denitrifying MPN values of the well water increased after chlorine dioxide disinfection in DWDSs (WN-2 and WN-3) probably due to the biofilm-disrupting effect or the decrease of the disinfectant concentration.
According to the disinfectant treatment, bacterial and archaeal community struc- tures of the wells showed distinct changes in DWDS. The archaeal community compositions of the different sampling points of the DWDS showed significant similarities to each other, whereas the bacterial communities considerably differed following chlorine dioxide treatment. The slight spatial variation of the archaeal communities and the relatively high HPC values suggest the adaption of the microbiome to chlorine dioxide treatment in DWDS.
Ammonium, originating from the wells, was partially oxidized in DWDS, however, oxidized inorganic nitrogen forms were under the detection limit in WN-1 and WN-2 at the time of sampling. In accordance with the undetectable nitrification process, AOM were not detected in the mentioned two DWDS based on bacterial and archaealamoAgenes. However, WN-2 distribution system was characterized with moderately high nitrifying MPN values (1.6–8.5×10³MPN/L) and the presence of N. oligotropha.
Nitrification process was achieved by AOA and AOB in WN-3 disinfected by chlorine dioxide, which otherwise was characterized by moderately lower nitrifying MPN (3–10×102MPN/L) and HPC values (5–9×10⁵ CFU/L). The by-product of chlorine dioxide, chlorite is reported to suppress nitrification process [45], although nitrification episodes and nitrifying microorganisms were more frequently detected in water networks disinfected by chlorine dioxide. This result suggests that chlorine dioxide has less pronounced effect on nitrifying micro- organisms in the examined DWDS.
The high HPCs and the presence of biofilm formingPseudomonasspp. [46]
imply the existence of biofilm in DWDS. Biofilm helps a wide variety of microorganisms, e.g., nitrifying bacteria to settle and survive [47]. The hetero- geneous structure of biofilm [48] can facilitate the formation of anaerobic layers even at high DO concentration, which are optimal for nitrate-reducing bacteria and methanogenic archaea which could originate from the wells. Despite the detection of nitrate-reducing bacteria at relatively high MPN, loss of nitrification-generated nitrate was not observed. Regarding their respiratory metabolisms, the detected nitrate-reducing species were facultative anaerobes.
Regarding the affinity and the tolerance of AOM to ammonium, AOB grow preferably at millimolar [19], whereas AOA found to be more abundant in environments characterized by low ammonium concentration (0.03–1μM up to 15 mM) [11, 17], which coincide the concentration of the investigated DWDS
ranging from 14 to 51 μM, suggesting a low ammonium concentration adapted nitrifying community. Martens-Habbena et al. [14] suggested thatNitrosopumilis- related AOA are responsible for nitrification in oligotrophic environments, however,N. maritimushad low ratio in the AOA communities of the examined water networks; only uncultured microorganisms were detected. Though based on archaeal amoA gene AOA could not be detected in nitrifying enrichments, T- RFLP profiles shown the dominance of a recently identified AOA “Candidatus Nitrosotenuis cloacae”strain SAT1 [18]. Probably the 5 mM ammonium concen- tration of the enrichments had inhibitory effect on AOA, considering the reported
≥2 mM ammonium concentration value which caused decline in nitrification activity performed by AOA [11, 14, 17, 18]. Though ≥3 mM ammonium and nitrite concentration were reported to have inhibitory effect on “Candidatus Nitrosotenuis cloacae” strain SAT1 [18], the results suggest that “Candidatus Nitrosotenuis cloacae” may be capable of growing under higher ammonium concentrations in mixed cultures. Using the European Nucleotide Archive data- base, the specificity of the applied archaeal amoA primer set was checked, resulting uncultured archaeon clones andN. maritimus.
Regarding the detection of AOM in nitrifying enrichments by sequence- aided T-RFLP methods, the water networks had autochthonous ammonia- oxidizing communities, which probably originated from the wells. Despite the high detection sensitivity of the PCR method, it has limitations detecting low abundance microorganisms present in diverse population [28] such as drinking water. Regarding the inoculation of enrichments with larger-volume (in our case 45 ml), water samples and the cluster-forming capability of AOB (which otherwise could underestimate the number of AOB) [23, 24] could cause the positive results for nitrification in enrichments inoculated with water samples characterized by zero MPN. In addition to cluster formation, unculturable AOM may lead to underestimation of MPN values as well [23, 24]. In this study, uncultured AOB were detected in nitrifying enrichments suggesting their contribution to nitrifying MPN values in the examined water networks.
In accordance with the aggregation and close association formation between AOB and NOB [47] and thereby the direct substrate transmission for NOB by AOM [49] resulted the detection of NOB (N. moscovinesisand“Candidatus Nitrospira defluvii”) in ammonia-oxidizing enrichments. The nitrite concentration (0.5 mM) of the NOB selective enrichments could support the growth of AOB capable of using nitrite as alternative electron acceptor [50]. Moreover, the
“CandidatusNitrosotenuis cloacae”possesses NO-forming nitrite reductase pro- tein coding gene based on whole genome analysis [18].
Besides chemolithoautotrophic nitrifying microorganisms, a diverse microbial community, predominantly composed of heterotrophic microorganisms were
enriched in nitrifying media. The HPC values of water samples on oligotrophic R2A medium suggests low organic nutrient content adapted microbial communities, which were capable of growing in organic nutrient free, nitrifying bacteria selective MPN media. The coexistence of nitrifying bacteria with heterotrophs is well known in autotrophic nitrifying biofilms [51]. Moreover, the number of nitrifying and heterotrophic bacteria shows positive linear correlation [20]. Nitrifying bacteria support the growth of heterotrophic bacteria via production of soluble microbial products and biomass decay [51], e.g., in low nutrient containing environments (such as in this study the examined drinking water and nitrifying enrichment samples). However, the microbial communities of the environmental samples were altered during the selective enrichment procedure similarly to the results of Hirooka et al. [28]. The microbial community structure of nitrifying enrichments partially reflected the original samples regarding the presence of nitrate-reducing bacteria, and even methanogenic archaea. Ratios varied considerably in the microbial communities of enrichment samples. After incubation for 9 weeks, the DO con- centration was probably depleted creating anoxic environment for anaerobic or facultative anaerobic bacteria, such as nitrate-reducing and methanogenic species in nitrifying enrichments. Regarding the microbial community composition of nitrify- ing enrichments, the facilitated growth of nitrate-reducing bacteria has different impact on the number of AOB and NOB. According to the evaluation of nitrifying MPN, the presence of AOM and nitrate-reducing bacteria could result in over- and underestimation of NOB MPN values, respectively, utilizing nitrite and nitrate generated by nitrification. However, ammonia-oxidizing MPNs were not affected by the activity of nitrite-reducing bacteria.
Cultivation conditions of the nitrifying enrichments, considering ammoni- um, nitrite, and depleted oxygen concentration, differed considerably from the water parameters of the examined DWDS. Therefore, optimizing the cultivation conditions to better reflect the environmental parameters could assess the composition and the cell counts of low ammonium and nitrite concentration adapted nitrifying communities more accurately.
Conclusions
The non-treated well water samples showed remarkable differences to their corresponding distribution systems regarding the low HPC, nitrifying MPN, and the composition of microbial communities, which increased and changed, respectively, in the distribution systems.
According to the relationships among the microbial (bacterial and archaeal) community structure and environmental factors, ammonium concentration and pH
values had significant effect on the bacterial and archaeal communities inhabiting the examined water networks.
The polyphasic approach – cultivation and molecular based methods – revealed a heterogeneous nitrifying (AOB, AOA, and NOB) population capable of achieving remarkable nitrification episodes, which occurred at low ammonium concentration in chlorine dioxide disinfected water networks. The polyphasic detection method of nitrifying microorganisms highlighted that 16S rRNA and functional (consideringamoA) genes based assays are complementary and lead to more coherent results.
The community structures of the water samples partially changed in the nitrifying enrichments and had influence on the generated nitrifying, especially NOB MPN values regarding the facilitated growth of nitrate-reducing bacteria and even methanogenic archaea beside AOB, NOB, and AOA.
Acknowledgements
The authors would like to thank the contribution of Fejérvíz Ltd. with special thanks to Lászl´o Répás and J´ozsef Mészáros for performing sampling and on-site measurements, and providing the physical, chemical water parameter data.
Furthermore, they would also like to appreciate the help of colleagues in determining the heterotroph plate count values.
Conflict of Interest The authors declare no conflict of interest.
References
1. Homonnay, Z. G., Török, Gy., Makk, J., Brumbauer, A., Major, É., Márialigeti, K., T´oth, E.: Bacterial communities in the collection and chlorinated distribution sections of a drinking water system in Budapest, Hungary. J Basic Microbiol54, 1–10 (2014).
2. Gomez-Smith, C. K., Tanb, D. T., Shuaic, D.: Research highlights: Functions of the drinking water microbiome–From treatment to tap. Environ Sci Water Res Technol2, 245–249 (2016).
3. Prest, E. I., Hammes, F., van Loosdrecht, M. C., Vrouwenvelder, J. S.: Biological stability of drinking water: Controlling factors, methods, and challenges. Front Microbiol 7, 45 (2016).
4. Hwang, C., Ling, F., Andersen, G. L., LeChevallier, M. W., Liu, W. T.: Microbial community dynamics of an urban drinking water distribution system subjected to phases of chloramination and chlorination treatments. Appl Environ Microbiol78, 7856–7865 (2012).
5. Zhang, Y., Love, N., Edwards, M.: Nitrification in drinking water system. Crit Rev Environ Sci Technol39, 153–208 (2009).
6. Nicol, G., Schleper, C.: Ammonia-oxidizing Crenarchaeota: Important players in the nitrogen cycle? Trends Microbiol14, 207–212 (2006).
7. Daims, H., Lebedeva, E. V., Pjevac, P., Han, P, Herbold, C., Albertsen, M., Jehmlich, N., Palatinszky, M., Vierheilig, J., Bulaev, A., Kirkegard, R. H., von Bergen, M., Rattei, T., Bendinger, B., Nielsen, P. H., Wagner, M.: Complete nitrification by Nitrospira bacteria.
Nature528, 504–509 (2015).
8. van Kessel, M. A. H. J., Speth, D. R., Albertsen, M., Nielsen, P. H., den Camp, H. J. M. O., Kartal, B., Jetten, M. S. M., Lücker, S.: Complete nitrification by a single microorganism.
Nat Lett528, 555–559 (2015).
9. Pinto, A. J., Marcus, D. N., Ijaz, U. Z., Bautista-de Lose Santos, Q. M., Dick, G. J., Raskin, L.:
Metagenomic evidence for the presence of comammox Nitrospira-like bacteria in a drinking water system. mSphere1, e00054-15 (2015).
10. Junier, P., Molina, V., Dorador, C., Hadas, O., Kim, O.-S., Junier, T., Witzel, K.-P., Imhoff, J. F.: Phylogenetic and functional marker genes to study ammonia-oxidizing micro- organisms (AOM) in the environment. Appl Environ Microbiol85, 425–440 (2010).
11. French, E., Kozlowski, J. A., Mukherjee, M., Bullerjahn, G., Bollmann, A.: Ecophysio- logical characterization of ammonia-oxidizing archaea and bacteria from freshwater. Appl Environ Microbiol78, 5773–5780 (2012).
12. Kasuga, I., Nakagaki, H., Kurisu, F., Furumai, H.: Predominance of ammonia-oxidizing archaea on granular activated carbon used in a full-scale advanced drinking water treatment plant. Water Res44, 5039–5049 (2010).
13. Wang, H., Proctor, C. R., Edwards, M. A., Pryor, M., Domingo, J. W. S., Ryu, H., Camper, A. K., Olson, A., Pruden, A.: Microbial community response to chlorine conversion in a chloraminated drinking water distribution system. Environ Sci Technol48, 10624–10633 (2014).
14. Martens-Habbena, W., Berube, P. M., Urakawa, H., de la Torre, J. R., Stahl, D. A.:
Ammonia oxidation kinetics determine niche separation of nitrifying archaea and bacteria.
Nat Lett461, 976–979 (2009).
15. Francis, C. A., Roberts, K. J., Beman, J. M., Santoro, A. E., Oakley, B. B.: Ubiquity and diversity of ammonia-oxidizing archaea in water columns and sediments of the ocean.
Proc Natl Acad Sci U S A102, 14683–14688 (2005).
16. Verhamme, D. T., Prosser, J. I., Nicol, G. W.: Ammonia concentration determines differential growth of ammonia-oxidising archaea and bacteria in soil microcosms. ISME J5, 1067–1071 (2011).
17. Könneke, M., Bernhard, A. E., de la Torre, J. R., Walker, C. B., Waterbury, J. B., Stahl, D. A.:
Isolation of an autotrophic ammonia-oxidizing marine archaeon. Nature437, 543–546 (2005).
18. Li, Y., Ding, K., Wen, X., Zhang, B., Shen, B.: A novel ammonia-oxidizing archaeon from wastewater treatment plant: Its enrichment, physiological and genomic characteristics. Nat Sci Rep6, 23747 (2016).
19. Lehtovirta-Morley, L. E., Ross, J., Hink, L., Weber, E. B., Gubry-Rangin, C., Thion, C., Prosser, J. I., Nicol, G. W.: Isolation of‘Candidatus Nitrosocosmicus franklandus’, a novel ureolytic soil archaeal ammonia oxidiser with tolerance to high ammonia concentration.
FEMS Microb Ecol92, 1–10 (2016).
20. Lipponen, M. T. T., Suutari, M. H., Martikainen, P. J.: Occurence of nitrifying bacteria and nitrification in Finnish drinking water distribution system. Water Res36, 4319–4329 (2002).
21. Erguder, T. H., Boon, N., Wittebolle, L., Marzorati, M., Verstraete, W.: Environmental factors shaping the ecological niches of ammonia-oxidizing archaea. FEMS Microbiol Rev 33, 855–869 (2009).
22. Mosier, A. C., Lund, M. B., Francis, C. A.: Ecophysiology of an ammonia-oxidizing archaeon adapted to low-salinity habitats. Microb Ecol64, 955–963 (2012).
23. de Boer, W., Kowalchuk, G. A.: Nitrification in acid soils: Micro-organisms and mechanisms. Soil Biol Biochem 33, 853–866 (2001).
24. Konuma, S., Satoh, H., Mino, T., Matsuo, T.: Comparison of enumeration methods for ammonia-oxidizing bacteria. Water Sci Technol43, 107–114 (2001).
25. Wagner, M., Haider, S.: New trends influorescence in situ hybridization for identification and functional analyses of microbes. Curr Opin Biotech23, 96–102 (2012).
26. Zhang, Y., Chen, L., Dai, T., Sun, R., Wen, D.: Ammonia manipulates the ammonia- oxidizing archaea and bacteria in the coastal sediment-water microcosms. Appl Microbiol Biotechnol99, 6481–6491 (2015).
27. Tourna, M., Freitag, T. E., Nicol, G. W., Prosser, J. I.: Growth, activity and temperature responses of ammonia-oxidizing archaea and bacteria in soil microcosms. Environ Micro- biol10, 1357–1364 (2008).
28. Hirooka, K., Asano, R., Nakai, Y.: Change in the community structure of ammonia- oxidizing bacteria in activated sludge during selective incubation for MPN determination.
J Ind Microbiol Biotechnol36, 679–685 (2009).
29. Atlas, R. M.: Handbook of Microbiological Media, 4thEdition. CRC Press, Taylor &
Francis Group, Broken Sound Parkway NW, Boca Raton, FL, 2010.
30. Rowe, R., Todd, R., Waide, J.: Microtechnique for most-probable-number analysis. Appl Environ Microbiol33, 675–680 (1977).
31. Reasoner, D. J., Geldreich, E. E.: A new medium for the enumeration and subculture of bacteria from potable water. Appl Environ Microbiol49, 1–7 (1985).
32. Borsodi, K. A., Felföldi, T., Máthé, I., Bognár, V., Knáb, M., Krett, G., Jurecska, L., T´oth, M. E., Márialigeti, K.: Phylogenetic diversity of bacterial and archaeal communities inhabiting the saline Lake Red located in Sovata, Romania. Extremophiles17, 87–98 (2013).
33. Lane, D. J.: 16S/23S rRNA sequencing. In Stackebrandt, E., Goodfellow, M. (eds): Nucleic Acid Techniques in Bacterial Systematics. Wiley, Chichester, UK, 1999, pp 115–148.
34. Rotthauwe, J. H., de Boer, W., Liesack, W.: Comparative analysis of gene sequences encoding ammonia monooxygenase of Nitrosospira sp. AHB1 and Nitrosolobus multiformisC-71. FEMS Microbiol Lett133, 131–135 (1995).
35. Amann, R. I., Binder, B. J., Olson, R. J., Chisholm, S. W.: Combination of 16S rRNA- targeted oligonucleotide probes with flow cytometry for analyzing mixed microbial populations. Appl Environ Microbiol 56, 1919–1925 (1990).
36. Daims, H., Nielsen, J. L., Nielsen, P. H., Schleifer, K. H., Wagner, M.: In situ characteri- zation of Nitrospira-like nitrite-oxidizing bacteria active in wastewater treatment plants.
Appl Environ Microbiol67, 5273–5284 (2001).