CERS-IE WORKING PAPERS | KRTK-KTI MŰHELYTANULMÁNYOK
INSTITUTE OF ECONOMICS, CENTRE FOR ECONOMIC AND REGIONAL STUDIES, BUDAPEST, 2020
Automation risk along individual careers:
static and dynamic upgrades in cities
LÁSZLÓ CZALLER – RIKARD ERIKSSON – BALÁZS LENGYEL
CERS-IE WP – 2020/30 July 2020
https://www.mtakti.hu/wp-content/uploads/2020/07/CERSIEWP202030.pdf
CERS-IE Working Papers are circulated to promote discussion and provoque comments, they have not been peer-reviewed.
Any references to discussion papers should clearly state that the paper is preliminary.
Materials published in this series may be subject to further publication.
ABSTRACT
Automation risk of workers prevails less in large cities compared to small cities, but little is known about the drivers of this emerging urban phenomenon. We examine the role of cities on changes in automation risk through individual careers of workers by separating labour mobility to a city from labour mobility within a city. Applying panel data representing all Swedish workers from 2005 to 2013 we provide new evidence that working in, or moving to, metropolitan areas lower automation risk of workers. We find that high-skilled workers enjoy dynamic occupation upgrades in cities and benefit from accumulating experience in the urban labour market, while low-skilled workers experience a single static upgrade when moving to a city.
JEL codes: J23, J24, J62, R23
Keywords: automation risk, metropolitan regions, career upgrade, labour mobility László Czaller
Agglomeration and Social Networks Lendület Research Group, Centre for Economic and Regional Studies, Budapest, H-1097, Hungary
and
Department of Regional Science, ELTE University, Budapest, H-1117, Hungary e-mail: czaller.laszlo@krtk.mta.hu
Rikard Eriksson
Department of Geography, Umeå University, Umeå, SE-901 87, Sweden and
Centre for Regional Science at Umeå University, Umeå, SE-901 87, Sweden e-mail: rikard.eriksson@umu.se
Balázs Lengyel
Agglomeration and Social Networks Lendület Research Group, Centre for Economic and Regional Studies, Budapest, H-1097, Hungary
and
Centre for Advanced Studies, Corvinus University of Budapest, Budapest, H-1093, Hungary e-mail: lengyel.balazs@krtk.mta.hu
Automatizációs kockázat egyéni karrierpályák mentén: statikus és dinamikus előrelépés a városokban
CZALLER LÁSZLÓ – RIKARD ERIKSSON –LENGYEL BALÁZS
ÖSSZEFOGLALÓ
A munkavállalók automatizálási kockázata alacsonyabb a nagyvárosokban, mint a kisvárosokban, ám keveset tudunk ennek a városi jelenségnek a mozgatórugóiról. Ebben a tanulmányban a városi munkavállalás szerepét vizsgáljuk az automatizálási kockázat változására a munkavállalók karrierpályái során, elválasztva a városba irányuló munkaerő- mobilitást a városon belüli karrier-mobilitástól. A teljes svéd munkaerő-állományt tartalmazó panel adatbázis felhasználásával új bizonyítékokat szolgáltatunk arra, hogy a nagyvárosi régiókban történő tartós munkavégzés vagy az odaköltözés hozzájárul a munkavállalók automatizálási kockázatának csökkenéséhez. Megállapítjuk, hogy a magasan képzett munkavállalók élvezik a városokon belüli gyorsabb karrier-mobilitás előnyeit, hiszen elsősorban ők részesülnek a városi munkaerőpiacon felhalmozódó tapasztalatokból, míg az alacsonyan képzett munkavállalók jellemzően egyetlen alkalommal tapasztalnak váltázást az automatizációs kitettségük csökkenésében, mégpedig amikor a városba költöznek.
JEL: J23, J24, J62, R23
Kulcsszavak: automatizációs kockázat, városrégiók, szakmai előrelépés, munkaerő- mobilitás
1. Introduction
Automation influences labour markets by replacing human workforce in certain tasks (Autor, Levy, & Murnane, 2003; Brynjolfsson & McAfee, 2014). Whether this threatens existing jobs or facilitates creation of new jobs depends on the type of investments into automation, worker skills and their potential renewal (Acemoglu & Restrepo, 2020).
Because investments into technologies as well as the skill level of human workforce typically differ across regions, the problem has a necessary spatial dimension. Accordingly, workers in small cities have been found to face higher automation risks than workers in large cities (Frank et al., 2018). Further evidence suggests that investments into labour replacing technologies in metropolitan regions lead to employment growth on the long run because robots supplement automatable tasks that triggers upgrades in local skills (Leigh et al., 2020). Nevertheless, how individuals adopt their skills to avoid the threat of automation and how geography facilitates this process is one of the important questions in this quickly evolving but still largely uncovered topic (Frank et al., 2019).
In this paper, we look at how working in cities help individuals to upgrade career and prevent automation risks. According to central tenets in urban economics literature, two mechanisms take place in cities in this regard. First, the demand for non-automatable tasks is high in cities due to their functional specialization (Duranton & Puga, 2005). Second, cities are arenas of learning and offer additional opportunities for individual workers to advance their career and perform tasks that are hard to replace (Glaeser & Maré, 2001; De la Roca & Puga, 2017). However, workers are not homogenous in their ability to learn in cities, which arguably depends on their individual skill base. High-skilled workers can further upgrade skills by learning while low-skilled workers might be able to enjoy only the demand for non-automatable jobs (MacKinnon, 2017).
The recent empirical analysis exploits employer-employee matched data covering every worker in the Swedish labour market over the 2005-2013 period. We apply the occupation- level risk measure introduced by Frey and Osbourne (2013) to quantify how much an individual is exposed to automation. Descriptive statistics help us understand the role of cities in getting a low-risk job. Further, we apply a labour mobility specification that enables us to identify the mechanisms helping individual workers to upgrade career and prevent automation. We differentiate static- and dynamic upgrades in cities. Static upgrades refer to moving to a city and starting a new job there; while dynamic upgrades
mean advancing career by changing jobs and occupations staying in the city.
Our results show that there are stark differences between small and large regions concerning the distribution of high- and low-risk automatable jobs. During this period, Sweden experienced a remarkable rise in the share of low-risk jobs that concentrated in metropolitan regions with a growing intensity. The largest cities of Sweden accounted for 58% of overall job creation between 2005 and 2013, which was 65% in the case of low- risk jobs. Workers in large cities have significantly higher chance of getting a low-risk job, which holds when controlling for unobserved individual heterogeneity. We find that individual workers lower automation risk differently, depending on their skill level.
Evidence implies that high-skill workers (at least a college degree) realize dynamic career upgrades suggesting that learning in cities helps them prevent automation risk. However, less educated workers (less than college degree) can only exploit the single event of moving to a city to reduce automation risk.
After this introductory section, the paper proceeds in four steps. The next section provides a review of the literature that is followed by an explanation of our estimation strategy. The fourth section introduces data and set the stage for the individual-level econometric analysis in the fifth section. The paper then ends with some concluding remarks.
2. Static and dynamic career upgrades of cities
As recent advances in the fields of automation technologies change everyday life, their prospective effects on the labour market have, unsurprisingly, become the subject of public concern. In a recent OECD report, Nedelkoska and Quintini (2018) argue that about 46%
(ca 210 million) of all jobs across 32 different countries face at least a 50% chance of being replaced by machines in the near future. At the same time, divergence and increasing regional differences characterize regional development in many developed economies (Storper, 2018; Iammarino et al., 2019). This accentuates further challenges in sustaining employment and welfare in many non-core regions. Although broad discussions in society premise the ’end-of-work’ by stressing the adverse labour market effects of automation, it is still a matter of academic debate how automation will indeed influence labour markets.
While some argue that the development and widespread adoption of artificial intelligence, robotics and other computer-aided manufacturing technologies imply the displacement of workers performing ’rule-based’ routine tasks (Autor, Levy, & Murnane, 2003; Levy &
Murnane, 2004; Brynjolfsson & McAfee, 2014; Autor, 2014; Acemoglu & Restrepo,
2018a; 2019), others emphasize that automation increases the demand for labour in high- skill complementary tasks (e.g. programming, maintenance, design), and other seemingly unrelated non-tradable activities (e.g. culture, arts, leisure, personal services) through inter- industry spillovers (Autor & Solomon, 2018; Moretti, 2010).
Whether disruptive technological innovations will influence the future of work independently from spatial economy or whether these processes will depend on the location of jobs is a rarely addressed question. Some studies using aggregate data on robot adoption have recently showed that automation reduce the employment share of workers performing production-related routine tasks (Acemoglu & Restrepo, 2018b; Graetz & Michaels, 2018).
Although the absence of detailed data limits our understanding on how automation-driven displacement may unfold in the spatial economy, these findings suggest that differences across local economies in terms of motivation and ability to adopt such technologies might take place.
Research antecedents on the locational patterns of job-creation suggest that the labour market effects of automation could indeed vary across space and hence affect workers differently depending on their location. Since production-related routine occupations are easier to manage and control remotely by codified rules, they tend to locate on the outskirts of cities or in rural areas, where land rents and wages are lower (Scott, 1988; Moretti, 2012;
Storper, 2013). At the same time, the demand for both creative and high-skill jobs is higher in cities as well as the demand for low-skill service jobs (e.g. catering service workers, childcare workers, geriatric nurses, janitors, cleaners, hairdressers etc.) (Scott, 2009).
Additionally, technology-driven job-creation tends to be confined to larger urban areas where related activities, innovation capabilities and market knowledge competences have been already present (Shutters et al., 2016; Muneepeerakul et al., 2013). Consequently, as with the general geography of displacement, small cities and rural areas are likely to be hit harder by job displacement via the automation of production-related tasks, while large cities remain resilient or could even benefit from the positive employment effects of the on-going technological change (Eriksson & Hane-Weijman, 2017; Andersson et al., 2020).
A recent study on U.S. MSAs corroborates this perspective by showing that small cities have higher average automation risk than large cities (Frank et al., 2018). Since the automation risk measures frequently adopted for such empirical analyses usually are calculated at the occupation-level (see e.g. Frey & Osbourne, 2013; Arntz et al., 2016), the
findings of Frank et al. (2018) and other similar studies (see e.g., Henning et al. (2017) for similar Swedish findings on regional automation risks) should be interpreted with caution.
The average ‘automation risk’ of a geographical unit (or an industry) compresses all the information that the local occupational mix hides within itself. Given that the occupational structure of a region is primarily shaped by the local demand for tasks, spatial differences in automation risk reflect a set of location-specific attributes and also factors associated the local industry structure (Boskin, 1974).
The demand for non-automatable tasks, tend to be higher in large cities because of functional specialization (Duranton & Puga, 2005). Information- and communication technologies (ICT) allows firms to rationalize their production in space, move routine tasks offshore and keep only managerial tasks, creative activities and their supporting services in the largest cities. Some of these jobs do not require high educational attainment but social skills that usually are considered as ’bottlenecks’ of automation (Autor, Levy &
Murnane, 2003; Levy & Murnane, 2004; Frey & Osbourne, 2013). Since the overall share of less-automatable jobs tends to be higher in cities, workers who move to large cities are therefore expected to have a better chance of starting such low-risk jobs. We refer to this as the static upgrade in the career of moving to a city which prevails when the worker gets a relatively less-automatable job in a large city irrespective whether job search precedes moving or vice versa. Static upgrades are horizontal occupational shifts that entail one- time reductions in the automation risk of individuals simply because it is easier to find less- automatable jobs in large cities.
Another possible way through which working in cities contributes to the prevention of automation risk is that workers in cities can step ahead in their career within a shorter period of time. Career progression in cities particularly depends on both jobs offering access to highly-valued elements of tacit knowledge, and personal interactions (Gordon, 2015). That is, being exposed to cutting-edge skills, gathering experience at top ranked employers and making valuable personal and business connections which might have long-lasting effects on the career-path and job prospects of workers (de la Roca & Puga, 2017). Hence, individuals with urban work experience gain access to better job positions, or become entrepreneurs easier (Faggio & Silva, 2014). Since the tasks performed by managers, executives and specialists (e.g. providing expertise, managing resources, negotiating, and interfacing with stakeholders) require interpersonal skills of different types (Borghans et al., 2008; Riggio & Reichard, 2008), climbing the career ladder and getting into these
positions accompanies the shrinkage of automation risk. We refer to these vertical shifts along the career ladder as dynamic upgrades.1 As city-regions often are labelled as escalator-regions (Gordon, 2015), such dynamic upgrades are more frequent in cities.
Although our argument on career upgrades emphasises the role of large cities, static and dynamic modes of career advancement cannot be considered as “city-effects” because they come from the occupational structure of labour demand. The reduction of automation risk through career upgrades is faster in cities because social skill-intensive tasks – including, of course, management functions – tend to concentrate in urban areas. This implies that career upgrades do not affect all workers equally. For example, more educated workers are expected to have better capabilities to adapt and self-renew in an evolving labour market.
This potential for “labour branching” (MacKinnon, 2017), is because they can apply to a wider range of jobs, have better access to employment opportunities with the potential for career advancement, and therefore have a higher chance to get low-risk jobs compared to their low-skilled peers whose job opportunities (or job-search radius) tend to be narrower.
Generally, this suggests that both type of career upgrades considered above are expected to accrue mostly to skilled workers. Since career mobility is shown to be a positive function of education (Sicherman & Galor, 1990), dynamic career upgrades play a relatively larger role in the case of skilled workers. On the contrary, static upgrades might be relatively more important for less skilled workers.
According to these arguments, cities should be safer places in terms of automation risk irrespective of the initial skill set of the workers. Moving from a small to a large city might therefore be a reasonable strategy of reducing automation risk or getting back to work after a technology-driven job-loss. However, to properly examine the extent to which these career upgrading mechanisms help reduce automation risk, one has to rule out other factors determining occupational structure, especially worker heterogeneity. Controlling for worker heterogeneity is extremely important because the likelihood of getting a low-risk job is likely to vary by unobserved skills and traits. As shown by Heckman, Stixrud &
Urzua (2006) and many others, non-cognitive abilities and personality traits determine occupational preferences and the career path of workers.
1 Above all, there is another factor which might also help career-advancement in cities. As argued by Florida (2004), open and tolerant urban societies unfold creative talent and reduce discrimination impeding female workers or individuals with various ethnic a nd cultural backgrounds to fill executive positions and hold down prestigious high-skill jobs resilient to automation.
3. Reducing automation risk through career upgrades: an empirical model
Consider a panel of i = 1, 2, ..., N workers in which automation risk 𝑝𝑖𝑡 and other individual covariates are observed for t = 1, 2, ..., T dates. In such a setting, a straightforward way to analyse the association between career upgrades of moving to cities and automation risk is the estimation of the following model:
𝑝𝑖𝑡 = 𝛼𝑖 + 𝐗𝑖𝑡′ 𝛽 + 𝛿𝑑𝑖𝑡𝐶 + 𝜆𝑡 + 𝜀𝑖𝑡 (1) where αi denotes individual fixed effect, Xit is a vector of individual-level variables, 𝑑𝑖𝑡𝐶t is a dummy variable that takes value 1 if the individual works in a large city at date t, λt are a set of time dummies and 𝜀𝑖𝑡 is the error with the usual properties. The effects of individual characteristics are captured by coefficient-vector β, while δ is the coefficient which measures the association between automation risk and being in a city.
A well-established notion is that this specification raises at least two issues. First, in the absence of random spatial assignment, δ is identified by the sub-sample of ‘movers’, which is a highly selected group of individuals (Combes & Gobillon, 2014). Given that mobile workers tend to be those who stand to win the most from moving to larger cities, the resulting estimates of δ can not necessarily be referred to the whole population.
Another issue is that δ in equation (1) encompasses both static and dynamic upgrades. Since our purpose is to identify the relative role of static and dynamic upgrading mechanisms in decreasing automation risk, we choose to follow another identification strategy. We assume that individual automation risk at time t is determined by the risk observed at t-1, by any types of career upgrades happened between t-1 and t, and the individual-specific return to one additional year of work experience. When distinguishing only between cities and rural areas, automation risk of worker i at date t can be written as:
𝑝𝑖𝑡 = 𝑝𝑖𝑡−1+ 𝛾𝑑𝑖𝑡𝐶𝑑𝑖𝑡−1𝑅 + 𝜁𝑑𝑖𝑡𝐶 + 𝜇𝑖 (2) where, as before, 𝑑𝑖𝑡𝐶 is a dummy indicating whether the individual works in a city at time t, and is another dummy that takes value 1 if the individual worked in a rural area at t
− 1, and µi is the individual return to experience.
Contrary to equation (1) an empirical model based on this setup is able to distinguish between the one-time static effect of moving (γ) and the dynamic upgrade of working in a
large city (ζ). Consider first an individual who worked in a rural area at date t − 1, and decides to stay for at least one year. In this case the interaction term representing location change is equal to zero such as the single term 𝑑𝑖𝑡𝐶 which is meant to capture a year of experience gathered in a city. Thus, in this case observed automation risk changes according to the individual return to labour market experience: pit = pit−1 + µi. However, those who decide to move to a large city, receive the static upgrading effect of moving (γ) and also benefit from one additional year of urban experience (assuming that people move at the beginning of the date). Since we assume that moving matters only when the destination is a large city, those who move to a rural area can only reduce their automation risk by the degree of µi.
Solving equation (2) recursively, 𝑝𝑖𝑡 can be expressed as a function of some initial value pi0, past moving decisions, urban experience accumulated until date t and the individual’s own career path represented by the linear trend µit:
𝑝𝑖𝑡 = 𝑝𝑖0+ 𝛾 ∑ 𝑑𝑖𝑡𝐶𝑑𝑖𝑡−1𝑅
𝑡
𝜏=1
+ 𝜁 ∑ 𝑑𝑖𝑡𝐶
𝑡
𝜏=1
+ 𝜇𝑖𝑡 (3)
Assume that p0i is the automation risk the worker faces when she enters the labour market for the first time and it is determined by a set of observed individual characteristics (i.e.
educational attainment) and also by unobserved fixed effects:
𝑝𝑖0 = 𝛼𝑖 + 𝐗𝑖0′ 𝛽
Equation (3) shows that past urban experience, moving decisions might have long-lasting effects on automation risk irrespective of the actual location of the worker. If this equation holds pooled OLS or FE estimates of δC in equation (1) is biased upwards if individuals with more urban experience tend to locate in large cities. Another issue regarding the estimation of equation (1) is that it ignores individual-specific trends which might also be correlated with location choice. Estimating equation (3) directly would not solve these problems, because without any further restrictions on αi or µi one of these effects cannot be identified. However, by first-differencing equation (3) and excluding moving-years might provide an expedient way to analyse the association between working in cities and automation risk even in the presence of individual trends and unobserved fixed effects.
For the time being, assume that X does not change over time. In this case, first-differencing leads us to the following equation:
∆𝑝𝑖0 = 𝛿̂𝑑𝑖𝑡𝐶 + 𝜇𝑖. (4) Note that, 𝛿̂ in equation (4) captures different upgrading mechanisms depending on whether the worker moves or not at time t. While in the case of individuals who stay in a large urban area 𝛿̂ is equal to ζ, when a worker decides to move to a city at time t, the coefficient of the city dummy embraces both dynamic and static career upgrades: 𝛿̂ = 𝛾 + 𝜁. Thus, removing move years from the sample allows us to identify dynamic upgrades (ζ) separately, using both cross-section and longitudinal variation of movers.2
As opposed to equation (3) the first-differenced model does not contain the confounding factors of αi and Xi, what remains is only the individual-specific return of experience (µi) which can also be eliminated using the within-estimator (if T > 2). Therefore, as long as the marginal effect of work experience varies between individuals, an empirical model based on equation (4) is preferable to equation (1). Allowing Xitto vary in time, and adding a set of time dummies and an error term, our empirical model in its general form can be written as:
∆𝑝𝑖𝑡 = ∆X𝑖𝑡′ 𝛽 + 𝛿̂𝑑𝑖𝑡𝐶 + 𝜇𝑖 + 𝜆𝑡 + 𝜀𝑖𝑡 (5) Although this method is still incapable to identify one-time static upgrades separately, by estimating equation (5) on the full dataset and then by estimating it using observations for move years we can infer on the degree to which career advancements of moving to cities is associated with changes in automation risk. This can be done if multiple urban categories or a full set of regions-dummies are considered. Since figures on the distribution of automation risk (see Figures 1-3) suggest that low-risk jobs tend to concentrate in the three Swedish metros and some of the large cities, during the empirical analysis we use two urban categories (metros and large urban city-regions) which are defined further down.
4. Data
We use matched employer-employee data from Statistics Sweden covering the years between 2005 and 2013. In this data, the annual wages of individuals active on the Swedish labour market, as well as their occupations, place of work and place of residence at the municipality level are recorded (together with numerous other individual attributes
2 A similar strategy has been used by D’Costa and Overman (2014) for the estimation of the urban wage growth premium in England.
like age, sex, family status etc). The period 2005-2013 is chosen due to two main reasons.
Previous accounts have not identified labour market polarization tendencies in Sweden prior to the initial year of our analysis (Åberg, 2015), which makes this period particularly suitable for our purpose as we can expect substantial occupational shifts to occur. Second, the final year is chosen due to a revision in occupation codes from 2013 and onwards which makes comparisons prior and after 2013 virtually impossible. To define occupations, the 4-digit SSYK-96 occupation nomenclature is used which is broadly consistent with the international ISCO-88 classification.
Our measure of automation risk follows Frank et al. (2018) that is based on US Department of Labor’s O*NET database which contains detailed information on the skill requirements and job characteristics of 867 elements of the 6-digit Standard Occupational Classification (SOC) system.3 The O*NET scales are matched to the Swedish data at the 4-digit SSYK level in two steps. We first mapped SOC codes onto the SSYK classification using the official correspondence table between SSYK-96 and ISCO-88, and then the table between ISCO and SOC. Since there is not a one-on-one correspondence between SOC and ISCO, in the case of multiple correspondences we matched the same SOC code to multiple ISCO codes. During this procedure we implicitly assumed that the task-content of occupations and the impacts of automation process does not vary much between Sweden and the US.
After the matching procedure, we calculated the probability of automation for 99% (352 out of 355) of the 4-digit SSYK-96 occupations using the estimation method of Frey &
Osbourne (2013). This measure approximates the probability of being affected by the negative effects of automation covering job loss and also changes in the task-content which does not always imply displacement but may force workers to adapt and improve their skills.
Table 1 lists some occupations from the top and bottom of the automation risk distribution.
The less-susceptible occupations include medical doctors, psychologists, special education teaching professionals, therapists and nurses. Clearly, this latter group of occupations involve tasks such as caring, communication and social perceptiveness. The most susceptible occupations, however, involve routine tasks and sometimes require physical skills. This group contains occupations such as manufacturing workers, assemblers and
3We are grateful to Hyejin Youn who provided us with this data.
low-skilled clerks.
Table 1 about here
Instead of identifying the effects of a full set of region dummies, we classified the 72 Swedish labour market regions into one of the following region-types: Metro areas, Large urban areas and Small regions. The ’Metro areas’ category labels the three largest cities of Sweden (Stockholm, Göteborg and Malmö), the category of ‘Large urban areas’ labels other urbanized areas and university cities such as Umeå, Linköping, Karlstad etc. while Small regions refers to the remaining regions of which in a sparsely populated country like Sweden, the majority are located far away from the largest urban regions. Originally, Statistics Sweden distinguishes between five categories of which the first and second correspond to our ‘metro’ and ‘large’ categories, and the rest makes up our ‘Rural’ category.
Table A1 in the appendix summarize the occupations with highest and lowest automation risk in each of the three groups. As demonstrated there, if assuming similar automation risks for all occupations irrespective of region, the spatial sorting of occupations will cause differences in what type of occupation that are at risk in which region. For example, while the least susceptible occupations (upper panel) mainly relates to more technical occupations in the metro regions, it is different teaching professionals that are mostly concentrated in the large and small regions. Conversely, in large and small regions employment in occupations with high automation risk (lower panel) is mainly found among different forms of machine operators and assemblers, while it in the metro regions mainly concerns clerks and service workers. Hence, this implies that the geography of automation risk is greatly structured by the spatial division of work.
As depicted in Figure 1, these differences between metro, large and small regions mainly concern the spatial concentration of occupations with a very low automation risk. The larger the region in terms of employment, the greater the concentration of low-risk occupations.
Comparing 2005 with 2013, we also find indications that average automation probability tend to increase in smaller regions while remaining fairly stable in the largest ones. Hence, during the period we study in this paper, workers in smaller regions have become increasingly susceptible for automation.
Figure 1 about here
This is partly related to the ongoing spatial division of job creation and destruction in Sweden, as job creation during the last decades have been mainly attributed to the large
urban regions (Eriksson & Hane-Weijman, 2017). As shown in Figure 2 (right) employment has mainly increased in the largest regions, while the relative few remaining jobs in smaller and peripheral regions to the north-western border and central parts of Sweden is associated with an increasing automation risk over time (left).
Figure 2 about here
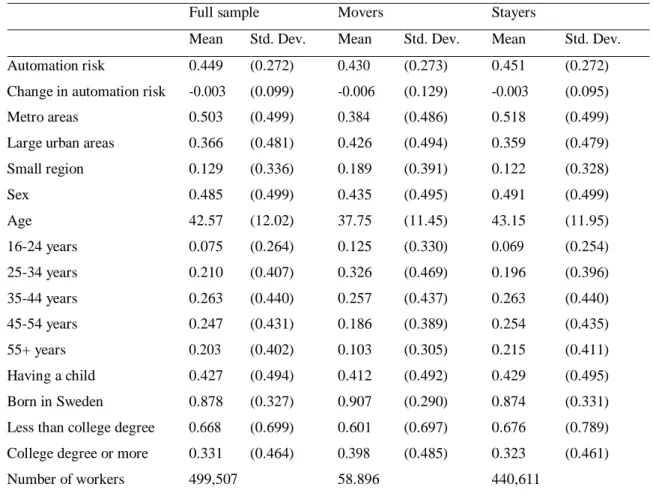
Summary statistics of our variables are reported in Table 2 which distinguishes between movers (i.e. those who move at least once from one region to another region) and stayers (i.e. those who never move and stay in the same region). In terms of mobility, stayers are oversampled, only 12% of the observed workers changed location at least once during the period 2005 to 2013. Automation probability is somewhat lower for movers (43%) than for non-movers (45%). Similar differences can be found if we look at the yearly average changes of automation risk. For movers, automation probability shrinks faster than for stayers in any type of urban category. On average, 87% of the observations are individuals working in metros or other large cities in year t, and metro regions alone represent half of the overall sample. The regional division however conceals considerable differences between moving categories. More stayers tend to work in metro areas (52%) than movers while more movers locate in large cities (43% compared to 36%). These figures, by and large, confirm previous studies on mobility in Sweden showing that the main flows are between small and large regions and large regions and metros, respectively (Eriksson &
Rodriguez-Pose, 2017)
Table 2 about here
In terms of age, the average mover in our sample is five years younger than the average stayer (43 years). Workers between 16 and 34 years moving for the first job or education are thus more geographically mobile (Lundholm, 2007). The largest number of observations can be found in the ’35-44 years’ age category in the full sample, however, movers concentrate in the ’25-34 years’ cohort. 48% of the observed workers are women and 43% have at least one child. Along these attributes slight differences can be seen between movers and stayers. Among movers there are fewer women and parents. One- third of the overall sample have a college degree (or more), while in the case of movers the proportion of highly educated workers is 7 percentage points higher (40%).
In sum movers differ from stayers mainly in terms of automation risk (both in levels and changes), age and education. Minor differences can be observed in terms of sex, family
and place of birth. Movers are, on average, younger and more educated than stayers and reduce their automation risk faster. Controlling for these characteristics is extremely important in models where identification comes from only movers to get accurate estimates on the coefficient of region types (D’Costa & Overman, 2014).
5. Results
We start by estimating individual automation risk as specified in Equation (1). This model explains pit with individual characteristics, a set of time dummies and two additional dummies for metros and large urban areas. Since the dependent variable is continuous (ranging between 0 and 1) we start with pooled-OLS models and to consider unobserved heterogeneity and spatial sorting we then estimate a fixed-effect model.
Results are reported in Table 3 where the first column shows that, in the absence of any individual controls, having a job in a metro region is associated with having 6.8 percentage points lower automation probability than working in a small region (reference). The coefficient of other large regions is half as large as the coefficient of metros, but still significant at the 1% level. Introducing worker characteristics including sex, age, education, place of birth and a dummy for having children in Column 2, reduces the overall size of the coefficient of metros to about 3 percentage points, and of other large regions with about 1.4 percentage points. Column 3 controls for 2-digit NACE-codes which causes a slight further decrease in the overall role of cities. Since pooled OLS models ignore individual specific effects, the assumption on the orthogonality of the error term might be violated. To address this issue, the last column allows for individual fixed effects, meant to control the possibility of spatial sorting caused by time-invariant unobservables. As we introduce worker fixed effects, the magnitude of the cities drops considerably. In the case of metros the influence on automation risk is reduced to -0.3 percentage points compared to small regions, and for large urban areas we get even lower (and insignificant) estimates.
Table 3 about here
The results of Table 3 thus suggest that individual workers can benefit only from working
in the largest metro areas of Sweden to reduce automation risk. In the case of workers in other large regions, the negative correlation with automation risk is largely driven by unobserved worker heterogeneity. However, estimates based on equation (1) might still be biased if unobserved worker characteristics influence not just the level of automation risk, but also its year-to-year changes. Some workers might, for example, progress faster along their career paths than others by being more ambitious (time-invariant) or by enjoying knowledge spillovers (time-variant). In such cases one additional year of work experience might have a larger negative impact on automation risk. If the idiosyncratic differences in the effects of experience are driven by time-varying unobservables which are related to the location, estimates for δ will be biased. To rule out this possibility we proceed by estimating the change in automation risk as specified in Equation (5).
Results in column 1, of Table 4 show that working in one of the largest Swedish metro areas in year t is negatively associated with changes in automation risk between t and t-1.
The average yearly decrease in automation risk is 0.2 percentage points greater in metros than in small regions. Other large regions have a smaller but significant negative coefficient, and this pattern remains unchanged across specifications. Column 2 adds individual controls and a set of industry dummies to the base-model. The role of cities (both metros and large urban areas) drop significantly as expected. Column 3 reports results when individual fixed effects are included to control for the idiosyncratic effect of labour market experience. The estimates are surprisingly similar to the ones reported in column 1 and higher than the estimates of the augmented model in column 2. As discussed above, in the presence of individual FEs, the identification of individual career upgrading mechanisms is based on the subset of workers who move. Therefore, move years take a much larger part in the estimation process. If either, or both, of the above-mentioned city related upgrading mechanisms exist and they are estimated using only a small fraction of the sample, one might get larger estimates for the upgrading effect when looking at yearly changes of automation risk. Note that, when estimating change in automation risk, the R- squares decrease, as compared to the models in Table 3. The lower level of R-square might be due to a variety of unobserved idiosyncratic reasons behind changes in automation risk like management strategies of firms (Granrose & Portwood, 1987) or social network strategies of individuals to advance career (Forret & Dougherty, 2004).
Table 4 about here
Up to this point, we have mainly focused on extent to which working in cities are associated with individual automation risk. Estimating equation (5) on a restricted sample, which excludes observations for move years, enables us to identify the role of career upgrading through gathering urban experience separately by using the cross-section and longitudinal variance on movers. By excluding move-years, the number of observations drops by only 2.2% (58,848 obs).4 As reported in column 4, estimates based on this restricted sample yield different results. One additional year of working in a metro area have an estimated -0.3 percentage point effect on the changes of automation risk. For large urban regions we estimate a smaller, but still significant coefficient entailing a -0.25 percentage point change in automation risk. Comparing column 4 and 3 one would suggest that the dynamic upgrade coming from gathering urban experience dominates over the static upgrade. Since the coefficients of interest in column 3 combine both types of mechanisms and is lower than those in column 4, moving to cities per se does not imply any changes of automation risk.
Estimation results of Equation (5), without observations for move-years, thus suggest that dynamic career upgrading through gathering urban experience drives the correlation between working in cities and automation risk for the full sample. However, workers with different characteristics might benefit from working in cities to a varying degree.
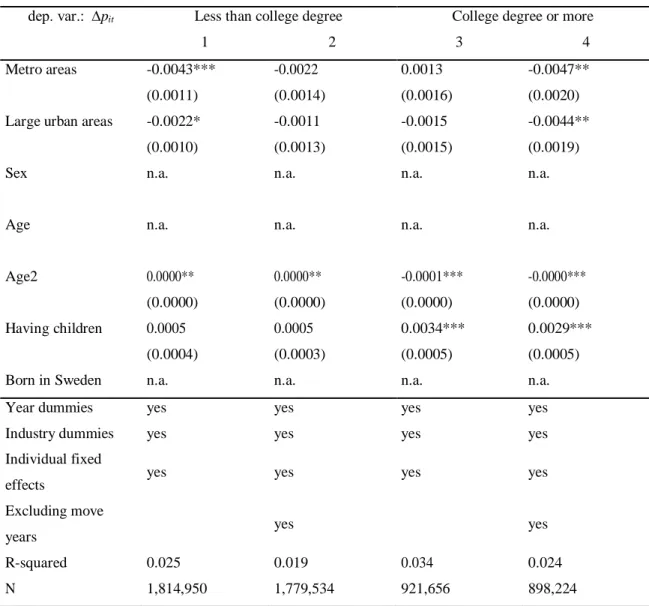
Educational attainment is one such individual attribute by which the relative role of different career upgrading mechanisms might vary across the members of the workforce.
Workers with a college degree (or more) typically have access to a wider range of low- risk jobs. Conversely, low-skilled workers have limited options relative to their more educated peers which might set a bar against the reduction of automation risk by climbing the career ladder. This begs the question as to how the benefits of working in cities vary across education groups. To investigate the conceivable heterogeneity of effects, we divide the sample into two education groups (less than college compared to college or more) and then re-estimate equation (5) in its general form separately for each group.
Results for the two education groups are reported in Table 5. The first two columns refer to workers with low education attainment. Column 1 reports negative and significant association between working in cities and ∆pit for both urban categories. Column 2 drops
4 The small number of observations for move years in our sample might explain why column 3 report larger estimates.
move-years but indicate no sign of dynamic career upgrades which would affect the risk of being automated out. These findings suggest that workers without a college degree benefit from cities when they start working there. In other words, moving to a metro-region is associated with a one-time reduction of automation risk. This implies that low-skilled workers are more likely to get a low risk-job right after moving, but they tend to remain in that type of job for longer periods of time. In contrast, workers with high education seem to benefit only from the dynamic career opportunities of cities. As shown in column 3, city- dummies are insignificant while column 4 shows some evidence in favour of dynamic career upgrades in both urban categories. This implies that for more educated workers cities act as career escalators but there is no sign of any static career upgrades stemming from moving to a city per se. This suggests that more educated workers do not necessarily enjoy immediate benefits when moving to a large city. While gathering urban experience matters for educated workers, the static (one-off) upgrade of moving to a city prevails only in the case of low-skilled workers. There are two plausible explanations for this. First, the likelihood of finding a similar job in larger regions as they had before moving is greater for more skilled workers, and can from that achieve further career goals later. Second, there might be a selection of movers in the different education groups as more high-skilled movers have lower automation risk before moving and therefore the move itself has no significant effect on the change, but rather the gaining of work experience in larger regions.
In fact, when comparing the average automation risk of movers, high-educated movers have indeed a far lower automation risk than low-educated movers (0.28 compared to 0.54).
However, in comparison with workers that remain in the same region the entire period, high educated movers have a slightly higher automation risk than highly educated stayers the year before migrating (0.28 compared to 0.25). Among the low educated movers, the movers actually have lower average automation risk than stayers (0.54 compared to 0.55).
This implies that skilled workers at higher risk have resources to find alternative employment elsewhere while low educated workers at higher risk are more likely to remain.
Given the spatial distribution of automation risk depicted in figure 2, this entails that the regional differences in job opportunities are reinforced over time.
Table 5 about here
A clear limitation of our analysis is that it relies on an occupation-level risk measure which makes it impossible to look at the within-occupation variance in automation risk. This is problematic, because the set of tasks performed in a job may differ among regions, in
which case occupation- level risk measures provide a false picture on the spatial differences of risk, and potentially bias our results. The actual automation risk of a worker might also be affected by regional attributes such as collective agreements, local legislation and other institutional factors. If these regional characteristics are correlated with region size, our results might be biased. Besides, if firms in small regions can’t afford investing in automation technologies due to the lack of funds or technology- complementing skilled labour, the ongoing process of automation slows down in these areas which might cause an upward bias in our estimates. Despite these limitations, we nevertheless believe that our results provide useful insights on how large metropolitan areas reduce individual automation risk by increasing the chance of holding down resilient jobs.
6. Conclusions
Workers in smaller cities are usually depicted as being more exposed to the threat of technological unemployment caused by automation, because workers in such regions tend to rely more on production-related routine skills which is unlikely to change in the future (Frank et al. 2018). The aim of this paper was to assess the potential spatial differences in how automation may influence the labour market. We analysed this first by describing the regional variation in automation susceptible occupations and how that have changed over time. We then regressed if, and for whom, large cities offer career opportunities which might imply the reduction of automation risk. This was accomplished by means of matched employer-employee data covering every worker on the Swedish labour market in the 2005-2013.
Our main findings suggest that the concentration of susceptible jobs is higher in smaller regions and that the urban-rural divide has increased over the period studied here (covering the Great Recession). In that sense, our findings confirm previous results of Frank et al.
(2018) on the US that also find a similar urban-rural divide. By means of the level of detail of our data, we can however show that the groups of workers at risk of automation differs across the regional hierarchy. While the highest concentrations of workers in susceptible occupations in metro-regions are different forms of clerks and service workers, a greater share of manufacturing workers are at risk outside the city-regions. In that sense, the spatial division of labour entails that different groups of workers are at greater risk of
facing automation-related displacement in different types of economic spaces. Given the fact that completely new tasks tend to occur in large cities with diversified economies where the higher potential for spillovers and learning fosters the birth of new activities (Duranton & Puga, 2001), we can expect that these spatial differences also entails increasing transaction costs for susceptible groups of workers to adjust to the ongoing realignments of the labour markets if better local alternatives are deteriorating over time.
Since the majority of new jobs have been created in the largest labour markets (c.f., Eriksson & Hane-Weijman, 2017), and the remaining jobs in smaller regions are becoming increasingly susceptible this would entail that migration to larger regions is the main viable strategy to adapt. Especially since the probability of a job to appear in a region is higher if related jobs are already present (Muneepeerakul et al., 2013; Shutters et al., 2016), we should expect that the majority of new jobs in the service sector are expected to be created in large cities, where the employment share of services is larger.
Consequently, large cities are more likely to remain more resilient to automation.
The logical consequence of this finding is that moving to cities might increase the chances of finding a less-automatable job as years go by. Our results indeed show that working in cities have a negative and statistically significant effect on changes in automation risk, even after controlling for a wide range of individual attributes influencing occupation choice and labour market opportunities. In that sense, the continued agglomeration of employment is likely to prevail on behalf of the smaller regions. We can however show that this “metropolitan effect” works differently across education groups. While more educated workers largely benefit from urban experience that enable them to upgrade careers dynamically, low-skilled workers reduce their automation risk when they move (simply because cities tend to specialize on low-risk tasks). Overall, these findings suggest that moving to larger cities seems to be a valid individual response to automation, specifically for those who have low education levels and are willing to move. However, as the returns to education tends to be higher in larger regions (e.g., De la Roca & Puga, 2017), the long-term benefits of mobility prefer high-skilled workers more than low- skilled workers. Irrespective of skill-levels, a large proportion of workers living in lagging-behind rural areas and small cities, however, are unlikely to move for a variety of reasons. This includes, for example, plummeting housing prices, lack of sufficient qualifications and up-to-date skills, and existing transfer payments (Partridge et al., 2015;
Rodriguez-Pose, 2018). Therefore, along with training programs that can ease local
matching, mobility enhancing instruments such as travelling and housing allowances or improving housing accessibility in cities might be useful tools to alleviate technological unemployment (c.f., Storper, 2018).
Finally, if indeed about 46% of all jobs in the OECD face a significant risk of being replaced by machines in the near future as suggested by Nedelkoska & Quintini (2018), a greater awareness needs to be put on the fact that this will not only vary across nations but also vary greatly within national economies and influence different workers, with different skill-sets in different types of regions. This calls for political attention, and is clearly connected to the current debate concerned with the link between structural change and political polarization and discontent challenging established post-war political structures around Europe on the one hand, and calls for a new “place-sensitive distributed development policy” on the other (Storper, 2018; Rodríguez-Pose, 2018; Iammarino et al., 2019).
References
Acemoglu D, Restrepo P (2018a) The race between man and machine: Implications of technology for growth, factor shares, and employment. American Economic Review 108:
1488–1542
Acemoglu D, Restrepo P (2018b) Robots and jobs: Evidence from US labor markets.
NBER Working Paper 23285
Acemoglu D, Restrepo P (2019) Automation and new tasks: How technology displaces and reinstates labor. Journal of Economic Perspectives 33: 3–30
Acemoglu D Restrepo P (2020) The wrong kind of AI? Artificial intelligence and the future of labour demand. Cambridge Journal of Regions, Economy and Society 13: 25–35 Andersson L–F, Eriksson R H, Danley T, Henning M (2020) Worker’s participation in regional economic change following plant exit. Small Business Economics 54: 589–604 Arntz M, Gregory T, Zierahn U (2016) The risk of automation for jobs in OECD countries:
A comparative analysis. OECD Social, Employment and Migration Working Papers 189 Autor D H (2014) Polanyi’s paradox and the shape of employment growth. NBER Working Papers 20485
Autor D H, Salomons A (2018) Is automation labor share–displacing? Productivity growth, employment, and the labor share. Brookings Papers on Economic Activity 49: 1–
87
Autor D H, Levy F, Murnane R J (2003) The skill content of recent technological change:
An empirical exploration. Quarterly Journal of Economics 118: 1279–333
Borghans L, ter Weel B, Weinberg B A (2008) Interpersonal styles and labor market outcomes. Journal of Human Resources 43: 815–858
Boskin M J (1974) A conditional logit model of occupational choice. Journal of Political Economy 82: 389–98.
Brynjolfsson E, McAfee A (2011) Race against the machine: how the digital revolution is accelerating innovation, driving productivity, and irreversibly transforming employment and the economy. Lexington, MA: Digital Frontier Press.
D’Costa S, Overman H (2014) The urban wage growth premium: Sorting or learning?
Regional Science and Urban Economics 48: 168–179
De La Roca J, Puga D (2017) Learning by working in big cities, Review of Economic Studies 84: 106–142
Duranton G, Puga D (2001) Nursery cities: Urban diversity, process innovation, and the life cycle of products. American Economic Review, 91: 1454–1477
Duranton G, Puga D (2005) From sectoral to functional urban specialisation. Journal of Urban Economics 57: 343–70
Eriksson, R H, Hane–Weijman, E (2017) How do regional economies respond to crises?
The geography of job creation and destruction in Sweden (1987–2010). European Urban and Regional Studies 24: 87–103
Eriksson R H, Rodriguez–Pose A (2017) Job–related mobility and plant performance in Sweden. Geoforum 83: 39–49
Faggio G, Silva O (2014) Self–employment and entrepreneurship in urban and rural labour markets. Journal of Urban Economics 84: 67–85
Filer R K (1986) The role of personality and tastes in determining occupational structure.
Industrial and Labor Relations Review 39: 412–24
Florida R (2004) Cities and the Creative Class. Routledge, London.
Frank M R, Sun L, Cebrian M, Youn H, Rahwan I (2018) Small cities face greater impact from automation Journal of the Royal Society Interface 15
Frank M, Autor D, Bessen J E, Brynjolfsson E, Cebrian M, Deming D J, Feldman M, Groh M, Lobo J, Moro E, Wang D, Youn H, Rahwan I (2019) Toward understanding the impact of artificial intelligence on labor. Proceedings of the National Academy of Sciences of the USA 116: 6531–6539
Frey C B, Osborne M A (2017) The future of employment: How susceptible are jobs to computerisation? Technological Forecasting and Social Change 114: 254–280
Forret M L, Dougherty T W (2004) Networking behaviours and career outcomes:
differences for men and women? Journal of Organizational Behavior 25: 419–437 Glaeser E L (1999) Learning in cities. Journal of Urban Economics 46: 254–277
Glaeser E L, Maré D (2001) Cities and Skills. Journal of Labor Economics 19: 316–342 Gordon, I R (2015) Ambition, human capital acquisition and the metropolitan escalator.
Regional Studies 49: 1042–1055
Graetz G, Michaels G (2018) Robots at work. Review of Economics and Statistics 100:
753–768
Granrose C S, Portwood J D (1987) Matching individual career plans and organizational
career management. The Academy of Management Journal 30: 699–720
Heckman J J, Stixrud J, Urzua S (2006) The effects of cognitive and noncognitive abilities on labor market outcomes and social behavior. Journal of Labor Economics 24: 411–482 Iammarino S, Rodriguez–Pose A, Storper M (2019) Regional inequality in Europe:
evidence, theory and policy implications. Journal of Economic Geography 19: 273–298 Leigh N G, Kraft B, Lee H (2020) Robots, skill demand and manufacturing in US regional labour markets. Cambridge Journal of Regions, Economy and Society 13: 77–97
Levy F, Murnane R J (2004) The new division of labor: How computers are creating the next job market. Princeton University Press, Princeton
Lundholm E (2007) Are movers still the same? Characteristics of interregional migrants in Sweden 1970–2001. Tijdschrift voor economische en sociale geografie 98, 336–348 MacKinnon, D. (2017) Labour branching, redundancy and livelihoods: Towards a more socialised conception of adaptation in evolutionary economic geography. Geoforum 79:
70–80
Moretti E (2010) Local multipliers. American Economic Review 100: 373–77 Moretti E (2012) The new geography of jobs. Houghton Mifflin Harcourt, Boston.
Muneepeerakul R, Lobo J, Shutters S T, Goméz–Liévano A and Qubbaj M R (2013) Urban economies and occupation space: Can they get there from here? PLoS ONE 8:
e73676.
Nedelkoska, L Quintini G (2018) Automation, skills use and training. OECD Social, Employment and Migration Working Papers, No. 202
Partridge M D, Rickman D S, Olfert R M, Tan Y (2015) When spatial equilibrium fails:
Is place–based policy second best? Regional Studies 49: 1303–1325
Riggio R E, Reichard R J (2008) The emotional and social intelligences of effective leadership. An emotional and social skill approach. Journal of Managerial Psychology 23:
169–185
Rodríguez–Pose A (2018) The revenge of the places that don’t matter (and what to do about it). Cambridge Journal of Regions, Economy and Society 11: 189–209
Sicherman N, Galor O. (1990) A theory of career mobility. Journal of Political Economy 98: 169–192
Scott A J (2009) Human capital resources and requirements across the metropolitan hierarchy of the USA. Journal of Economic Geography 9: 207–226
Shutters S T, Muneepeerakul R, Lobo J (2016) Constrained pathways to a creative urban economy. Urban Studies 53: 3439–3454
Storper M (2013) Keys to the city: How Economics, institutions, social interaction, and politics shape development. Princeton University Press, Princeton.
Storper M (2018) Separate worlds? Explaining the current wave of regional economic polarization. Journal of Economic Geography 18: 247–270
Åberg R (2015) Svensk arbetsmarknad mot polarisering efter millennieskiftet.
Arbetsmarknad Arbetsliv 21: 8–25
Table 1: Automation risk of least and most susceptible occupations
Occupation title Automation risk
BOTTOM 10
Medical doctors 0.001
Dieticians 0.004
Speech therapists 0.005
Psychologists and related professionals 0.007
Teaching professionals, academic subjects 0.008
Geriatric nurses 0.009
Medical care nurses 0.009
District nurses 0.009
Special education teaching professionals 0.010
Production and operations department managers in education 0.010 TOP 10
Electrical-equipment assemblers 0.908
Pharmaceutical assistants 0.920
Metal wheel-grinders, polishers and tool sharpeners 0.925
Government tax and excise officials 0.930
Cashiers and ticket clerks 0.934
Jewellery and precious-metal workers 0.950
Debt-collectors and related workers 0.950
Library and filing clerks 0.958
Numerical clerks 0.959
Paperboard, textile and related products assemblers 0.970
Table 2: Descriptive statistics
Full sample Movers Stayers
Mean Std. Dev. Mean Std. Dev. Mean Std. Dev.
Automation risk 0.449 (0.272) 0.430 (0.273) 0.451 (0.272)
Change in automation risk -0.003 (0.099) -0.006 (0.129) -0.003 (0.095)
Metro areas 0.503 (0.499) 0.384 (0.486) 0.518 (0.499)
Large urban areas 0.366 (0.481) 0.426 (0.494) 0.359 (0.479)
Small region 0.129 (0.336) 0.189 (0.391) 0.122 (0.328)
Sex 0.485 (0.499) 0.435 (0.495) 0.491 (0.499)
Age 42.57 (12.02) 37.75 (11.45) 43.15 (11.95)
16-24 years 0.075 (0.264) 0.125 (0.330) 0.069 (0.254)
25-34 years 0.210 (0.407) 0.326 (0.469) 0.196 (0.396)
35-44 years 0.263 (0.440) 0.257 (0.437) 0.263 (0.440)
45-54 years 0.247 (0.431) 0.186 (0.389) 0.254 (0.435)
55+ years 0.203 (0.402) 0.103 (0.305) 0.215 (0.411)
Having a child 0.427 (0.494) 0.412 (0.492) 0.429 (0.495)
Born in Sweden 0.878 (0.327) 0.907 (0.290) 0.874 (0.331)
Less than college degree 0.668 (0.699) 0.601 (0.697) 0.676 (0.789) College degree or more 0.331 (0.464) 0.398 (0.485) 0.323 (0.461)
Number of workers 499,507 58.896 440,611
Note: Notes: Authors’ own calculations based on a 10% random sample of the Swedish Admin Data containing 3,327,846 observations for 499,507 workers.
Table 3: Estimation on differences in automation risk (eq. (1))
dep. var.: pit 1 2 3 4
OLS OLS OLS FE
Metro areas -0.0680*** -0.0303*** -0.0192*** -0.0029***
(0.0012) (0.0010) (0.0009) (0.0007)
Large urban areas -0.0314*** -0.0137*** -0.0057*** -0.0006
(0.0012) (0.0010) (0.0009) (0.0007)
Sex -0.0253*** 0.0450***
(0.0006) (0.0006)
Age -0.0072*** -0.0062*** -0.0141***
(0.0002) (0.0002) (0.0001)
Age2 0.0001*** 0.0001*** 0.0001***
(0.0000) (0.0000) (0.0000)
College degree or more -0.2014*** -0.1378*** -0.0561***
(0.0054) (0.0044) (0.0027)
Born in Sweden -0.0522*** -0.0494***
(0.0010) (0.0009)
Having children -0.0264*** -0.0225*** -0.0013***
(0.0007) (0.0006) (0.0003)
Year dummies yes yes yes yes
Industry dummies yes yes
Individual fixed effects yes
R-squared 0.008 0.291 0.427 0.355
N 3,327,846 3,327,846 3,327,846 3,327,846
Note: Cluster-robust standard errors are in parentheses. Standard errors are clustered by worker ID. ***, ** and * indicate significant at 1%, 5% and 10% level respectively. Number of workers in the sample: 499,507.
Table 4: Estimation on change in automation risk (eq. (5))
dep. var.: ∆pit 1 2 3 4
OLS OLS FE FE
Metro areas -0.0021*** -0.0008*** -0.0019** -0.0032***
(0.0001) (0.0002) (0.0009) (0.0011)
Large urban areas -0.0009*** -0.0003** -0.0019** -0.0025**
(0.0002) (0.0002) (0.0008) (0.0010)
Sex n.a. n.a. n.a.
Age n.a. n.a. n.a.
Age2 -0.0000*** -0.0000*** -0.0000***
(0.0000) (0.0000) (0.0000)
College degree or more -0.0030*** -0.0160*** -0.0152***
(0.0008) (0.0040) (0.0040)
Born in Sweden n.a. n.a. n.a.
Having children 0.0019*** 0.0024*** 0.0021***
(0.0001) (0.0003) (0.0003)
Year dummies yes yes yes yes
Industry dummies yes yes yes
Individual fixed effects yes yes
Excluding move years yes
R-squared 0.001 0.032 0.091 0.097
N 2,736,606 2,736,606 2,736,606 2,677,758
Note: Cluster-robust standard errors are in parentheses. Standard errors are clustered by worker ID. ***, ** and * indicate significant at 1%, 5% and 10% level respectively. Number of workers in the sample: 499,507.