A hybrid cellular automaton model of tumor-induced angiogenesis
Tam´as G¨onczy, D´avid Csercsik Faculty of Information Technology and Bionics,
P´azm´any P´eter Catholic University and Physiological Controls Research Center,
Research and Innovation Center of ´Obuda University
Budapest, Hungary
Email: tamas.gonczy@gmail.com, csercsik@itk.ppke.hu
Johanna S´api, Levente Kov´acs Physiological Controls Research Center,
Research and Innovation Center of ´Obuda University
Budapest, Hungary
Email:{sapi.johanna, kovacs.levente}@nik.uni-obuda.hu
Abstract—Several studies have shown that tumor growth is highly dependent on the presence of a mature vascular net- work, thus therapies that inhibit tumor-induced vasculariza- tion mechanisms can play a crucial role in the fight against cancer. In order to develop effective targeted therapies and individualized treatments, we have to consider the type and molecular background of vascularization mechanisms and the stage of the disease. In this paper a hybrid cellular automaton model of pathological angiogenesis is presented, that explicitly describes the pathophysiological processes taking place during tumor progression. By simulating tumor cell proliferation and necrosis, the diffusion of proangiogenic factors and nutrients, sprouting angiogenesis and alternative vascularization mecha- nisms, the model is able to reproduce similar capillary networks and characteristic structures compared to results obtained in vivo.
I. INTRODUCTION
According to studies conducted by the World Health Or- ganization, the incidence of cancer has increased from 12.7 million in 2008 to 14.1 million in 2012. This trend is expected to continue, leading to an increase by about 70% worldwide in just two decades, thanks to the continued growth and aging of the population and the spread of risk factors [1].
Cancer is a collection of diseases that can affect most tissue types of the human body, and each tumor type has unique features and progression. Physiological processes con- trolling cellular functions, like proliferation and apoptosis, are disrupted in the tumor environment. For many decades, intravenous cytotoxic chemotherapy, radiation therapy and in some cases surgical oncology have been the most widely used treatments for cancerous diseases. The idea of inhibiting the signaling pathways of certain tumor-specific regulatory factors instead of targeting the rapidly dividing cells led to novel therapeutic approaches and the emergence of targeted molecular therapies (TMTs) [2].
This project has received funding from the European Research Council (ERC) under the European Unions Horizon 2020 research and innovation programme (grant agreement No 679681).
A. Therapeutic Approaches
Modern therapeutic approaches for the treatment of ma- lignant tumors can be divided into two main groups. The first group consists of conventional therapies that aim to completely or partially remove the tumor from the body. Other conventional approaches, such as chemotherapy and radiation therapy share the common feature of targeting rapidly dividing cells. This results in serious side effects, since there are other cell populations under continuous division in the human body [3].
Over the past few decades, the number of alternative and supplementary cancer treatments have increased significantly.
New families of targeted therapies, namely antiangiogenic and antivascular therapies have become a component of clinical treatment in the past few years, thanks to the high number of studies in the field that allow for a better understanding of the physiological background of tumor growth [4].
B. Antiangiogenic Therapy
Signaling pathways of proangiogenic factors are among the most common targets of TMTs. Inhibition of the signaling of epidermal growth factor (EGFR) or vascular endothelial growth factor (VEGF) on any level can effectively block the neovascularization processes accompanying solid tumor devel- opment. TMTs have also expanded the range of possibilities for individualized cancer treatments [2].
The growth of a tumor is highly dependent on the continu- ous supply of oxygen, nutrients, and host-derived regulator molecules. In order to cover the basic metabolic needs of the cells, the tumor is forced to develop its own vascular network by inducing angiogenesis [5]. Antiangiogenic therapy is designed to inhibit this process by blocking the signaling pathways of proangiogenic factor receptors, such as VEGF, HER1 or HER2. The VEGF-VEGFR-2 appears to be one of the most important signal transduction pathways involved in tumor angiogenesis, which makes VEGF inhibition a promis- ing therapeutic approach.
C. Model-Based Therapeutic Approaches
Several studies have investigated antiangiogenic therapies, and showed that in many cases the overall effectiveness is far behind expectations. Other studies stated that the main cause of the decline in efficiency is the poorly chosen drug administration strategy [6]. In order to design optimal dosage protocols and individualized therapies, we need to develop computational models that are able to simulate spatio-temporal changes in the cancer cell population and its environment. An individualized targeted molecular therapy can greatly improve the quality of life for cancer patients, lower costs and increase the effectiveness of the treatments.
A mathematical model comprising ordinary differential equations may be able to simulate the temporal changes in the population of tumor cells, but these systems often have a high number of parameters that are very hard or even impossible to measurein vivoand describing spatial interactions typically leads to partial differential equations. This implies that we need to consider taking other modelling approaches as well.
In the past three decades, multiple cellular automaton (CA) models of tumor growth have been proposed [7], [8]. The biggest advantage of this approach comes from the funda- mental concept of the CA. Local connections between the cells make CAs able to model spatial changes in the hetero- geneous tumor cell population conveniently and are able to simulate complex pattern formation processes with a relatively low number of parameters. Hybrid CA models that include continuous, time-dependent processes, such as the diffusion of molecules over the discrete lattice, are able to combine the advantages of both approaches. Several models aim to simulate intracellular interactions for an accurate modelling of tumor growth or vascular development but more realistic systems combine these processes and apply a multiscale approach [9], [10], [11], [12]. Despite the high number of CA models, there is a noticeable lack of discrete modelling solutions for tumor growth that include alternative vascularization mechanisms.
Our aim in this article is to formulate a probabilistic CA based dynamical model able to describe angiogenesis and vasculature-dependent tumor growth in a computationally efficient way.
II. METHODS
In this section, the hybrid cellular automaton model is de- scribed. A square lattice simulation framework is introduced, which is capable of simulating the basic behaviors of the tumor cell population including proliferation and necrosis, different vascularization mechanisms, and the diffusion of tumor angiogenic factors (TAF).
A. Simulating the Tumor Environment
The first step towards a physiologically accurate spatio- temporal simulation of tumor growth is the basic description of the tumor environment and the host tissue. The simplest, yet adequately informative approach is to model the surrounding tissue as a square grid. Each location on this grid represents a fixed size area of the given tissue. In this approach the whole
system can be described using simple numerical matrices what makes computations fast and easy to optimize. A possible simple solution is to represent each of the four modules of the simulation framework with a separate matrix containing the states of the cells in each iteration. As a possibility for achieving maximum efficiency, a single partitioned matrix can be introduced, that can be accessed by different modules in parallel.
B. Basic Structure of the Model
The simulation framework is composed of the following four modules:
1. Tumor growth: With a given initial vascular network, a small population of tumor cells is present in the beginning of the simulation. For the aim of simplicity, we assume that tumor cells can proliferate thanks to the nutrient supply provided by adjacent blood vessels of the host tissue. Cells can proliferate exclusively if the nutrient concentration in the neighboring cell is high enough which implies that the closest blood vessel is within the diffusion distance (100µm[13])
2. TAF diffusion: The overpopulated area of the tumor leads to hypoxia, that induces TAF production and the diffusion of proangiogenic factors into the interstitial space.
3. Blood vessel evolution: At the same time the TAF re- leasing tumor enters the vascular stage, where diffusing angiogenic growth factors stimulate nearby blood vessels to grow new branches towards the stimulus or remodel the network.
4. Nutrient diffusion: Both the initially present and the newly developed vascular network components contribute to the survival and growth of the tumor cell population. A particular section of a blood vessel can provide nutrient supply for a given number of adjacent cells.
1 2
3 4
-
+
+ +
+/-
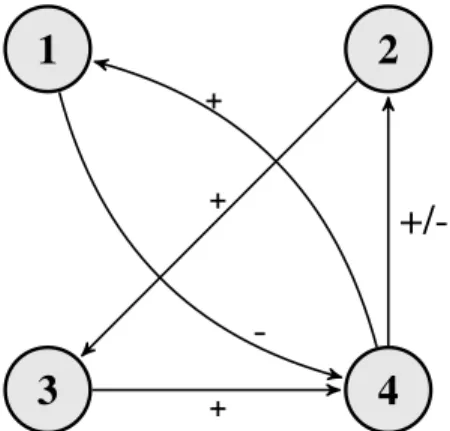
Fig. 1. Relationship of algorithm modules: 1) Tumor growth 2) TAF diffusion 3) Blood vessel evolution 4) Nutrient diffusion
As Fig. 1 shows, the different modules of the model are interconnected. As a response to a growth in the number of tumor cells (1) the amount of available nutrient per grid location (4) will decrease (thanks to the increased metabolic needs in that grid cell), and TAF diffusion (2) begins. The
released TAF molecules (2) reaching the already existing vasculature around the tumor induce angiogenic processes that lead to an increase in the number of vascularized grid cells (3). The evolving vasculature (3) provides more grid cells with nutrients (4), leading to an increase in the number of tumor cells (1) and a decreased secretion of TAF (2).
In the proposed model the cells may be in the following 4 states:
Extracellular matrix: If the given location on the 2- dimensional grid does not contain any tumor cells or a capillary, it is considered being extracellular matrix (ECM). A grid cell containing ECM can turn into a tumor cell or a capillary based on the states of its neighbors and the amount of nutrients and TAF at the given location.
Living tumor cell: A grid cell can contain tumor cells that are either living or necrotized. Basically, cells that are on the periphery of the tumor are considered living.
Necrotized tumor cell: If the grid location contains tumor cells, but it is surrounded by other tumor cells absorbing nutrients, the given grid cell will become part of the necrotic core of the tumor.
Blood vessel: A continuous network of blood vessels can form based on the amount of TAF in the grid locations.
A cell containing a blood vessel provides nutrient supply for its neighbors.
Each cell corresponds to a 20µm x 20µm area of the modelled tissue. In each iteration, the state of a given cell can change based on its current state and the state of its neighbors. For the cellular automaton rules describing alterna- tive vascularization mechanisms, one of the most commonly used approaches, the von Neumann neighborhood was imple- mented. The simple von Neumann neighborhood of a cell can be described as the cell itself and the cells at a Manhattan distance of 1. By extending this neighborhood to cells at a Manhattan distance of 2, we can simulate network evolution rules that are occurring at a larger spatial scale. Using the von Neumann neighborhood makes computations straightforward and allows for an easier extension to 3 dimensions.
Note that blood vessels and the tumor population is stored separately, meaning that a location in the 2-dimensional space can contain tumor cells and a blood vessels at the same time.
This approach seems more realistic than a configuration where tumor population and blood vessels are represented as two mutually exclusive states of a cell.
The model comprises a relatively low number of parameters that need to be identified in order to run physiologically accurate simulations. These include the amount of initially available nutrients CN0, which is related to the type of host tissue or the size limit of the avascular tumor, which is a function of the amount of available nutrients. Other parame- ters, like the probabilities of CA rules Pi can determine the likelihood of each vascularization mechanism, while changing the value of the diffusion coefficient D influences the speed of TAF diffusion.
C. Tumor Growth
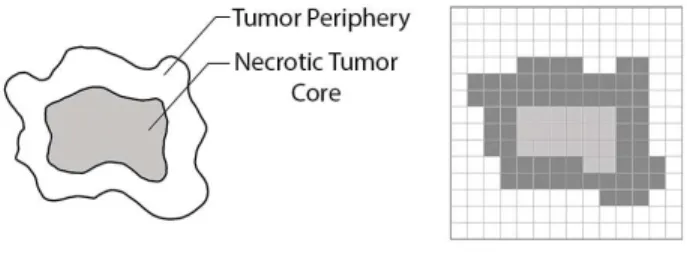
In the simplest scenario (Fig. 2), the tumor itself can be approximated as an irregular circular shape (a 2-dimensional section of a spheroid tumor), where the inner part represents the necrotic core of dead tumor cells, and the outer part contains the proliferating cells [14].
Fig. 2. The complex geometry of the tumor projected on a square lattice.
In the proposed model, simulations produced complex tu- mor morphologies (Fig. 3) thanks to the realistic, nutrient- dependent nature of tumor cell proliferation.
Time evolution of the tumor cell population is described using CA rules that can determine the current state of each cell based on the previous states of the cell itself and its neighbors.
In case of tumor cell proliferation and necrosis, the amount of nutrients at each adjacent cell is also considered.
Fig. 3. Avascular initial tumor cells (on the left) and a growing tumor population with a necrotic tumor core (green) generated by the model (on the right)
D. TAF Diffusion
The diffusion of molecules is continuous in both space and time. The density fluctuation of a diffusing material in two dimensions can be described by a partial differential equation in the form:
∂φ(x, y, t)
∂t =D
∂2φ(x, y, t)
∂x2 +∂2φ(x, y, t)
∂y2
(1) where φ(x, y, t) is the density of the diffusing material at location(x, y), and timet, andD is the diffusion coefficient.
The equation for the simulations on a discrete 2-dimensional square lattice can be derived by discretizing (1) using an
explicit or implicit method. The explicit discretization can be written as:
Ci,jn+1 = Ci,jn +Dx∆t
dx2 Ci−1,jn −2Ci,jn +Ci+1,jn +Dy∆t
dy2 Ci,j−1n −2Ci,jn +Ci,j+1n
, (2)
where Ci,jn denotes the density of the diffusing material at location(i, j)in time stepn. An explicit discretization means that in each time step n the concentrations depend only on the concentrations measured in the previous time step. An implicit discretization on the other hand takes into account the concentrations at adjacent cells from the same time step when computing the amount of TAF at a given position. Even though implicit discretizations, such as the Backward Time, Centered Space method or the Crank-Nicolson scheme [15]
can give more accurate and stable approximations for the original equation, the explicit solution is implemented in the proposed model. Since the stability of the explicit method described above is sufficient for the simulations and the grid cells represent large tissue areas compared to the scale of the diffusing angiogenic factors, there are no significant bene- fits from implementing more accurate implicit discretization schemes.
Behaviors of a TAF releasing tumor can be approximated by using (2) and tumor cells as distinct sources of the diffusing material.
Fig. 4. Diffusion of TAF molecules released by the hypoxic tumor cell population after reaching the crtical size of a few mm3 (Dx = Dy = 2, timestep = 0.1). We can see that only living tumor cells release TAF molecules.
Tumor cell populations were initially placed in an un- vascularized area simulating the state when diffusion-limited nutrient uptake covers the metabolic needs of the tumor. This is the avascular phase where no tumor cells are angiogenic and expansion of the tumor is restricted to a few mm3. A state transition (referred to as angiogenic switch [16]) occurs (Fig. 4), resulting in the release and diffusion of proangiogenic factors (TAF).
E. Blood Vessel Evolution
In order to simulate the evolution of capillary networks (Fig. 6) in the presence of an angiogenically active tumor cell population, we need to consider the interactions between the ECM and tumor cells (i.e. nutrient and TAF diffusion) and interactions between the ECM and endothelial cells (i.e. TAF diffusion).
Alternative Vascularization Mechanisms: Next to the funda- mental process of endothelial sprouting, where new capillary buds from pre-existing host tissue capillaries are formed, 5 alternative vascularization mechanisms have been discovered in the past decades. These mechanisms in most cases take place simultaneously and can share some molecular features.
Non-sprouting forms of angiogenesis include vessel co-option, intussusceptive microvascular growth, glomeruloid angiogen- esis, postnatal vasculogenesis and vasculogenic mimicry [17].
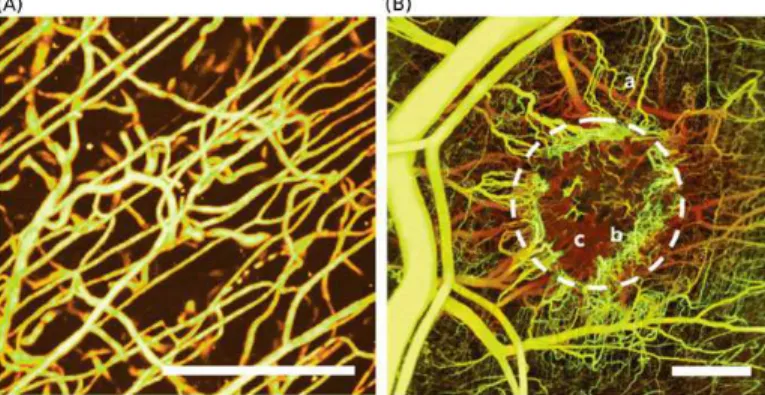
Fig. 5. Differences between normal (A) and tumor-induced (B) vascular networks. Several bifurcations, loops, glomeruloid bodies and a chaotic structure in general. (Reprinted from [18] with permission. Copyright 2011 James W. Baish et al.)
Each of these processes are expected to result in different pathological features shown by Fig. 5. Alternative mechanisms implemented in the proposed model are the following:
Vessel co-option: this process includes the invasion of host tissue and pre-existing microvessels, allowing the cancer cells to reach the surface of blood vessels [17].
Intussusceptive microvascular growth: refers to the inser- tion of connective tissue pillars into the lumen of already existing capillaries, resulting in the partitioning of the vessel. This type of vascularization is much faster than sprouting angiogenesis and does not primarily depend on endothelial proliferation [17].
Glomeruloid angiogenesis: a relatively high number of closely associated microvessels form glomeruloid bodies that can be related to with aggressive tumor behavior and a reduced rate of survival [17].
Fig. 6. Schematic representation of the initial vasculature (left) and the generated tumor-vasculature (right)
F. Nutrient Diffusion
Even though in real life the diffusion of different nutrients is a continuous time-dependent process, in the model it is only a function of the distance from the nearest blood vessel.
This representation can sufficiently describe the dependence of tumor growth on the distance from the nearest nutrient supply, thus there is no need to integrate a continuous process.
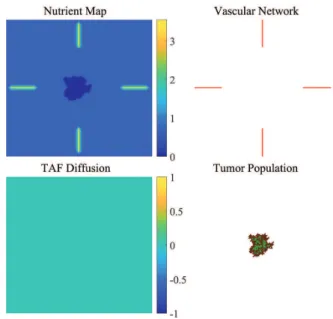
In this approach, the amount of available nutrients at a given location on the 2-dimensional grid is calculated using a9×9 kernel.
Fig. 7. Nutrition map of a tumor cell population and basic branching capillaries.
Applying this kernel to the matrix containing the vascular network, we can generate a nutrition map where the amount of nutrients in a given position is calculated based on its neighborhood. To simulate the nutrient consumption of the tumor cells, a similarly constructed 5×5 kernel is used in the model with negative values. This way the presence of a tumor cell will decrease the amount of available nutrients in its environment.
As Fig. 7 shows, the amount of available nutrients decreases as the distance from the nearest vessel is increasing. Both proliferation and necrosis of tumor cells depend on the amount of available nutrients at the given location, therefore the state transitions of grid cells containing the tumor population are determined using the nutrition matrix.
G. Time and Size Scales
Choosing the right time and size scales is essential for accurate simulation results. In order to achieve this, we need to investigate all cell- and tissue-level behaviors that are described in the model. Since the average capillary diameter is around 5−10µm and one grid cell represents an area of tissue, which can contain tumor cells and capillaries at the same time, the size of the grid cells was chosen as 20 µm by 20 µm. A number of studies investigated the diffusion of oxygen in different tissues. Results show that if intercapillary distances exceed100−140µm, the supply of oxygen reaches the minimal level resulting in hypoxia [13]. In the proposed model we assume that the maximum distance from a capillary, where nutrients can be found, is 5 grid cells (100µm).
In order to precisely determine the time scales of different mechanisms, a series of high resolution in vivo images fol- lowing the time-evolution of the tumor mass and the capillary network is needed.
III. RESULTS
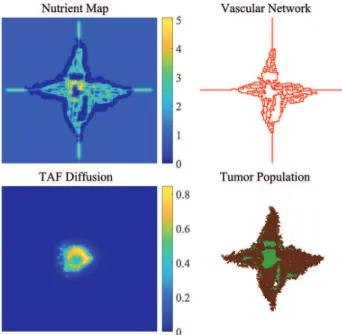
Simulations were run for 400 generations on a sqaure grid of 150 ×150 cells. In each simulation, a predefined vasculature was present in the environment of the tumor and a small amount of nutrient was provided in each grid location, simulating the limited source for diffusion uptake (Fig. 8).
Fig. 8. Growing avascular tumor mass with necrotic regions (generation: 95)
Fig. 9. The vascular tumor releases TAF and induces angiogenesis (genera- tion: 125)
As Fig. 9 shows, when the tumor reaches the limitations set by nutrient diffusion and the ellipsoidal configuration, a necrotic core is formed. This induces the release of TAF by the living hypoxic tumor cells. Proangiogenic factors force the predefined vasculature to grow new branches and develop an irregular capillary network. A relatively high number of new
Fig. 10. As the newly developed capillary network reaches the living tumor cells (generation: 210), the phenomenon of vessel co-option can be observed.
sprouts, bifurcations, self loops, anastomoses and glomeruloid bodies can be observed (Fig. 10), thanks to the over-balancing of growth factors. These network structures are produced by the vascularization mechanisms implemented in the model (i.e., sprouting, intussusception and glomeruloid growth).
These characteristic features often make tumor-vasculature redundant, meaning that a given area of the tissue is supplied by several capillaries at the same time. This redundancy can be considered as an important parameter of the tumor vasculature.
Notwithstanding that there is a sufficient nutrient supply, due to the rapid growth in the number of tumor cells, new necrotic areas are emerging, leading to the resumption of TAF production and vasculature development (Fig. 11). This dynamic equilibrium is characteristic to the vascular stage of tumor progression.
IV. CONCLUSION
In order to develop effective targeted therapies, we have to consider the type of vascularization mechanisms, the molecu- lar background and the stage of the disease.
Despite the simplicity of the model, results show that it is able to reproduce tumor-specific network features (Fig.
5) and provide a detailed description of the spatio-temporal distribution of tumor cells and blood vessels by incorporating alternative vascularization mechanisms.
After the validation of the CA model, which in the first step means a qualitative comparison with in vivoobservations, the simulations of cell-level interactions can be used to estimate specific parameters of the tumor-vasculature for later use in a previously built, concentrated parameter model of tumor growth [19]. In addition to this, the model also provides opportunities for simple extensions such as antiangiogenic drug administration and 3-dimensional simulations.
0 100 200 300 400
Generations 0
2000 4000 6000
Number of cells
Cell populations Living Tumor
Necrotized Capillary
Fig. 11. Number of living and necrotized tumor cells and capillaries.
REFERENCES
[1] B. Stewart, C. P. Wildet al., “World cancer report 2014,” 2014.
[2] D. E. Gerber, “Targeted therapies: a new generation of cancer treat- ments.”American family physician, vol. 77, no. 3, 2008.
[3] E. Frei and J. F. Holland,Cancer medicine 6. BC Decker, 2003.
[4] P. Carmeliet, “Angiogenesis in life, disease and medicine,”Nature, vol.
438, no. 7070, pp. 932–936, 2005.
[5] J. Folkman, “Tumor angiogenesis: therapeutic implications,”New eng- land journal of medicine, vol. 285, no. 21, pp. 1182–1186, 1971.
[6] J. S´api, L. Kov´acs, D. A. Drexler, P. Kocsis, D. Gaj´ari, and Z. S´api,
“Tumor volume estimation and quasi-continuous administration for most effective bevacizumab therapy,”PloS One, vol. 10, no. 11, p. e0142190, 2015.
[7] J. Moreira and A. Deutsch, “Cellular automaton models of tumor development: a critical review,”Advances in Complex Systems, vol. 5, no. 02n03, pp. 247–267, 2002.
[8] P. M. Altrock, L. L. Liu, and F. Michor, “The mathematics of cancer:
integrating quantitative models,”Nature Reviews Cancer, vol. 15, no. 12, pp. 730–745, 2015.
[9] M. Welter and H. Rieger, “Computer simulations of the tumor vascu- lature: Applications to interstitial fluid flow, drug delivery, and oxygen supply,” in Systems Biology of Tumor Microenvironment. Springer, 2016, pp. 31–72.
[10] H. Enderling and M. AJ Chaplain, “Mathematical modeling of tumor growth and treatment,”Current pharmaceutical design, vol. 20, no. 30, pp. 4934–4940, 2014.
[11] D. Chen, Y. Jiao, and S. Torquato, “A cellular automaton model for tumor dormancy: emergence of a proliferative switch,”PloS One, vol. 9, no. 10, p. e109934, 2014.
[12] Z. Wang, J. D. Butner, R. Kerketta, V. Cristini, and T. S. Deisboeck,
“Simulating cancer growth with multiscale agent-based modeling,” in Seminars in cancer biology, vol. 30. Elsevier, 2015, pp. 70–78.
[13] K. Groebe and P. Vaupel, “Evaluation of oxygen diffusion distances in human breast cancer xenografts using tumor-specific in vivo data: role of various mechanisms in the development of tumor hypoxia,”International Journal of Radiation Oncology* Biology* Physics, vol. 15, no. 3, pp.
691–697, 1988.
[14] P. Macklin, S. McDougall, A. R. Anderson, M. A. Chaplain, V. Cristini, and J. Lowengrub, “Multiscale modelling and nonlinear simulation of vascular tumour growth,” Journal of mathematical biology, vol. 58, no. 4, pp. 765–798, 2009.
[15] J. Crank,The mathematics of diffusion. Oxford university press, 1979.
[16] J. Folkman and D. Hanahan, “Switch to the angiogenic phenotype during tumorigenesis.” inPrincess Takamatsu Symposia, vol. 22, 1991, pp. 339–
347.
[17] B. D¨ome, M. J. Hendrix, S. Paku, J. T´ov´ari, and J. Timar, “Alternative vascularization mechanisms in cancer: Pathology and therapeutic impli- cations,”The American journal of pathology, vol. 170, no. 1, pp. 1–15, 2007.
[18] J. W. Baish, T. Stylianopoulos, R. M. Lanning, W. S. Kamoun, D. Fuku- mura, L. L. Munn, and R. K. Jain, “Scaling rules for diffusive drug delivery in tumor and normal tissues,” Proceedings of the National Academy of Sciences, vol. 108, no. 5, pp. 1799–1803, 2011.
[19] D. Csercsik, J. S´api, T. G¨onczy, and L. Kov´acs, “Bi-compartmental mod- elling of tumor and supporting vasculature growth dynamics for cancer treatment optimization purpose,” in 56th IEEE Annual Conference on Decision and Control (CDC 2017), Melbourne, Australia. IEEE, 2017, pp. 4698–4702.