Article
Lévy Analysis of HBT Correlation Functions in
√ s N N = 62 GeV and 39 GeV Au + Au Collisions at PHENIX †
Dániel Kincses for the PHENIX Collaboration ID
Faculty of Atomic Physics, Eötvös Loránd University Pázmány P. s. 1/A, H-1117 Budapest, Hungary;
kincses@ttk.elte.hu; Tel.: +36-1-372-2500 (ext. 6037)
† This paper is an extended version of our paper published in 10th Bolyai-Gauss-Lobachevsky Conference on Non-Euclidean Geometry and its Applications.
Received: 17 November 2017; Accepted: 19 December 2017; Published: 4 January 2018
Abstract:The phase diagram of strongly interacting matter can be explored by analyzing data of heavy-ion collisions at different center of mass collision energies. For investigating the space-time structure of the hadron emission source, Bose-Einstein or HBT correlation measurements are among the best tools. In this paper we present the latest results from the PHENIX experiment of the Relativistic Heavy Ion Collider (RHIC) on such measurements in √
sNN =39 GeV and 62 GeV Au + Au collisions.
Keywords:RHIC; PHENIX; femtoscopy; HBT; Bose-Einstein correlations; distribution; anomalous diffusion; phase diagram; critical point
1. Introduction
Experimental data from heavy-ion collisions [1] are in agreement with the theoretical prediction [2]
that the quark-hadron transition is cross-over at high energies (near zero baryochemical potential).
At lower energies the transition is expected to be a first-order phase transition. This indicates that there could be a critical endpoint in between, where second-order phase transition takes place.
Finding and characterizing this critical point is one of the most important current problems in heavy-ion physics. To study the phase diagram of strongly interacting matter, we have to perform measurements at different collision energies so that we can gain information about different regions on the phase diagram. In the past years the PHENIX experiment at the Relativistic Heavy Ion Collider of the Brookhaven National Laboratory collected a vast amount of data at various collision energies.
The gold-gold beam energy scan spans from 7.7 GeV up to 200 GeV in√
sNN. In terms of baryochemical potential the range reaches out to approximately 400 MeV, while in freeze-out temperature this range is between 170 MeV and 140 MeV [3]. An illustration of the phase-diagram can be seen on Figure1, while the recently extracted chemical freezeout parameters are shown on Figure2.
There is a very practical tool to gain information about the particle-emitting source, namely the measurement of Bose-Einstein or HBT correlations (named after R. Hanbury Brown and R. Q. Twiss) of identical bosons [4,5]. In previous years, Gaussian-type sources were usually utilized to describe the correlation functions, but the latest results from the PHENIX experiment showed that we can and have to go beyond the Gaussian approximation [6,7]. In an expanding medium, on the basis of the generalized central limit theorem and the anomalous diffusion we can expect the appearance of Lévy-type sources [8,9]. The symmetric Lévy distribution is the generalization of the Gaussian distribution and it is defined by the following expression:
L(α,R,r) = 1 (2π)3
Z
d3qeiqre−12|qR|α. (1)
Universe2018,4, 11; doi:10.3390/universe4010011 www.mdpi.com/journal/universe
TheRparameter is called the Lévy scale parameter, and theαparameter is the index of stability or Lévy exponent. In case ofα = 2 we get back the Gaussian distribution, while the α = 1 case results in the Cauchy distribution. In case of α < 2 the Lévy distribution exhibits a power-law behavior. Neglecting the final-state interactions and assuming that the source is a spherically symmetric three-dimensional Lévy distribution, furthermore using the framework of the core-halo model, the two-particle correlation function takes the following simple form (Qis a one-dimensional relative momentum variable, see details in [9] and in Section2):
C
2( Q ) = 1 + λ · e
−(QR)α. (2)
Theλparameter in Equation (2) is called the strength of the correlation function. According to the core-halo model [10], this parameter is in connection with the core-halo ratio.
λ= (NC/(NC+NH))2, (3) whereNCdenotes the number of pions created from the freeze-out of the quark-gluon plasma (or from the decay of very short lived resonances), andNHis the number of pions created in the decays of long-lived resonances.
The Lévy-type source is also useful in the search for the critical point, as one of its parameters, the index of stabilityαis related to one of the critical exponents,η. In case of a second order phase transition theηexponent describes the power-law behavior of the spatial correlations at the critical point with an exponent of−(d−2+η)wheredis the dimension [11]. In case of the three-dimensional Lévy distribution the power-law tail of the spatial correlations is described with an exponent of−1−α.
From comparing these exponents we can easily see that the Lévy exponent is identical toηat the critical point [12]. The second-order QCD phase-transition is expected to be in the same universality class as the 3D Ising model [13,14], and in that case theηexponent has a definite value of 0.03631(3) at the critical point [15]. Some argue [16] that QCD more likely falls in the universality class of the random field 3D Ising model, where the value ofηis 0.5±0.05 [11]. If one extracts the value of the Lévy exponentαat different center-of-mass collision energies, the data may yield information on the nature of the quark-hadron phase transition, particularly it may shed light on the location of the critical endpoint (CEP) on the phase-diagram.
T emperature
Baryochemical potential Hadronic matter
Quark-gluon plasma
normal nuclear matter 𝑠𝑁𝑁= 200 GeV-7.7 GeV RHIC Beam Energy Scan
Figure 1.The phase diagram of strongly interacting matter.
Figure 2.Extracted chemical freezeout parameters from Reference [3].
2. Results
In our analysis we used√
sNN = 62 GeV and√
sNN = 39 GeV Au + Au data recorded by PHENIX during the 2010 running period. We measured two-particle HBT correlation functions for π+π+andπ−π−pairs. For the experimental construction of the correlation functions we used the usual event mixing method as described in Section III.B. in Reference [7]. It is well known that the in the longitudinal co-moving system (LCMS) the Bertsch-Pratt radii (Rout,Rside,Rlong) are of similar magnitude in√
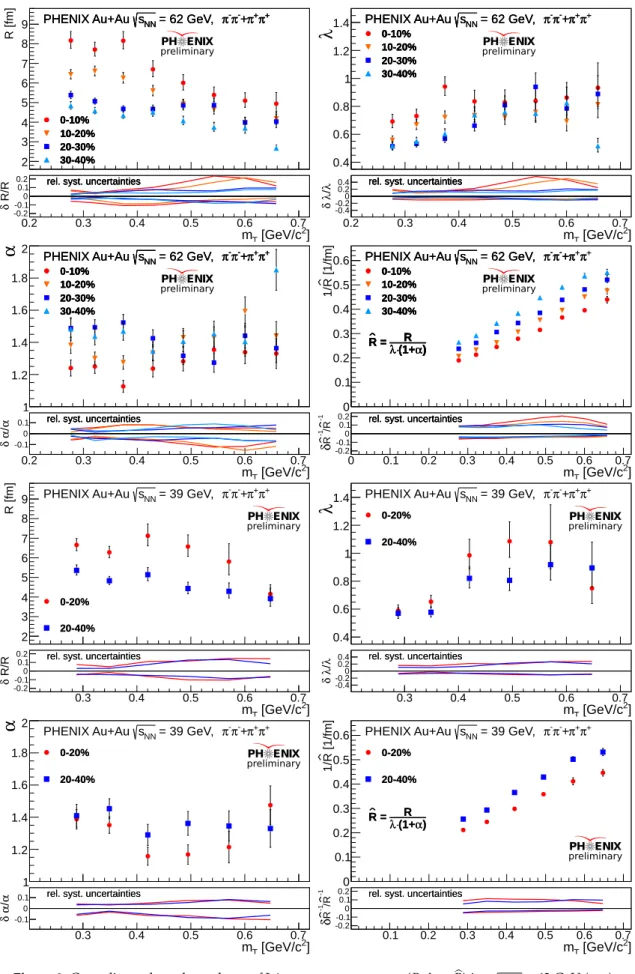
sNN=200 GeV Au + Au collisions at RHIC [17]. This means that the Bose-Einstein correlation functions are approximately spherically symmetric in the LCMS frame. This was one of the reasons why we used the absolute value of the three-momentum difference in the LCMS frame for our one-dimensional relative momentum variable. In case of the 62 GeV dataset we used 8 average transverse mass (mT) bins and 4 centrality ranges, while in case of the 39 GeV dataset we used 6mT bins and 2 centrality ranges. We checked that the correlation functions ofπ+π+ andπ−π−pairs are consistent, so we combined the data. The aforementioned formula for the correlation function (Equation (2)) does not take into account the final-state Coulomb interaction. In our fits we incorporated that effect and also introduced a linear background. In allmTbins the fits described the measured correlation functions in a statistically acceptable manner.
In Figure3we present the resulting fit parameters (R,λ,α) versus pairmT, as well as an empirically found scaling parameterRb=R/(λ·(1+α)). We observe that most features of the 200 GeV results [18]
are resembled by these low energy data. Just like in the 200 GeV case, we can observe a decrease in λvalues at smallmTat both 62 and 39 GeV which may point to the increase of the halo fraction in that region. In case of a partial chiralUA(1)restoration, the in-medium mass of theη0meson could be modified [19] which then could lead to an increase in its yield. This effect would result in an increased number of halo pions in the small-mT region, and hence it could provide one explanation for our observation [20]. Of course there could be other effects [4] that would result in similar behavior ofλso a precise measurement is important.
R [fm]
2 3 4 5 6 7 8 9
0-10%
10-20%
20-30%
30-40%
π+
π+ -+ π π-
= 62 GeV, sNN
PHENIX Au+Au
0-10%
10-20%
20-30%
30-40%
π+
π+ -+ π π-
= 62 GeV, sNN
PHENIX Au+Au
0-10%
10-20%
20-30%
30-40%
π+
π+ -+ π π-
= 62 GeV, sNN
PHENIX Au+Au
0-10%
10-20%
20-30%
30-40%
2] [GeV/c mT
0.2 0.3 0.4 0.5 0.6 0.7
R/Rδ-0.2-0.10
0.1
0.2 rel. syst. uncertaintiesrel. syst. uncertaintiesrel. syst. uncertaintiesrel. syst. uncertainties
PH ENIX preliminary
λ
0.4 0.6 0.8 1 1.2 1.4
0-10%
10-20%
20-30%
30-40%
π+
π+ -+ π π-
= 62 GeV, sNN
PHENIX Au+Au 0-10%
10-20%
20-30%
30-40%
π+
π+ -+ π π-
= 62 GeV, sNN
PHENIX Au+Au 0-10%
10-20%
20-30%
30-40%
π+
π+ -+ π π-
= 62 GeV, sNN
PHENIX Au+Au 0-10%
10-20%
20-30%
30-40%
2] [GeV/c mT
0.2 0.3 0.4 0.5 0.6 0.7
λ/λδ-0.4-0.20
0.20.4 rel. syst. uncertaintiesrel. syst. uncertaintiesrel. syst. uncertaintiesrel. syst. uncertainties
PH ENIX preliminary
α
1 1.2 1.4 1.6 1.8 2
0-10%
10-20%
20-30%
30-40%
π+
π+ -+ π π-
= 62 GeV, sNN
PHENIX Au+Au 0-10%
10-20%
20-30%
30-40%
π+
π+ -+ π π-
= 62 GeV, sNN
PHENIX Au+Au 0-10%
10-20%
20-30%
30-40%
π+
π+ -+ π π-
= 62 GeV, sNN
PHENIX Au+Au 0-10%
10-20%
20-30%
30-40%
2] [GeV/c mT
0.2 0.3 0.4 0.5 0.6 0.7
α/αδ -0.1
0
0.1 rel. syst. uncertaintiesrel. syst. uncertaintiesrel. syst. uncertaintiesrel. syst. uncertainties
PH ENIX preliminary
[1/fm]R1/
0 0.1 0.2 0.3 0.4 0.5 0.6
α)
⋅(1+
λ R = R
0-10%
10-20%
20-30%
30-40%
π+
π+ -+ π π-
= 62 GeV, sNN
PHENIX Au+Au
α)
⋅(1+
λ R = R
0-10%
10-20%
20-30%
30-40%
π+
π+ -+ π π-
= 62 GeV, sNN
PHENIX Au+Au
α)
⋅(1+
λ R = R
0-10%
10-20%
20-30%
30-40%
π+
π+ -+ π π-
= 62 GeV, sNN
PHENIX Au+Au
α)
⋅(1+
λ R = R
0-10%
10-20%
20-30%
30-40%
2] [GeV/c mT
0 0.1 0.2 0.3 0.4 0.5 0.6 0.7
-1 R/-1 Rδ-0.2-0.1 0 0.1
0.2 rel. syst. uncertaintiesrel. syst. uncertaintiesrel. syst. uncertaintiesrel. syst. uncertainties
PH ENIX preliminary
R [fm]
2 3 4 5 6 7 8 9
0-20%
20-40%
π+
π+ -+ π π-
= 39 GeV, sNN
PHENIX Au+Au
0-20%
20-40%
2] [GeV/c mT
0.3 0.4 0.5 0.6 0.7
R/Rδ
-0.2 -0.10 0.1
0.2 rel. syst. uncertaintiesrel. syst. uncertainties
PH ENIX preliminary
λ
0.4 0.6 0.8 1 1.2 1.4
0-20%
20-40%
π+
π+ -+ π π-
= 39 GeV, sNN
PHENIX Au+Au
0-20%
20-40%
2] [GeV/c mT
0.3 0.4 0.5 0.6 0.7
λ/λδ-0.4-0.20
0.2
0.4 rel. syst. uncertaintiesrel. syst. uncertainties
PH ENIX preliminary
α
1 1.2 1.4 1.6 1.8 2
0-20%
20-40%
π+
π+ -+ π π-
= 39 GeV, sNN
PHENIX Au+Au
0-20%
20-40%
2] [GeV/c mT
0.3 0.4 0.5 0.6 0.7
α/αδ -0.1
0
0.1 rel. syst. uncertaintiesrel. syst. uncertainties
PH ENIX preliminary
[1/fm]R1/
0 0.1 0.2 0.3 0.4 0.5 0.6
α)
⋅(1+
λ R = R
0-20%
20-40%
π+
π+ -+ π π-
= 39 GeV, sNN
PHENIX Au+Au
α)
⋅(1+
λ R = R
0-20%
20-40%
2] [GeV/c mT
0.1 0.2 0.3 0.4 0.5 0.6 0.7
-1 R/-1 Rδ-0.2-0.1 0 0.1
0.2 rel. syst. uncertaintiesrel. syst. uncertainties
PH ENIX preliminary
Figure 3.Centrality andmTdependence of Lévy source parameters (R,λ,α,R) inb √
sNN= 62 GeV (top) and√
sNN= 39 GeV (bottom) Au + Au collisions. The different colors and marker styles are denoting the different centrality ranges. The auxiliary figures at the bottom show the relative systematic uncertainties.
Moving on to the Lévy scale parameter we can see a decreasing behavior, and we can clearly observe a geometrical centrality dependence. In more central collisions, theRparameter (which is related to the physical size of the system) takes larger values. In case of the Lévy exponentαwe can see that for all centrality andmTranges the values are between 1 and 2 for both 39 and 62 GeV.
The measured values are far from the Gaussianα=2 case and also far from the conjecturedα≤0.5 at the critical point. Although we have not seen an indication for critical behavior in neither the 62 GeV nor the 39 GeV measurements, we can not exclude these ranges from the critical point search because finite-size and finite-time effects can modify the picture immensely as discussed in Reference [21].
We also show an empirically found scaling parameter,R. We observed that the Levy parametersb (α, R, λ) are strongly correlated and we tried to search for less correlated combinations of these parameters. We indeed found such a parameter,R. If this parameter is used as a fit parameter insteadb ofR, the correlation coefficients for (R,b λ) and (R,b α) are reduced substantially. Due to the reduction of the correlation the uncertainty ofRbis also significantly reduced compared to that ofR. What is even more interesting is the linear scaling of 1/RbwithmT. The possible physical interpretation of this remarkable affine linear dependence of 1/RbonmTis still unknown at the time of writing this paper.
In the near future we would like to explore further the energy and centrality dependence in
√sNN=27 GeV, 19 GeV and 15 GeV Au + Au collisions. We will also conduct a three-dimensional analysis to investigate the shape of the particle-emitting source in more detail.
Acknowledgments: This research was supported by the funding agencies listed in Reference [7]. In addition, D.K. was supported by the ÚNKP-17-3 New National Excellence program of the Hungarian Ministry of Human Capacities as well as the NKFIH grant FK-123842.
Conflicts of Interest:The authors declare no conflict of interest.
References
1. Csanád, M.; Csörg˝o, T.; Lörstad, B.; Ster, A. Indication of quark deconfinement and evidence for a Hubble flow in 130-GeV and 200-GeV Au + Au collisions. J. Phys. G2004,30, S1079–S1082.
2. Aoki, Y.; Endr˝odi, G.; Fodor, Z.; Katz, S.D.; Szabó, K.K. The order of the quantum chromodynamics transition predicted by the standard model of particle physics.Nature2006,443, 675–678.
3. Adamczyk, L.; Adkins, J.K.; Agakishiev, G.; Aggarwal, M.M.; Ahammed, Z.; Ajitanand, N.; Alekseev, I.;
Anderson, D.M.; Aoyama, R.; Aparin, A.; et al. Bulk Properties of the Medium Produced in Relativistic Heavy-Ion Collisions from the Beam Energy Scan Program.Phys. Rev. C2017,96, 044904.
4. Csörg˝o, T. Particle interferometry from 40-MeV to 40-TeV.Heavy Ion Phys.2002,15, 1–80.
5. Lisa, M.A.; Pratt, S.; Soltz, R.; Wiedemann, U. Femtoscopy in relativistic heavy ion collisions.Ann. Rev. Nucl.
Part. Sci.2005,55, 357–402.
6. Csanad, M. Measurement and analysis of two- and three-particle correlations. Nucl. Phys. A2006,774, 611–614.
7. Adare, A.; Aidala, C.; Ajitanand, N.N.; Akiba, Y.; Akimoto, R.; Alexander, J.; Alfred, M.; Al-Ta’ani, H.;
Angerami, A.; Aoki, K.; et al. Lévy-stable two-pion Bose-Einstein correlations in√
sNN =200 GeV Au+Au collisions.arXiv2017,arXiv:nucl-ex/1709.05649.
8. Csanád, M.; Csörg˝o, T.; Nagy, M. Anomalous diffusion of pions at RHIC.Braz. J. Phys.2007,37, 1002–1013.
9. Csörg˝o, T.; Hegyi, S.; Zajc, W.A. Bose-Einstein correlations for Levy stable source distributions. Eur. Phys.
J. C2004,36, 67–78.
10. Bolz, J.; Ornik, U.; Plumer, M.; Schlei, B.R.; Weiner, R.M. Resonance decays and partial coherence in Bose-Einstein correlations. Phys. Rev. D1993,47, 3860–3870.
11. Rieger, H. Critical behavior of the three-dimensional random-field Ising model: Two-exponent scaling and discontinuous transition. Phys. Rev. B1995,52, 6659–6667.
12. Csörg˝o, T. Correlation Probes of a QCD Critical Point. In Proceedings of the PoS (HIGH-PTLHC 08), Tokaj, Hungary, 16–19 March 2008.
13. Halasz, A.M.; Jackson, A.D.; Shrock, R.E.; Stephanov, M.A.; Verbaarschot, J.J.M. On the phase diagram of QCD.Phys. Rev. D1998,58, 096007.
14. Stephanov, M.A.; Rajagopal, K.; Shuryak, E.V. Signatures of the tricritical point in QCD.Phys. Rev. Lett.1998, 81, 4816–4819.
15. El-Showk, S.; Paulos, M.F.; Poland, D.; Rychkov, S.; Simmons-Duffin, D.; Vichi, A. Solving the 3d Ising Model with the Conformal Bootstrap II. c-Minimization and Precise Critical Exponents. J. Stat. Phys.2014, 157, 869–914.
16. Csörg˝o, T.; Hegyi, S.; Novák, T.; Zajc, W.A. Bose-Einstein or HBT correlation signature of a second order QCD phase transition.AIP Conf. Proc.2006,828, 525–532.
17. Adler, S.S.; Afanasiev, S.; Aidala, C.; Ajitanand, N.N. Bose-Einstein correlations of charged pion pairs in Au + Au collisions at s(NN)**(1/2) = 200-GeV.Phys. Rev. Lett.2004,93, 152302.
18. Csanad, M. Lévy femtoscopy with PHENIX at RHIC.arXiv2017,arXiv:nucl-ex/1711.05575.
19. Kapusta, J.I.; Kharzeev, D.; McLerran, L.D. The Return of the prodigal Goldstone boson. Phys. Rev. D1996, 53, 5028–5033.
20. Vance, S.E.; Csörg˝o, T.; Kharzeev, D. Partial U(A)(1) restoration from Bose-Einstein correlations.Phys. Rev. Lett.
1998,81, 2205–2208.
21. Lacey, R.A. Indications for a critical point in the phase diagram for hot and dense nuclear matter.
Nucl. Phys. A2016,956, 348–351. c
2018 by the author. Licensee MDPI, Basel, Switzerland. This article is an open access article distributed under the terms and conditions of the Creative Commons Attribution (CC BY) license (http://creativecommons.org/licenses/by/4.0/).

![Figure 2. Extracted chemical freezeout parameters from Reference [3].](https://thumb-eu.123doks.com/thumbv2/9dokorg/1402492.117651/3.892.255.631.126.460/figure-extracted-chemical-freezeout-parameters-reference.webp)