Plasmonics
Comparative study of plasmonic properties of cysteine functionalized gold and silver nanoparticle aggregates
--Manuscript Draft--
Manuscript Number:
Full Title: Comparative study of plasmonic properties of cysteine functionalized gold and silver nanoparticle aggregates
Article Type: EMRS Conference Paper
Keywords: nanoparticle aggregates; LSPR spectra; coupled plasmonic resonances; array effect
Corresponding Author: Aniko Szalai
University of Szeged Szeged, HUNGARY Corresponding Author Secondary
Information:
Corresponding Author's Institution: University of Szeged Corresponding Author's Secondary
Institution:
First Author: Aniko Szalai
First Author Secondary Information:
Order of Authors: Aniko Szalai
Áron Sipos Edit Csapó, Dr.
László Tóth Maria Csete, Dr.
Imre Dékány, Prof. Dr.
Order of Authors Secondary Information:
Abstract: The absorptance spectra of gold and silver nanoparticles (NP) aqueous dispersions were measured by UV-visible spectroscopy, and computed numerically by finite element method. Both NPs were functionalized by L-cysteine amino-acid (Cys) in order to develop LSPR bio-sensors. Experimental spectral study on series of dispersions has shown strongly pH dependent degree of aggregation. Absorptance spectra measured at analogous ~4.9 pH value were compared, where Au-Cys conjugates have split spectra with two commensurate maxima, while Ag-Cys conjugates exhibit the most pronounced secondary peak according to the highest degree of aggregation. The purpose of our theoretical study was to determine most simple linear chain-like and wavy aggregate geometries, which result in maxima matching the measured peaks.
The aggregates were characterized by N number and d diameter of NPs, g gap between the NPs, and t thickness of L-cysteine covering. By tuning the angle of light incidence and E-field oscillation direction with respect to the aggregates, the contribution of longitudinal and transversal modes was varied. The comparison of measurements and computations revealed that spectra measured on bioconjugate dispersions include effects of numerous aggregates with various geometries, illuminated from different directions and are influenced by inter-aggregate coupling.
Inspecting the normalized E-field distribution surrounding the aggregates it was shown that fundamentally different multipolar modes can be identified at primary and
secondary absorptance maxima, due to coupled plasmonic resonances on NPs.
University of Szeged
Department of Optics and Quantum Electronics
www.u-szeged.hu/optics/indexh.html
Dr. Mária Csete
H-6720 Szeged, Dóm tér 9.
6701 Szeged, Pf. 406 Phone.: (36-62) 544-528 Fax.: (36-62) 544-658
E-mail: mcsete@physx.u-szeged.hu
15 May 2012
Prof. Chris D. Geddes Institute of Fluorescence,
University of Maryland Biotechnology Institute 2555 US Highway 130, Suite 1
Baltimore, Maryland 08512 Tel: 609-495-2551
Fax: 609-395-9113
Dear Professor Geddes,
Enclosed please find our paper entitled “Comparative study of plasmonic properties of cysteine functionalized gold and silver nanoparticle aggregates” for special issue of Plasmonics devoted to O symposium of EMRS conference.
Yours sincerely:
Dr. Mária Csete
Cover Letter
Comparative study of plasmonic properties of cysteine functionalized gold and silver
nanoparticle aggregates
Anikó Szalaia, Áron Siposa Edit Csapób, László Tóthc, Mária Csetea and Imre Dékányb,c
aDepartment of Optics and Quantum Electronics, University of Szeged, 6720 Szeged, Dóm tér. 9., Hungary
bSupramolecular and Nanostructured Materials Research Group of the Hungarian Academy of Sciences, University of Szeged, 6720 Szeged, Aradi vértanuk tere 1., Hungary
dDepartment of Medical Chemistry, Faculty of Medicine, University of Szeged, 6720 Szeged, Aradi vértanuk tere 1., Hungary
mcsete@physx.u-szeged.hu
Abstract
The absorptance spectra of gold and silver nanoparticles (NPs) aqueous dispersions were measured by UV-visible spectroscopy, and computed numerically by finite element method. Both NPs were functionalized by L-cysteine amino-acid (Cys) in order to develop LSPR bio-sensors. Absorptance spectra measured at analogous ~4.9 pH value were compared, where Au-Cys conjugates have split spectra with two commensurate maxima, while Ag-Cys conjugates exhibit the most pronounced secondary peak according to the highest degree of aggregation. The purpose of our theoretical study was to determine most simple linear chain-like and wavy aggregate geometries, which result in maxima matching the measured peaks. The aggregates were characterized by N number and d diameter of NPs, g gap between the NPs, and t thickness of L-cysteine covering. By tuning the angle of light incidence and E-field oscillation direction with respect to the aggregates, the contribution of longitudinal and transversal modes was varied. The comparison of measurements and computations revealed that spectra measured on bioconjugate dispersions include effects of numerous aggregates with various geometries, illuminated from different directions and are influenced by inter-aggregate coupling. Inspecting the normalized E-field distribution surrounding the aggregates it was shown that fundamentally different multipolar modes can be identified at primary and secondary absorptance maxima, due to coupled plasmonic resonances on NPs.
Keywords: nanoparticle aggregates, LSPR spectra, coupled plasmonic resonances, array effect
Manuscript
Click here to download Manuscript: Aggregates_mcsete.doc Click here to view linked References
Introduction
Introduction
The localized surface plasmon resonance (LSPR) phenomenon on metal nanoparticles (NP) illuminated by polarized light with proper wavelength is capable of realizing EM-field concentration, which makes NPs promising candidates for many applicatios. The understanding, how the LSPR results in characteristic spectra influenced by the shape, size and dielectric constant of individual metal NPs and by the optical properties of the surrounding dielectric medium, enables to design NPs-based systems with desired spectral properties [1-
3].
The high intensity localized plasmon field accompanying LSPR phenomenon makes possible to reach high sensitivity in bio- and photo-detection. There are tremendous efforts in recent nanoscience and nanoplasmonics to develop nanosensors, which are based on the sensitivity plasmon resonance phenomena to the dielectric environment of plasmonic nanostructures [4]. In nanoparticle-based LSPR sensors various surface treatment methods were developed to ensure good capability of specific detection [5].
Gold and silver particles are the most common noble metal NPs applied in sensing. The advantage of gold is the appearance of plasmon resonance in the visible region, and the high chemical stability [6]. Although the plasmon resonance of silver NPs is at the boundary of UV-Vis spectral regions, due to narrower resonance peaks higher detection sensitivity is achievable via silver based plasmonic biosensors. Several examples prove in the literature that clusters of silver NPs result in secondary peaks red-shifted to the visible region [1, 7]. The coupled plasmon resonance oscillations on clusters of metal NPs govern the entire absorption spectrum, which exhibits various peaks depending on both the dielectric and geometrical parameters [8]. Detailed spectral studies indicated that the splitting on spectra correlates with the ensembles size, while the height of the absorption peaks is proportional with the aggregates quantity [9].
Previous works in the literature indicated that the E-field oscillation direction has significant effect on the characteristic spectral properties of extended ensembles.
The simplest elongated aggregate geometries, e.g. dimers and linear chains of spherical particles were studied in details mainly for two specific cases of E-field oscillation direction corresponding to the symmetry axes of the ensembles. It was concluded that a primary peak appears on the spectrum due to transversal modes excited by light with E-field oscillation perpendicular to the aggregate’s long axis, while the longitudinal modes excited by light with E-field oscillation parallel to long axes result in red-shifted maximum [10].
These representative examples prove that the tuning of aggregate’s spectra is possible by tailoring their geometry, and suggest further tuning possibilities via proper illumination directions, but these possibilities have not been investigated in details previously. In addition to the possibility of spectral engineering, further considerable advantage in application of aggregates-based LSPR is that the coupling between nanoparticles results in strongly enhanced near-field, which makes possible sensing with considerably higher sensitivity, than on stand-alone particles. However the E-field distribution on extended aggregates with different shape and its dependence on illumination directions have not been studied systematically previously.
Based on previous literature, bio-functionalization of NPs by L-cysteine results in cluster formation. In presence of L-cysteine, noble metal colloid spheres collect a monomolecular covering and assemble to aggregates through hydrogen bonds formed between amino acids located on neighboring silver sphere surfaces [11, 12]. Our previous experimental studies have shown that the stability of Ag NP- Cys bioconjugates and the resulted degree of aggregation is strongly depended on the pH as well as on biomolecule concentration, as a result of pH dependent reactivity of the amino groups [13].
Even though the already discovered properties make aggregates as sensing elements promising, caused by the complexity of their spectral response, application of aggregate-based LSPR sensors requires uncovering of the relationship between the LSPR spectra and the aggregate’s geometry, as well as the illumination conditions. This demand motivated our present work, as our purpose was to determine the simplest aggregate geometries that may account for the observed spectra and to analyze the effect of their orientation and interaction on absorptance peaks and on near-field distribution.
Methods and materials
Preparation and experimental spectral study of silver and gold nanoparticle dispersions
Materials
Gold(III) cloride trihydrate (99.9%, Aldrich), silver nitrate (99.9%, Molar), sodium citrate dihydrate (99%, Aldrich) and sodium borohydride (99%, Fluka) were used without further purification for synthesis of spherical gold and silver nanoparticles-containing aqueous dispersions. In all cases the dispersions were prepared in Milli-Q ultrapure water.
Preparation of pure Au and Ag nanoparticles
For synthesis of pure spherical, citrate-reduced gold nanoparticles the well-known Turkevich method was applied, the steps of the synthesis was published previously [14]: The silver colloids were prepared according to the preparation procedure in Ref [13]. Namely, the Ag+-ions were reduced with sodium borohydride using sodium citrate stabilizing agent as well.
Experimental studies
The prepared gold and silver nanoparticles were functionalized by L-cysteine by adding aqueous solution of the applied amino acid to the appropriate amount of nanoparticles-containing dispersions. In all cases the monomolecular coverage of both Au and Ag NPs with L-cysteine was formed. Before spectral characterization of the biofunctionalized NPs the samples were stirring for 2-3 hours at room temperature. In our previously published works we confirmed that the stability of the prepared amino-acid-functionalized nanoparticle dispersions is strongly pH depended [15]. In this work presented here, the pH of the samples was adjusted to pH ~ 4.9 by using 0.1 M HNO3, HCl and NaOH aqueous solutions. At this pH the aggregation of both Au and Ag nanoparticles is occurred.
Methods
The average particle size and size distribution of the synthesized nanoparticles were determined by TEM and DLS methods. TEM images were recorded on a Philips CM-10 instrument at 100 kV accelerating voltage. The size distribution of the particles was calculated by using UTHSCSA Image Tool 2.00 software.
In case of Dynamic Light Scattering (DLS) measurements a Zetasizer Nano ZS ZEN 4003 apparatus (Malvern Ins., UK) was used. The effect of pH on stability of biofunctionalized nanoparticles was studied by UV-Vis spectroscopy as well.
Ocean Optics USB2000 (Ocean Optics Ins., USA) diode array spectrophotometer was applied. The spectra were recorded in the λ = 300-850 nm range using 1 cm quartz cuvette.
Computation of absorptance spectra by finite element method
Absorptance spectra of bio-functionalized gold and silver NP aggregates with different geometries were computed by Finite Element Method (FEM) applying the RF module of Comsol Multiphysics software package (COMSOL AB). The purpose of this comparative study was to determine most simple aggregate geometries that may account for fundamentally different absorptance spectra observed on Au-Cys and Ag-Cys bioconjugate dispersions at analogous pH ~ 4.9.
According to different degrees of aggregation observed via TEM measurements, absorptance spectra of linear Au-Cys bioconjugate chains were determined, while absorptance of linear and wavy aggregates made of Ag-Cys bioconjugates was also computed (Fig. 1 and 2). The inspected aggregates are characterized by geometrical parameters: N number of NPs, d diameter of Au and Ag colloid spheres, t thickness of the surrounding Cys-shell, and g inter-particle gap (Fig. 1).
In wavelength dependent FEM computations tabulated data sets of Au and Ag dielectric parameters from the literature were interpolated with a spline-fit [16].
The wavelength dependent refractive indices of L-cysteine and water were taken into account with Cauchy-formulas based on references [17, 18]. The absorptance spectra of Au-Cys in λ =400 - 800 nm and Ag-Cys dispersions in λ =300 - 800 nm intervals were computed with 10 nm resolution, then 1 nm resolution was applied around the maxima.
First the spectra of single noble metal particles were computed, taking dAu=13.61.17 nm and dAg=8.251.25 nm mean values of single Au and Ag NPs diameters into account according to TEM measurements (Fig. 2 insets). Then the effect of covering by monomolecular Cys–shell with t = 0.45 nm thickness was determined [13]. These two geometrical parameters were not varied during FEM computations performed to determine aggregates spectra, while the g inter- particle gap was swept between g=0.6 nm, corresponding to overlapping shells, and g=0.875 nm, modeling the more probable non-intersecting case. The computed absorptance curves of aggregates with different geometrical size- parameters were normalized to each other to ensure the same apparent
concentration, then the measured curve was normalized to that computed absorptance peak which resulted in the best fit for secondary maxima (Fig. 2).
The modification of the gap has strong impact on the strength of inter-particle coupling inside aggregates, and also on the interaction between aggregates.
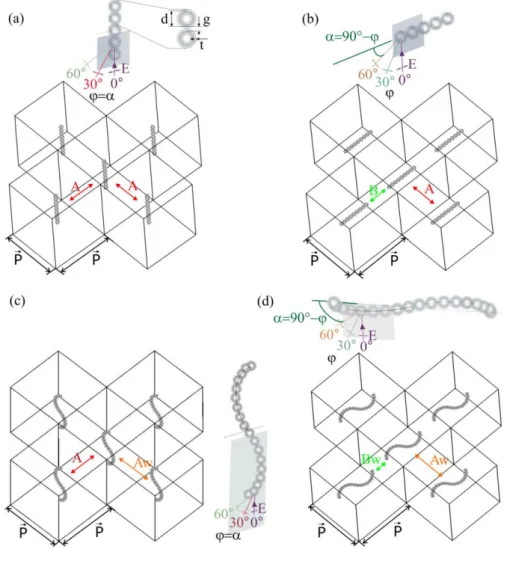
Namely, aggregates with lengths commensurate with the applied P unit cell size have potential to interact. In order to inspect different types of near- and far-field interactions we applied periodic boundary conditions at the vertical sides of unit cells consisting of vertically (Fig. 1a, c) or horizontally (Fig. 1b, d) aligned aggregates.
Figure 1. (a, b) Schematic drawing of the investigated periodic aggregate-arrays consisting of (a, c) vertically and (b, d) horizontally aligned (a, b) linear and (c, d) wavy aggregates inside unit cells with P size parameter. The drawing indicates A- and B- type couplings in horizontal-arrays, and only A- type coupling in vertical arrays. The Aw and Bw nominations refer to involvement of NP interactions located at different distances in neighboring wavy aggregates. The insets indicate the parameters used to characterize the linear and wavy aggregates and the method of polar angle tuning.
The contribution of grating coupling phenomena on periodically arrayed aggregates was analyzed based on comparison of spectra originating from vertical and horizontal arrays (Fig. 3-5). The light incidence angle onto the array plane was varied by changing the polar angle in order to ensure analogous illumination direction with respect to the NP ensembles in vertical and horizontal arrays, while the E-field oscillation direction was always in the plane of incidence. The illumination direction is defined as the angle between the k light wave vector and the long axes of the aggregate, i.e. = 90°- for horizontally, while = for vertically aligned aggregates. Both E-field and k light wave vector projections are varied with respect to the long axes of the aggregates, when
angle of incidence is tuned (Fig. 1 insets).
Result and discussion
Comparison of measured and computed spectra on Au-Cys and Ag- Cys aggregates at analogous pH ~ 4.9
In experimental spectral study single absorptance peak was registered on dispersions of bare Au NPs at 521 nm, while on Ag NPs single absorption maximum appeared at 391 nm (Fig. 2a, b, blue curves). Based on FEM computations the absorption maximum is expected in close proximity of measured spectral peaks, namely at 523 nm on bare d=13.6 nm Au NPs, and at 398 nm on d=8.25 nm diameter Ag NPs in aqueous environment. Both peaks are in accordance with the Fröhlich-condition, as the Ag/Au,real/H2O 2 relationship is validated (Fig. 2a, b dark cyan curves) [2].
FEM computation revealed that covering by L-cysteine monolayer results in slightly forward shifted peaks at 525 nm on Au-Cys and at 402 nm on Ag-Cys core-shell NPs, indicating that silver NPs spectra are more sensitive to the modification in their dielectric environment (Fig. 2a, b cyan curves). Both of bare and L-cysteine covered NPs spectra are in spectral intervals of primary peaks measured on bioconjugates dispersions revealing to stand-alone particles contribution. However the narrow peaks of stand-alone NPs cannot account for absorption observed in wide regions on Au-Cys and Ag-Cys aggregates (Fig. 2a, b wine curves).
Based on TEM investigations, L-cysteine covering of noble metal NPs results in different types of aggregate formation, namely small and simple Au-Cys bioconjugate ensembles are observable in comparison to large and more complex Ag-Cys aggregates at analogous ~4.9 pH (Fig. 2a, b insets).
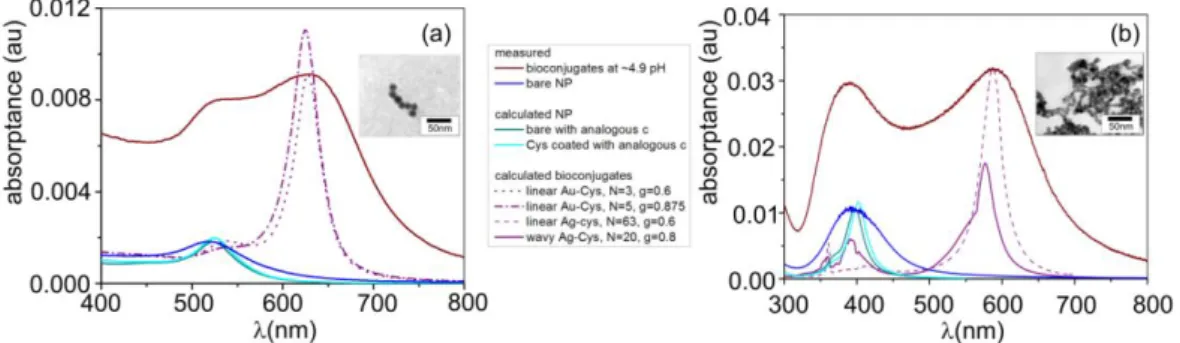
Figure 2. The absorptance spectra of (a) gold and (b) silver nanoparticle dispersions. The
measured (wine) curves are registered at 4.95 pH value in Au-Cys and at 4.92 pH value in Ag-Cys dispersions. Absorptance curves measured on single NPs (blue) and computed by FEM for bare (dark cyan) and for cysteine-coated (cyan) single NPs with analogous concentration indicate peaks in the interval of primary maxima. Absorptance spectra of two linear (dot and dashed dot purple) and one linear (dashed purple) and one wavy (solid purple) aggregate exhibit absorptance maxima matching both the primary and secondary measured peaks. The insets indicate TEM pictures about the aggregates.
In Fig. 2 the measured spectra are compared to spectra computed by applying horizontal aggregate arrays. The absorptance curve measured on Au-Cys bioconjugates indicates primary and secondary maxima corresponding to ~96 nm split. The DSL measurements revealed to small average Au-Cys bioconjugate size of ~47 nm. Based on FEM computations, linear Au-Cys aggregates with similar length are capable of resulting in absorptance peaks in the interval of measured primary and secondary absorptance maxima (Table 1). When overlapping shells are considered, aggregates consisting of 3 particles have maxima at 540 nm and 628 nm (Fig. 2a, dot purple curve). The more realistic non- intersecting shells result in good matching between the computed 625 nm and measured 631 nm secondary maxima (Fig. 2a, dashed dot purple curve). Although the entire length of 5 NPs linear chain is larger than the average diameter measured by DLS, this Au-Cys aggregate geometry was selected to study the array- and illumination direction effects, as intersection of covering biomolecule shells is less probable.
The absorptance curve on Ag-Cys bioconjugates indicates separated primary and secondary maxima corresponding to ~197 nm split, which is approximately two times larger than the split observable on Au-Cys conjugates (Fig. 2b, Table 1). The higher sensitivity of the spectra to aggregation indicates that Ag-Cys
bioconjugates ensure higher sensitivity in aggregate-based sensors. The DLS measurements indicated Ag-Cys aggregate average diameters one order magnitude larger than in case of Au-Cys aggregates. FEM computations revealed that very long linear and medium length wavy ensembles exhibit maxima at analogous spectral positions and with commensurate split, as the measured peaks.
In case of overlapping shells 63 Ag NPs result in maxima at 414 nm and 587 nm ensuring almost perfect match between the measured and computed secondary peaks (Fig. 2b, dashed purple curve). Wavy aggregates with non-intersecting shells result in maxima at 398 nm and 577 nm, i.e. providing good matching between the measured and computed primary peaks (Fig. 2b, solid purple curve).
The computed split better approximates the measured value in case of wavy Ag-Cys chain, and the absorption spectrum of the wavy Ag-Cys aggregate has larger FWHM similarly to the measured wide peaks. Both long linear and wavy aggregates were investigated to inspect the array- and illumination direction related effects.
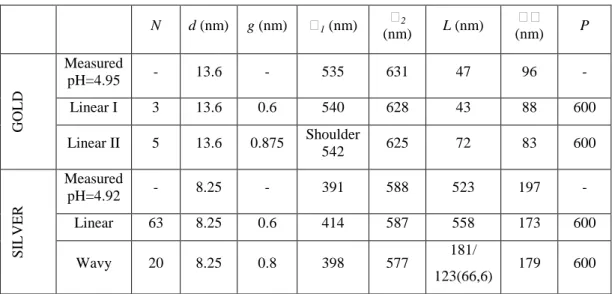
N d (nm) g (nm) 1 (nm) 2
(nm) L (nm)
(nm) P
GOLD
Measured
pH=4.95 - 13.6 - 535 631 47 96 -
Linear I 3 13.6 0.6 540 628 43 88 600
Linear II 5 13.6 0.875 Shoulder
542 625 72 83 600
SILVER
Measured
pH=4.92 - 8.25 - 391 588 523 197 -
Linear 63 8.25 0.6 414 587 558 173 600
Wavy 20 8.25 0.8 398 577 181/
123(66,6) 179 600
Table 1: Parameters (N, d, g) of each investigated aggregate geometry and (1 and 2) positions of primary and secondary maxima on the measured/computed spectra, the corresponding split, L average aggregate diameter determined by DSL/ theoretical aggregate length, and P unit cell size in FEM computations.
Comparison of spectra originating from vertical and horizontal aggregate arrays
In case of vertically aligned aggregates only A-type coupling is possible originating from interaction of linear or wavy aggregates aligning parallel to each other at P distance, which equals with the length of the unit cell. This coupling is
characteristic for aggregate arrays with P periodicity, and involves all interactions between particles in neighboring parallel aggregates (Fig. 1a, c). Significant difference between the two investigated aggregate geometries is that in linear chains the shortest distance between interacting particles in neighboring aggregates is the P periodicity in vertical-arrays, while in wavy aggregates also A- type coupling involves interaction of particles at distances smaller and larger than the P periodicity. The Aw coupling results in broadened spectral response according to the wider interval of distances of interacting particles.
The horizontal arrangement of the aggregates makes possible that more types of coupling phenomena are involved in collective plasmonic resonances. The B-type coupling is also at play, which involves all interactions between particles in neighboring aggregates at distances in interval of [P-L, P+L] in horizontal arrays of aggregates with L length in cubical unit cells with P side. The strength of interaction is governed by the shortest distance between in-line aggregates, which equals with the p-L distance between the ends of the NP ensembles. Closely packed in-line ensembles have potential to enhance this B-type coupling due to near-field interaction (Fig. 1b, d).
The array effect may result in appearance of additional peaks, when the adding of the light wave vector and the grating wave vector results in plasmon mode with wavelength commensurate with the length of the aggregate. The grating coupled plasmon wavelength can be calculated as:
P n k
kplasmon photon * . (1)
Resonant excitation occurs iwith nodes/antinodes at both ensemble terminations, when the length of the aggregate is multiple of the half-plasmon wavelength:
2
plasmon
m
L
, (2)
while resonant oscillations with node-antinode pairs at terminations occurs, when the length of the chain is multiple of quarter plasmon wavelength:
4 ) ' 1 ' 2
( m plasmon
L
(3).
Based on analogy between NP ensembles and elongated antenna-like nano- objects, the phase pick-up upon reflection depending on the composition of the
aggregate determines, whether antinodes or nodes appear at the termination of the chain, i.e. whether the half- or quarter-wavelength of the resonant modes is commensurate with the chain [19].
Important difference between vertical and horizontal arrays is that in horizontal arrays the kphoton,II projection of the k light wave vector along the NP ensemble is parallel to the P array wave vector along B-type coupling direction, while the k and P wave vectors are perpendicular to each other for all grating wave vectors vertical arrays. As a result, the contribution of far-field coupling to resonant excitation of coupled plasmonic modes along NP arrays is predicted for horizontal arrays. The parallelism of kphoton,II photon wave vector projection to P grating vector along B-type coupling makes possible to excite modes, which are unattainable in vertical arrays, i.e. more and larger absorptance peaks are expectable in horizontal arrays.
Effect of Au-Cys aggregates’ orientation
In case of perpendicular incidence (=0°) onto horizontal array of of N=5 Au-Cys bioconjugate ensembles a large absorptance peak is observable at 625 nm, while only a shoulder appears in the spectral interval of the primary measured peak, corresponding to ~7 ratio of absorptances (Fig. 2a, dashed dot purple line and Fig.
3, purple spectrum). By increasing the angle of incidence to =30°, the red-shifted peak decreases, the shoulder becomes more pronounced, and appears at slightly smaller wavelength (Fig. 3, blue curve). At =60° incidence angle a separated primary peak appears at ~520 nm, proving that small linear Au-Cys chains are capable of contributing to the absorptance in this spectral interval, when they are illuminated under large polar angles. The secondary peak further decreases by increasing the angle of incidence (Fig. 3, orange curve).
Interestingly, the spectra of vertical arrays differ from the spectra of horizontal arrays under analogous illumination directions (Fig. 3, green-to-blue and red-to- orange curves). On the spectra of horizontal arrays both primary and secondary extrema are noticeably forward shifted, and the red-shifted peaks are slightly smaller compared to the secondary maxima on spectra of vertical arrays.
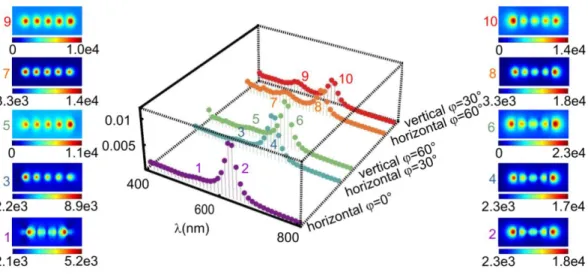
Figure 3. Transformation of the split spectra of linear chain-like gold aggregates consisting of N = 5 Au NPs arrayed at 0.8 nm gap, when the angle of incidence is 0° (purple), 30° (blue), 60°
(orange) in horizontal array, and 60° (green) and 30° (red) in vertical array. The pictures indicate the normalized E-field at the primary (odd numbers) and secondary (even numbers) peaks on the spectra.
Although there is a slight difference between the primary and secondary absorptance peaks on spectra of horizontal and vertical arrays, this small difference indicates that there is no symmetry breaking in the near-field of the tiny aggregates caused by their nearest neighbors. The very small 72 nm length of the investigated Ay-Cys linear chain does not promote near-field interaction in horizontal arrays, i.e. the observed differences may originate from different types of far-field couplings in horizontal and vertical arrays. Namely, the forward shift occurs, when the kphoton,II projection of the photon wave vector onto the chains and the P grating wave vector are parallel to each other.
The near-field pictures indicate similar odd modes corresponding to m=1 at all secondary maxima, with E-field anti-nodes at the ends of the linear chains (Fig. 3, pictures indicated by even numbers). The intensity distribution is symmetrical in case of perpendicular incidence, when the p-polarized light excites purely longitudinal modes (Fig. 3, 2 picture. The nodes are forward shifted along the propagation direction with increasing angle of incidence, when the transversal modes are gradually enhanced. Interestingly the nodes are more pronounced in horizontal arrays under analogous illumination directions (Fig. 3, 4-to-6, 8-to- 10 pictures).
At the primary maxima the tilting results in significant change in the field distribution along the array (Fig. 3, pictures indicated by odd numbers). At perpendicular incidence even modes appear corresponding to m=2 in
contradiction with the literature predicting even modes only for oblique incidence or bent objects (Fig. 3, picture 1) [20]. The =60° illumination direction (=30°/60°) causes appearance of one single node close to the exit/entrance side of the small chains in horizontal/vertical arrays. This reveals to different phase jumps upon reflection in the spectral interval of the primary peak, which corresponds to chain length commensurate with /4 for the resonant modes (Fig.
3, picture 3/5) [19].. When the angle between the beam and the chain is smaller, i.e. at =30° (=30°/60° in vertical/horizontal arrays, transversal modes become dominant, and the intensity modulation along the chain is less pronounced (Fig. 3, picture 7/9). Even though n=3 order grating coupling is capable of resulting in plasmonic modes excitation with half-wavelengths commensurate with the chain length in all of investigated cases, odd modes corresponding to m’=1 are dominant at the primary peak at oblique incidence (Fig. 3, pictures indicated by odd numbers)
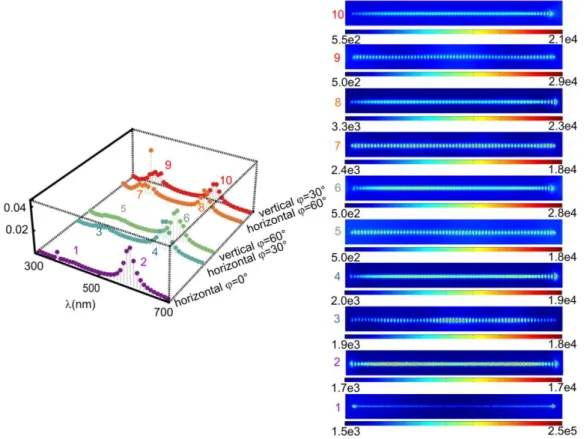
Effect of linear Ag-Cys aggregates’ orientation
In case of perpendicular incidence (=0°) onto horizontal array of linear chain- like aggregate of N=63 Ag-Cys bioconjugates, the ratio of the absorptances at the primary (414 nm) and secondary (587 nm) maxima is ~16 (Fig. 4, purple spectrum). When the light is incident under =30° onto horizontal Ag-Cys array, the red-shifted peak decreases, while the UV peak increases, and appears at smaller 400 nm wavelength (Fig. 4, blue curve). Further enhanced UV maximum appears at =60° incidence angle at the same spectral position. This observation proves that long linear chains significantly contribute to the absorptance in this spectral interval, when they are illuminated under large polar angles. The secondary peak is further decreased, and is smaller than the primary peak at
=60° angle of incidence (Fig. 4, orange curve).
The spectra computed on long linear Ag-Cys chains more significantly depend on, whether the elongated Ag-Cys aggregates are arrayed vertically or horizontally in the unit cells, than in case of tiny Au-Cys ensembles (Fig. 4, green-to-blue and red-to-orange curves). Smaller primary peak appears in the vertical array illuminated under =60° in comparison to the maximum observed, when the horizontally arrayed ensembles are illuminated under analogous =60° direction.
The secondary peak is more pronounced in vertical Ag-Cys array similarly to the observation on Au-Cys bioconjugates (Fig. 4, green-to-blue curves). In case of
=30° angle of incidence onto vertical array of Ag-Cys chains a split primary peak appears, with local maxima at smaller wavelengths, and a global maximum coincident with the primary maximum observed under analogous =30°
illumination direction with respect to the horizontal chains. Interestingly, the absorptance is larger in vertical array at wavelengths before the global maxima, but larger maximal absorptance is observable in horizontal arrays. The red-shifted peak is considerably smaller in vertical arrays than under analogous =30°
illumination direction of horizontal Ag-Cys chains (Fig. 4, red-to-orange).
Figure 4. Transformation of the split spectra of a linear silver aggregate consisting of N = 63 Ag NPs arrayed at 0.6 nm gap, when the angle of incidence is 0° (purple), 30° (blue), 60° (orange) in horizontal array, and 60° (green) and 30° (red) in vertical array. The pictures indicate the
normalized E-field at the primary (odd numbers) and secondary (even numbers) peaks on the spectra.
The 558 nm length of the investigated Ag-Cys linear chain makes possible near- field interaction in horizontal arrays, as the 21 nm distance between the linear ensembles is commensurate with the decay length of the plasmon field at Ag- water bounding media. At the secondary maximum the P=600 nm periodic grating may result in coupling into modes corresponding to m=3 close to the investigated
=30° angle of incidence, while efficient coupling might be realized under =60°
angle of incidence to modes corresponding to m=4. The higher secondary peaks observed at =60° incidence angles originate from more efficient grating coupling.
The decreased primary peak in case of vertical arrays in comparison to the primary peak on horizontal array illuminated under analogous =60° reveals to that the primary absorption peaks involve complex coupling effects. Larger primary peak is expected in vertical arrays due to the commensurability of the chain length with half-wavelength of modes corresponding to m=5 excitable via grating coupling in case of =60° angle of incidence. This observed tiny difference between the primary peaks on spectra of aggregates in horizontal and vertical arrays may originate partially from symmetry breaking in the near-field of the neighboring extended aggregates, and might be related to the parallelism of the horizontal chain with the grating wave vector.
The grating coupling results in excitation of modes corresponding to m=4 at ~360 nm wavelength under =30° angle of incidence, while coupling to resonant modes corresponding to m=5 occurs around 400 nm under =60° angle of incidence.
This incidence angle dependent coupling efficiency explain the wavelength dependent ratio between the primary peaks originating from vertical/horizontal arrays under analogous =30° (=30°/60°) illumination directions.
The near-field images about the E-field distribution at the secondary peak indicate interference of different co-existent modes on the long linear chain. The intensity distribution reveals to collective resonance oscillation corresponding to m=1 and m=2 in case of perpendicular incidence, even though odd dipolar oscillation is expected based on excitation of longitudinal modes by p-polarized light (Fig. 4, picture 2). Under =30°/60° incidence angles resonant modes predicted by grating coupling theory corresponding to m=3/4 are not observable on the aggregates in neither of horizontal and vertical arrays (Fig. 5, 4/8 and 10/6 pictures). The intensity modulation correlates with the strength of coupling, i.e. higher intensity is observable under =60° angles of incidence.
Similar complex collective oscillations are observable at the primary maxima (Fig. 5, images indicated by odd numbers). In horizontal array the even/odd
modes are dominant under =30°/60° incidence angles in agreement with the grating coupling theory predicting coupling to modes corresponding to m=4/5 at the primary peaks (Fig. 5, picture 3, 7). In vertical arrays effect of analogous grating coupling is less noticeable on the intensity distribution (Fig. 5, picture 5, 9). This proves that the parallelism of the long axes of the aggregates promotes efficient mode excitation via grating coupling in horizontal arrays. To inspect the contribution of different array effects that may be at play in vertical and horizontal arrays, different aggregate geometry was investigated too.
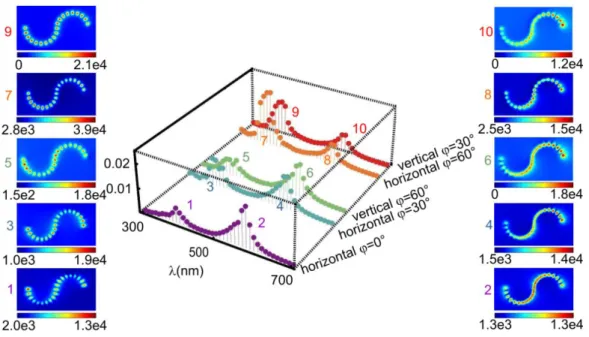
Effect of wavy silver nanoparticle aggregate’s orientation
The ratio of the primary (398 nm) and secondary (577 nm) maxima is ~3, when N=20 wavy Ag-Cys bioconjugates are illuminated by perpendicularly incident light, i.e. the primary peak is the most pronounced in this geometry (Fig. 2b, solid and Fig. 4, purple spectrum). Illumination of horizontal array consisting of wavy Ag-Cys ensembles under =30° causes decreased red-shifted peak, and split UV peak (Fig. 4, blue curve). Further enhanced UV maximum appears under =60°
incidence angle at the same spectral position without split. The secondary peak is smaller than the primary peak at =60° angle of incidence, i.e. the ratio of the absorptance values at the maxima is reversed under large polar angles (Fig. 4, orange curve).
The spectra modify in different manner, when wavy Ag-Cys aggregates are illuminated in vertical instead of horizontal arrays, in comparison to the long linear Ag-Cys aggregates (Fig. 5, green-to-blue and red-to-orange curves). The primary peak in the vertical array illuminated under =60° exhibits a similar split and is slightly smaller then the maximum on horizontal array under analogous
=60° illumination direction (Fig. 4 green to blue curves). A single primary peak appears under =30° angle of incidence on the vertical array, but the absorptance is smaller in comparison to the horizontal array, where the NP ensembles are illuminated under =30° (Fig. 4 orange to red curves). The secondary red-shifted peaks are coincident in vertical and horizontal arrays of wavy Ag-Cys bioconjugates under analogous illumination directions.
Figure 5. Transformation of the split spectra of a wavy silver aggregate consisting of N = 20 Ag NPs arrayed at 0.8 nm gap, when the angle of incidence is 0° (purple), 30° (blue), 60° (orange) in horizontal array, and 60° (green) and 30° (red) in vertical array. The pictures indicate the normalized E-field at the primary (odd numbers) and secondary (even numbers) peaks on the spectra.
The 181 nm length of the wavy Ag-Cys ensemble in 600 nm unit cells does not make possible near-field interaction in horizontal arrays caused by ten times larger distance between the wavy Ag-Cys ensembles in comparison to linear Ag-Cys aggregates. The same spectral position of the split on primary peaks observed in horizontal and vertical arrays under analogous =30°, as well as the strong polar angle dependence of maximal values reveal to different array effects. Namely, at
=30° incidence angle the n=2/1 order grating-coupling enables excitation of plasmon modes with wavelength, which is commensurate with the length of the wavy aggregate. When the light is incident under =60° angle onto the arrays, the n=3/1 order grating coupling is capable of exciting plasmons with wavelength commensurate with the long axes of the wavy chain. The excitable modes correspond to m=2 / m=1 cases at the primary/secondary peaks.
The near-field pictures taken at the secondary maxima indicate E-field nodes at least on of the wavy aggregates ends. The intensity distribution reveals to collective dipolar oscillation corresponding to m=1 in case of perpendicular incidence, even though p-polarized light excites longitudinal and transversal modes simultaneously in wavy ensembles (Fig. 5, picture 2). Under =30°/60°
incidence angles the entire wavy aggregate length seems to be commensurate with quarter wavelength of the resonant modes, rather than with half-wavelength (Fig.
5, 4/6 and 10/8 pictures). The expected decrease in wavelength, namely by increasing angle of incidence from 30° to 60°, the half-wavelength of modes should be commensurate with the long axes, instead of the chain length, is not noticeable (Fig. 5, 4,10-to-6,8 pictures). Interestingly, nodes are located at the entrance of the ensembles with respect to the propagation direction in both arrays under oblique incidence.
At the primary maxima antinodes are observable at both the entrance and exit of the wavy ensemble (Fig. 5, pictures indicated by odd numbers). At perpendicular incidence and under =60° illumination direction (=30°/60°) even modes appear corresponding to m=2 in agreement with the literature predicting even modes for bent objects (Fig. 5, picture 1, 3, 5) [20]. Interestingly, under =30°
illumination direction (=60°/30° in horizontal/vertical arrays), odd modes appear at the primary peak with antinodes at the wavy aggregates ends (Fig. 5, picture 7/9).
The commensurability of the wavy aggregate length with the wavelength of the dominant mode under =30° angle of incidence is in accordance with prediction of n=2 order grating-coupled mode (Fig. 5, picture 3). Similarly, the existence of mode with wavelength commensurate with the long axis is in accordance with n=3 order grating coupled mode (Fig. 5, picture 5). However, the intensity distribution in vertical arrays is more similar under analogous illumination direction of the chains, rather than in under analogous incidence angles onto the arrays. This observation proves that the relative orientation of the elongated NP ensembles with respect to the array plane plays a key role in determination of collective resonances.
Conclusion
The comparative study of Au-Cys and Ag-Cys bioconjugates absorption was performed. FEM computations proved that fundamentally different and illumination direction dependent collective plasmonic resonance oscillations appear at the primary and secondary peaks on spectra measured at same pH~4.92.
Short linear chains of Au-Cys bioconjugates have spectra less sensitive to the aggregates orientation and weakly effected by coupling on arrays with
investigated periodicity. Dipole-like collective oscillations appear along short Au- Cys chains at perpendicular incidence, which are transformed to transversal modes by increasing the incidence angle, more rapidly in horizontal arrays.
Grating coupled antenna-like modes development is observable at the secondary peak also for oblique incidence, while only for perpendicular incidence at the primary peak. The spectra of very long linear chains of Ag-Cys aggregates is more sensitive to the illumination direction, and exhibits both near- and far-field coupling related array effects. The collective resonance oscillations originating from interference of co-existent modes involve antenna-like modes originating from grating coupling on horizontal arrays of long linear chains. Wavy Ag-Cys aggregates exhibit the largest primary peak, which becomes rapidly dominant by increasing the illumination angle. Antenna-like even and odd modes appear at the primary and secondary maxima, and modes originating from grating coupling are identifiable at small incidence angles. Interestingly, the aggregates orientation determines the near-field distribution, namely same modes appear under analogous illumination directions with respect to the aggregates long axes, rather then under same angle of incidence onto the aggregate array.
The conclusion of present study is that both spectral properties and near-field distribution might be controlled by appropriately illuminated horizontal arrays of extended aggregates with proper geometry. These findings are helpful in aggregates-based biosensors development, and in design of nanoparticle waveguides for wavelength selective and directional signal transportation.
References
[1] Jensen T, Kelly L, Lazarides A, Schatz GC (1999) Electrodynamics of noble metal nanoparticles and nanoparticle clusters. Journal of Cluster Science 10:295-317
[2] Schuller A, Barnard ES, Cai W, Jun YC, White JS, Brongersma ML (2010) Plasmonics for extreme light concentration and manipulation. Nature Materials 9:193-204
[3] Liz-Marzán LM (2006) Tailoring surface plasmons through the morphology and assembly of metal nanoparticles. Langmuir 22:32-41
[4] Lal S, Link S, Halas NJ (2007) Nano-optics from sensing to waveguiding. Nature Photonics 1:641–648
[5] Anker JN, Hall WP, Lyandres O, Shah NC, Zhao J, Van Duyne RP (2008) Biosensing with plasmonic nanosensors. Nature Materials 7:442-453
[6] Daniel MC, Astruc D, Gold Nanoparticles: Assembly, Supramolecular Chemistry, Quantum-Size-Related Properties, and Applications toward Biology, Catalysis, and Nanotechnology (2004) Chemical Review 104:293-346
[7] McFarland AD, Van Duyne RP (2003) Single silver nanoparticles as real-time optical sensors with zeptomole sensitivity. Nano Letters 3:1057–1062
[8] Quinten M, Kreibig U (1993) Absorption and elastic scattering of light by particle aggregates. Applied Optics 32:6173-6182 (1993).
[9] Rosi NL, Mirkin CA (2005) Nanostructures in biodiagnostics. Chemical Reviews 105:1547-1562
[10] Sweatlock LA, Maier SA, Atwater HA, Penninkhof JJ, Polman A (2005) Highly confined electromagnetic fields in arrays of strongly coupled Ag nanoparticles. Physics Review B 71:235408
[11] Mandal S, Gole A, Lala N, Gonnade R, Ganvir V, Sastry M (2001) Studies on the Reversible Aggregation of Cysteine-Capped Colloidal Silver Particles Interconnected via Hydrogen Bonds. Langmuir 17:6262-6268
[12] Jing C, Fang Y (2007) Experimental (SERS) and theoretical (DFT) studies on the adsorption behaviors of l-cysteine on gold/silver nanoparticles. Chem. Phys. 332:27-32.
[13] Csapó E, Patakfalvi R, HornokV, Tóth L, Sipos Á, Szalai A, Csete M, Dékány I (2012) Plasmonic properties of biofunctionalized silver nanoparticles at different pH. Colloids and Surfaces B doi: 10.1016/j.colsurfb.2012.03.036
[14] Majzik A, Fülöp L, Csapó E, Bogár F, Martinek T, Penke B, Bíró G, Dékány I (2010) Functionalization of gold nanoparticles with amino acid, β-amyloid peptides and fragment Coll. Surf. B 81 (2010) 235-241.
[15] Szalai A; Sipos Á, Csapó E, Hornok V, Tóth L, Csete M, Dékány I (2011) Numerical investigation of the plasmonic properties of bare and cysteine-functionalized silver nanoparticles. Plasmonics: Metallic Nanostructures and Their Optical Properties IX, Edited by Mark I. Stockman, Proceedings of the SPIE, 8096:80963B
[16] Palik ED (1998) Handbook of Optical Constants of Solids. Academic Press, San Diego [17] Arwin H (1986) Optical properties of thin layers of bovine serum albumin, γ-globulin,
and hemoglobin. Applied Spectroscopy 40:313-318
[18] Daimon M, Masamura A (2007) Measurement of the refractive index of distilled water from the near-infrared region to the ultraviolet region. Applied Optics 46:3812-3820 [19] Barnard ES, White JS, Chandran A, Brongersma ML (2008) Spectral properties of
plasmonic resonator antennas Opt. Exp. 16:16529-16537
[20] Laurent G, Félidj N, Aubard J, Lévi G, Krenn JR, Hohenau A, Schider G, Leitner A, Aussenegg FR (2005) Evidence of multipolar excitations in surface enhanced Raman scattering. Phys. Rev. B 71:045430