Comparative Study of Plasmonic Properties of Cysteine-Functionalized Gold and Silver Nanoparticle Aggregates
Anikó Szalai&Áron Sipos&Edit Csapó&László Tóth&
Mária Csete&Imre Dékány
Received: 11 June 2012 / Accepted: 6 August 2012 / Published online: 23 August 2012
#Springer Science+Business Media, LLC 2012
Abstract The absorptance spectra of gold and silver nano- particle (NP) aqueous dispersions were measured by UV–
visible spectroscopy and computed numerically by finite element method. Both NPs were functionalized byL-cyste- ine amino acid (Cys) in order to develop aggregate-based localized surface plasmon resonance biosensors. Absorp- tance spectra measured at an analogous pH value of∼4.9 were compared, where Au-Cys conjugates have moderately split spectra with two commensurate maxima, while Ag-Cys conjugates exhibit the most pronounced secondary peak according to the highest degree of aggregation. The purpose of our theoretical study was to determine the simplest linear chain-like and wavy aggregate geometries, which result in maxima matching the measured peaks. The aggregates were characterized by Nnumber and d diameter of NPs, g gap between the NPs, andtthickness of theL-cysteine covering.
By tuning the angle of incidence and E-field oscillation direction in p-polarized light with respect to the aggregates, the contribution of longitudinal and transversal modes was
varied. The comparison of measurements and computations revealed that spectra measured on bioconjugate dispersions include effects of numerous aggregates with various geom- etries, illuminated from different directions and are influ- enced by inter-aggregate coupling. Inspecting the normalizedE-field distribution surrounding the aggregates, it was shown that fundamentally different multipolar modes can be identified at primary and secondary absorptance maxima, due to coupled plasmonic resonances on NPs.
Keywords Nanoparticle aggregates . LSPR spectra . Coupled plasmonic resonances . Array effect
Introduction
The localized surface plasmon resonance (LSPR) phenom- enon on metal nanoparticles (NPs) illuminated by polarized light with proper wavelength is capable of realizing EM- field concentration, which makes NPs promising candidates for many applications. The understanding of how LSPR results in characteristic spectra influenced by the shape, size, and dielectric constant of individual metal NPs and by the optical properties of the surrounding dielectric medium makes it possible to design NP-based systems with desired spectral properties [1–3].
The high-intensity localized plasmon field accompanying the LSPR phenomenon makes it possible to improve sensi- tivity in bio- and photodetection. There are tremendous efforts in recent nanoscience and nanoplasmonics to devel- op nanosensors, which are based on the sensitivity plasmon resonance phenomena to the dielectric environment of plas- monic nanostructures [4]. In nanoparticle-based LSPR sen- sors, various surface treatment methods were developed to ensure good capability to realize specific detection [5].
A. Szalai
:
Á. Sipos:
M. Csete (*)Department of Optics and Quantum Electronics, University of Szeged,
Dóm tér. 9.,
6720 Szeged, Hungary
e-mail: mcsete@physx.u-szeged.hu E. Csapó
:
I. DékánySupramolecular and Nanostructured Materials Research Group of the Hungarian Academy of Sciences, University of Szeged, Aradi vértanuk tere 1.,
6720 Szeged, Hungary L. Tóth
:
I. DékányDepartment of Medical Chemistry, Faculty of Medicine, University of Szeged,
Aradi vértanuk tere 1., 6720 Szeged, Hungary
DOI 10.1007/s11468-012-9420-y
Gold and silver particles are the most common noble metal NPs applied in sensing. The advantage of gold is the appearance of plasmon resonance in the visible region and the high chemical stability [6]. Although the plasmon reso- nance of silver NPs is at the boundary of UV–vis spectral regions, higher detection sensitivity is achievable via silver- based plasmonic biosensors due to narrower resonance peaks. Several examples prove in the literature that clusters of silver NPs result in secondary peaks red-shifted to the visible region [1,7]. The coupled plasmon resonance oscil- lations on clusters of metal NPs govern the entire absorption spectrum, which exhibits various peaks depending on both the dielectric and geometrical parameters [8]. Detailed spec- tral studies indicated that the splitting on spectra correlates with the ensembles' size, while the height of the absorption peaks is proportional to the aggregate quantity [9].
Previous works in the literature indicated that the E- field oscillation direction has a significant effect on the characteristic spectral properties of extended aggregates.
The simplest elongated aggregate geometries, e.g., dimers and linear chains of spherical particles, were studied in detail mainly for two specific cases of E-field oscillation direction parallel to symmetry axes of the ensembles. It was concluded that a primary peak appears on the spectrum due to transversal modes ex- cited by light with E-field oscillation perpendicular to the aggregates' long axis, while the longitudinal modes excited by light with E-field oscillation parallel to long axes result in red-shifted maximum [10].
These representative examples prove that the tuning of aggregates' spectra is possible by tailoring their geometry and suggest further tuning possibilities via proper illumina- tion directions, but these approaches have not been investi- gated in detail previously. In addition to the possibility of spectral engineering, further considerable advantage in the application of aggregate-based LSPR is that the coupling between nanoparticles results in strongly enhanced near field, which makes possible sensing with significantly higher sensitivity, than on stand-alone particles. However theE-field distribution on extended aggregates with differ- ent shape and its dependence on illumination directions have not been studied systematically previously.
Based on previous literature, biofunctionalization of NPs by L-cysteine results in cluster formation. In the pres- ence of L-cysteine, noble metal colloid spheres collect a monomolecular covering and assemble into aggregates through hydrogen bonds formed between amino acids located on neighboring silver sphere surfaces [11, 12].
Our previous experimental studies have shown that the stability of Ag-Cys bioconjugates and the resulted de- gree of aggregation is strongly dependent on the pH as well as on biomolecule concentration, as a result of the pH-dependent reactivity of the amino groups [13].
Even though the already discovered properties make aggregates as sensing elements promising, caused by the complexity of their spectral response, application of aggregate-based LSPR sensors requires uncovering of the relationship between the LSPR spectra and the aggregates' geometry, as well as the effect of illumination conditions.
This demand motivated our present work, as our purpose was to determine the simplest aggregate geometries that may account for the observed spectra and to analyze the effect of their orientation and interaction on absorptance peaks and on near-field distribution.
Methods and Materials
Preparation and Experimental Spectral Study of Silver and Gold Nanoparticle Dispersions
Materials
Gold(III) chloride trihydrate (99.9 %, Aldrich), silver nitrate (99.9 %, Molar), sodium citrate dihydrate (99 %, Aldrich), and sodium borohydride (99 %, Fluka) were used without further purification for synthesis of spherical gold and silver nanoparticle-containing aqueous dispersions. In all cases, the dispersions were prepared in Milli-Q ultrapure water.
Preparation of Bare Au and Ag Nanoparticles
For synthesis of bare spherical, citrate-reduced gold nano- particles, the well-known Turkevich method was applied;
the steps of the synthesis were published previously [14].
The silver colloids were prepared according to the prepara- tion procedure in [13]. Namely, the Ag+ions were reduced with sodium borohydride using sodium citrate stabilizing agent as well.
Biofunctionalization byL-Cysteine
The prepared gold and silver nanoparticles were functional- ized by L-cysteine by adding an aqueous solution of the applied amino acid to the appropriate amount of nanoparticle-containing dispersions. In all cases, the mono- molecular coverage of both Au and Ag NPs withL-cysteine was formed. Before spectral characterization of the biofunc- tionalized NPs, the samples were being stirred for 2–3 h at room temperature. In our previously published works, we confirmed that the stability of the prepared amino acid- functionalized nanoparticle dispersions is strongly pH de- pendent [15]. In the work presented here, the pH of the samples was adjusted to pH∼4.9 by using 0.1 M HNO3, HCl, and NaOH aqueous solutions. At this pH, the aggre- gation of both Au and Ag nanoparticles occurred.
Experimental Methods
The average particle size and size distribution of the syn- thesized nanoparticles were determined by TEM and dy- namic light scattering (DLS) methods. TEM images were recorded on a Philips CM-10 instrument at 100 kV acceler- ating voltage.
The size distribution of the particles was calculated by using UTHSCSA Image Tool 2.00 software. In the case of DLS measurements, a Zetasizer Nano ZS ZEN 4003 appa- ratus (Malvern Ins., UK) was used. The effect of pH on stability of biofunctionalized nanoparticles was studied by UV–vis spectroscopy as well. The spectra were recorded in theλ0300-800-nm range using a 1-cm quartz cuvette, by applying Ocean Optics USB2000 (Ocean Optics Ins., USA) diode array spectrophotometer.
Computation of Absorptance Spectra by Finite Element Method
Absorptance spectra of biofunctionalized gold and silver NP aggregates with different geometries were computed by the finite element method (FEM) applying the RF module of Comsol Multiphysics software package (COMSOL AB).
The purpose of this comparative study was to determine the simplest aggregate geometries that may account for different absorptance spectra observed on Au-Cys and Ag- Cys bioconjugate dispersions at analogous pH∼4.9.
According to different degrees of aggregation observed via TEM measurements, absorptance spectra of linear Au- Cys bioconjugate chains were determined, while absorp- tance of linear and wavy aggregates made of Ag-Cys bio- conjugates was also computed (Figs.1and2). The inspected aggregates are characterized by the following geometrical parameters: N number of NPs, d diameter of the colloid spheres, t thickness of the surrounding Cys shell, and g interparticle gap (Fig.1).
In wavelength-dependent FEM computations, tabulated data sets of Au and Ag dielectric parameters from the literature were interpolated with a spline fit [16]. The wavelength-dependent refractive indices of L-cysteine and water were taken into account with Cauchy formulas based on [17,18]. The absorptance spectra of Au-Cys dispersions inλ0400–800-nm and of Ag-Cys dispersions inλ0300–
800-nm intervals were computed with 10-nm resolution, then 1-nm resolution was applied around the maxima. First, the spectra of single noble metal particles were computed, taking dAu013.6±1.17 nm and dAg08.25±1.25 nm mean values of single Au and Ag NP diameters into account, according to TEM measurements (insets in Fig.2). Then, the effect of covering by monomolecular Cys shell witht0 0.45-nm thickness was determined [13]. These two geomet- rical parameters were not varied during FEM computations
performed to determine aggregate spectra, while theginter- particle gap was swept betweeng00.6 nm, corresponding to overlapping shells, and g00.875 nm, modeling the more probable nonintersecting case. The computed absorptance curves of aggregates with different geometrical-size param- eters were normalized to each other to ensure the same apparent concentration; then, the measured curve was nor- malized to the computed absorptance peak which resulted in the best fit for secondary maxima (Fig.2). The modification of the gap has a strong impact on the strength of interparticle coupling inside aggregates and also on the interaction be- tween aggregates. Namely, aggregates with lengths com- mensurate with the applied P unit cell size have potential to interact. In order to inspect different types of near- and far-field interactions, we applied periodic boundary condi- tions at the vertical sides of unit cells consisting of vertically (Fig.1a, c) or horizontally (Fig.1b, d) aligned aggregates.
The effect of grating–coupling phenomena on periodical- ly arrayed aggregates was analyzed based on comparison of spectra originating from vertical and horizontal arrays (Figs.3,4, and5). The light incidence angle onto the array plane was varied by changing theφpolar angle, in order to ensure analogous α illumination direction with respect to the NP ensembles in vertical and horizontal arrays, while the E-field oscillation direction was always in the plane of incidence of p-polarized light. Theαillumination direction is defined as the angle between thekphotonlight wave vector and the long axes of the aggregate, i.e., α090°−φ for horizontally aligned, while α0φ for vertically aligned aggregates. Both E-field and kphoton;IIlight wave vector projections are varied with respect to the long axes of the aggregates, when φangle of incidence is tuned (insets in Fig.1).
Result and Discussion
Comparison of Measured and Computed Spectra on Au-Cys and Ag-Cys Aggregates at an Analogous pH∼4.9
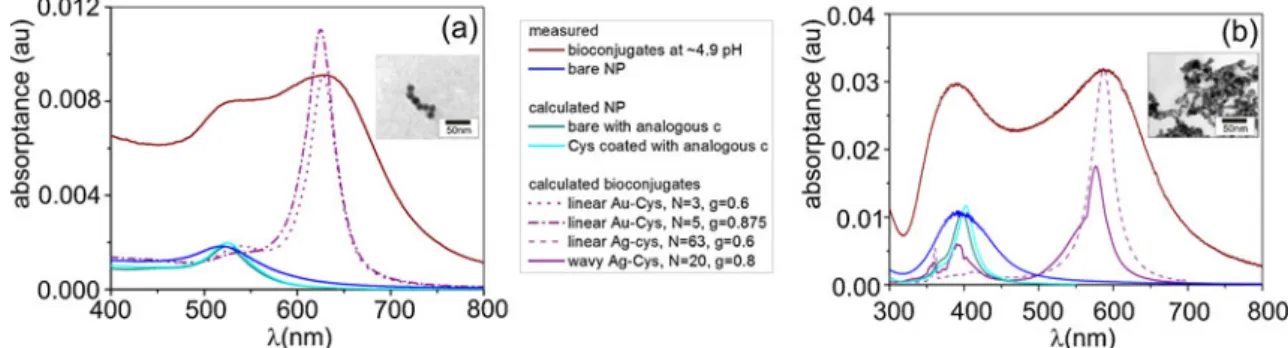
In experimental spectral study, a single absorptance peak was registered on dispersions of bare Au NPs at 521 nm, while on Ag NPs, the single absorption maximum appeared at 391 nm (blue curves in Fig.2a, b). Based on FEM computations, the absorption maximum is expected in close proximity of mea- sured spectral peaks, namely at 523 nm on bared013.6 nm Au NPs and at 398 nm ond08.25 nm diameter Ag NPs in aqueous environment. Both peaks are in accordance with the Fröhlich condition, as the"Ag=Au;real="H2O 2 relationship is validated (dark cyan curves in Fig.2a, b) [2].
FEM computation revealed that covering by theL-cyste- ine monolayer results in slightly forward-shifted peaks at 525 nm on Au-Cys and at 402 nm on Ag-Cys core shell
NPs, indicating that silver NPs spectra are more sensitive to the modification in their dielectric environment (cyan curves in Fig.2a, b). Spectra of both bare andL-cysteine-covered NPs are in spectral intervals of primary peaks measured on
bioconjugates' dispersions revealing stand-alone particle con- tribution. However, the narrow peaks of stand-alone NPs can- not account for absorption observed in wide spectral regions on Au-Cys and Ag-Cys aggregates (wine curves in Fig.2a, b).
Fig. 1 a,bSchematic drawing of the investigated periodic aggregate arrays consisting of a,cvertically andb,d horizontally aligneda,blinear andc,dwavy aggregates inside unit cells withPsize parameter.
The drawings indicate A- and B-type couplings in horizontal arrays and only A-type cou- pling in vertical arrays. The Aw and Bw nominations refer to involvement of NP interactions located at different distances in neighboring wavy aggregates.
Theinsetsindicate the parame- ters used to characterize the linear and wavy aggregates and the method ofφpolar angle tuning
Fig. 2 The absorptance spectra of differentagold andbsilver nano- particle dispersions. The measured (wine) curves are registered at 4.95 pH value in Au-Cys and at 4.92 pH value in Ag-Cys dispersions. Absorp- tance curves measured on single NPs (blue) and computed by FEM for bare (dark cyan) and for cysteine-coated (cyan) single NPs with
analogous concentration indicate peaks in the interval of primary maxi- ma. Absorptance spectra of (a) two linear (dot and dash-dot purple), and (b) one linear (dashed purple), and one wavy (solid purple) aggregate exhibit maxima matching both the primary and secondary measured peaks. Theinsetsindicate TEM pictures about the aggregates
Based on TEM investigations, theL-cysteine covering of noble metal NPs results in different types of aggregate formation, namely small and simple Au-Cys bioconjugate ensembles are observable in comparison to large and more complex Ag-Cys aggregates at an analogous pH of ∼4.9 (insets in Fig.2a, b).
In Fig.2, the measured spectra are compared to spectra computed by applying horizontal aggregate arrays. The absorptance curve measured on Au-Cys bioconjugates indi- cates primary and secondary maxima corresponding to Δλ∼96 nm split. The DSL measurements revealed a small average Au-Cys bioconjugate size of ∼47 nm. Based on FEM computations, linear Au-Cys aggregates with similar length are capable of resulting in absorptance peaks in the interval of the measured primary and secondary absorptance maxima (Table1). When overlapping shells are considered, aggregates consisting of three particles have maxima at 540 and 628 nm (dot purple curve in Fig.2a). The more realistic nonintersecting shells result in good matching between the computed 625 nm and measured 631 nm secondary maxima (dash–dot purple curve in Fig. 2a). Although the entire length of the five-NP linear chain is larger than the average diameter measured by DLS, this Au-Cys aggregate geome- try was selected to study the array and illumination direction effects, as intersection of covering biomolecule shells is less probable.
The absorptance curve on Ag-Cys bioconjugates indi- cates separated primary and secondary maxima corresponding to Δλ ∼197 nm split, which is approxi- mately two times larger than the split observable on Au- Cys conjugates (Fig. 2b, Table 1). The higher sensitivity of the spectra to aggregation indicates that Ag-Cys bio- conjugates ensure higher sensitivity in aggregate-based sensors. The DLS measurements indicated Ag-Cys aggre- gate average diameters approximately one order of mag- nitude larger than in the case of Au-Cys aggregates.
FEM computations revealed that very long linear and medium-length wavy ensembles exhibit maxima at anal- ogous spectral positions and with commensurate split, as the measured peaks. In the case of overlapping shells, 63 Ag NPs result in maxima at 414 and 587 nm ensuring an almost perfect match between the measured and comput- ed secondary peaks (dashed purple curve in Fig. 2b).
Wavy aggregates with nonintersecting shells result in maxima at 398 and 577 nm, i.e., providing good match- ing between the measured and computed primary peaks (solid purple curve in Fig. 2b). The computed split better approximates the measured Δλ value in the case of the wavy Ag-Cys chain, and the absorption spectrum of the wavy Ag-Cys aggregate has larger FWHM similarly to the measured wide peaks. Both long linear and short wavy Ag-Cys aggregates were investigated to inspect the array- and illumination direction-related effects.
Comparison of Spectra Originating from Vertical and Horizontal Aggregate Arrays
In the case of vertically aligned aggregates, only A-type coupling is possible originating from the interaction of linear or wavy aggregates aligning parallel to each other atP dis- tance, which equals with the length of the unit cell. This coupling is characteristic for aggregate arrays withPperiod- icity and involves all interactions between particles in neigh- boring parallel aggregates (Fig.1a, c). A significant difference between the two investigated aggregate geometries is that in linear chains, the shortest distance between interacting par- ticles in neighboring aggregates is thePperiodicity in vertical arrays, while in wavy aggregates, also A-type coupling involves interaction of particles at distances either smaller or larger than P periodicity. The Aw-type coupling results in broadened spectral response according to the wider interval of distances between interacting particles.
The horizontal arrangement of the aggregates makes it pos- sible for more types of coupling phenomena to be involved in collective plasmonic resonances. The B-type coupling is also at play, which involves all interactions between particles in neigh- boring aggregates at distances in [P–L,P+L] interval in hori- zontal arrays of aggregates withLlength aligning in cubical unit cells withPside. The strength of interaction is governed by the shortest distance between in-line aggregates, which equals with theP–Ldistance between the ends of NP ensembles. Closely packed in-line ensembles have potential to enhance this B-type coupling due to near-field interaction (Fig.1b, d).
The array effect may result in the appearance of addition- al absorptance peaks, when the adding of the light wave vector and the grating wave vector results in plasmon mode, the wavelength or multiple wavelength of which is com- mensurate with the aggregates' length. The grating-coupled plasmon wavelength can be calculated as:
kplasmon¼kphotonþnP; ð1Þ
where j j ¼P 2p=P reveals the grating wave vector corresponding to thePperiodic unit cells. Resonant excita- tion occurs with nodes/antinodes at both ensemble ends, when the length of the aggregate is multiple of the half- plasmon wavelength:
L¼mlplasmon
2 ; ð2Þ
while resonant oscillations with node–antinode pairs at en- semble ends occur when the length of the chain is odd- integer-times of quarter plasmon wavelength:
L¼ ð2m01Þl0plasmon
4 : ð3Þ
Based on the analogy between NP ensembles and elon- gated antenna-like nano-objects, the phase pick-up upon reflection determines whether antinodes or nodes appear at the termination of the chain, i.e., whether a half or quarter wavelength of the resonant modes is commensurate with the chain [19].
An important difference between vertical and horizontal arrays is that in horizontal arrays, thekphoton;IIprojection of the light wave vector along the NP ensemble is parallel to the P array wave vector along B-type coupling direction, while thekphoton;II andPwave vectors are perpendicular to each other for all grating wave vectors in vertical arrays. As a result, the contribution of far-field coupling to resonant excitation of coupled plasmonic modes along NP arrays is predicted for horizontal arrays. The parallelism of the kphoton;II photon wave vector projection to Pgrating vector along B-type coupling makes it possible to excite modes, which are unattainable in vertical arrays, i.e., more and larger absorptance peaks are expectable in horizontal arrays.
Effect of Au-Cys Aggregates' Orientation
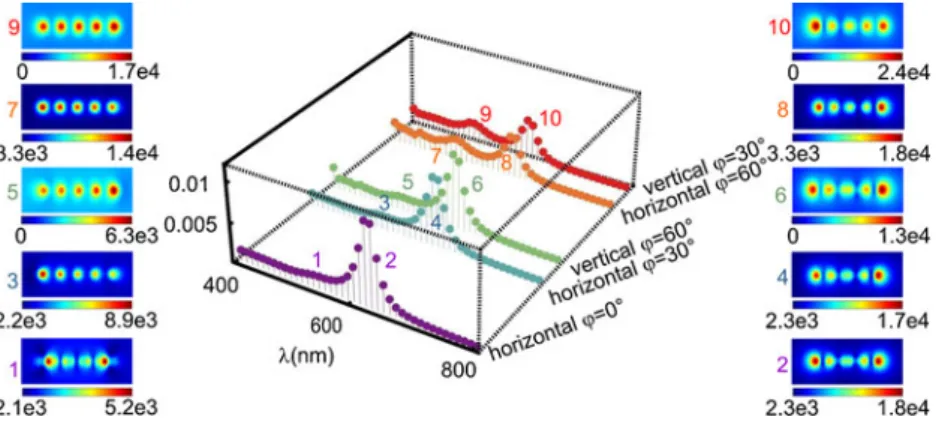
In the case of perpendicular incidence (φ00°) onto horizontal array ofN05 Au-Cys bioconjugate ensembles, a large absorp- tance peak is observable at 625 nm, while only a shoulder appears in the spectral interval of the measured primary peak, corresponding to∼7 ratio of absorptances (dash–dot purple curve in Fig.2aand purple spectrum in Fig.3). By increasing the angle of incidence to φ030°, the red-shifted peak decreases, the shoulder becomes more pronounced, and appears at slightly smaller wavelength (blue spectrum in Fig.3). Atφ060° incidence angle, a separated primary peak appears at∼520 nm, proving that small linear Au-Cys chains are capable of contributing to the absorptance in this spectral interval when they are illuminated at large polar angles. The secondary peak further decreases by increasing the angle of incidence (orange spectrum in Fig.3).
Interestingly, the spectra of vertical arrays differ from the spectra of horizontal arrays at analogous α illumination directions (green-to-blue and red-to-orange spectra in
Fig. 3). On the spectra of horizontal arrays, both primary and secondary extrema are noticeably forward shifted, and the red-shifted peaks are slightly smaller compared to the secondary maxima on spectra of vertical arrays.
Although there is a slight difference between the primary and secondary absorptance peaks on spectra of horizontal and vertical arrays, this small difference indicates that there is no symmetry breaking in the near field of the tiny Au-Cys aggregates caused by their nearest neighbors. The very small 72-nm length of the investigated Au-Cys linear chain does not promote near-field interaction in horizontal arrays, i.e., the observed differences may originate from different types of far-field couplings in horizontal and vertical arrays.
The near-field pictures indicate similar odd modes corresponding tom01 at all secondary maxima, withE-field antinodes at the ends of the linear chains (pictures indicated by even numbers in Fig. 3). The intensity distribution is symmetrical in the case of perpendicular incidence, when the p-polarized light excites purely longitudinal modes (pic- ture 2 in Fig. 3). The nodes are forward shifted along the propagation direction with increasingφangle of incidence, when the transversal modes are gradually enhanced.
At the primary maxima, the tilting results in a significant change in the E-field distribution along the array (pictures indicated by odd numbers in Fig. 3). At perpendicular inci- dence, even modes appear corresponding tom02 in contra- diction with the literature predicting even modes only for oblique incidence or bent objects (picture 1 in Fig.3) [20].
The α060° illumination direction (φ030°/60°) causes the appearance of one single node close to the exit/entrance side of the small chains in horizontal/vertical arrays. This reveals a different phase jump upon reflection in the spectral interval of the primary peak, which corresponds to a chain length commensurate with a quarter wavelength of the res- onant modes (picture 3/5 in Fig. 3) [19]. When the angle between the beam and the chain is smaller, i.e., at α030°
(φ060°/30°) in horizontal/vertical arrays, transversal modes become dominant, and the intensity modulation along the chain is less pronounced (picture 7/9 in Fig.3). Even though the n03 order grating coupling is capable of resulting in
Fig. 3 Transformation of the split spectra of linear chain-like Au-Cys aggregates consisting ofN05 Au NPs arrayed at 0.8 nm gap, when the angle of incidence is 0° (purple), 30°
(blue), and 60° (orange) in horizontal array, and 60°
(green) and 30° (red) in vertical array. Thepicturesindicate the normalizedE-field at the pri- mary (odd numbers) and sec- ondary (even numbers) peaks on the spectra
plasmonic mode excitation with half wavelengths equal to the chain length in all of the investigated cases, odd modes corresponding tom′01 are dominant at the primary peak at oblique incidence (pictures indicated by odd numbers in Fig.3, except picture 1).
Effect of Linear Ag-Cys Aggregates' Orientation
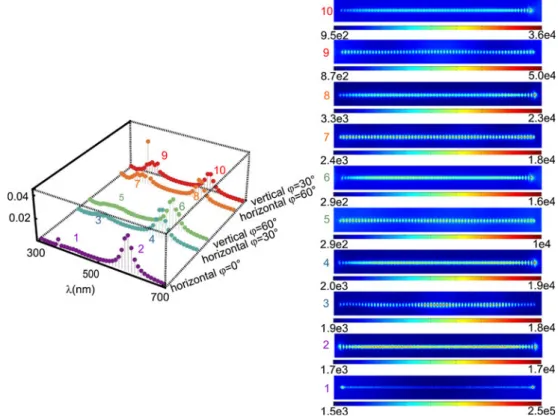
In the case of perpendicular incidence (φ00°) onto horizon- tal array of linear chain-like aggregate consisting ofN063 Ag-Cys bioconjugates, the ratio of absorptances at the pri- mary (414 nm) and secondary (587 nm) maxima is ∼16 (dashed purple curve in Fig. 2b and purple spectrum in Fig.4). When the light is incident atφ030° onto horizontal Ag-Cys array, the red-shifted peak decreases, while the UV peak increases, and appears at a smaller 400-nm wavelength (blue spectrum in Fig.4). Further enhanced UV maximum appears at φ060° incidence angle at the same spectral position. These observations prove that long linear chains significantly contribute to the absorptance in the spectral interval of primary peak, when they are illuminated at large polar angles. The secondary peak is further decreased and is smaller than the primary peak atφ060° angle of incidence (orange spectrum in Fig.4).
The spectra computed on long linear Ag-Cys chains more significantly depend on whether the elongated Ag-Cys aggregates are arrayed vertically or horizontally in the unit cells, than in the case of tiny Au-Cys ensembles (green-to- blue and red-to-orange spectra in Fig.4). A slightly smaller
primary peak appears in the vertical array illuminated atφ0 60° in comparison to the maximum observed, when the horizontally arrayed ensembles are illuminated at analogous α060° direction. The secondary peak is more pronounced in the vertical Ag-Cys array similarly to the observation on Au- Cys bioconjugates (green-to-blue spectra in Fig.4). In the case of φ030° angle of incidence onto vertical array of Ag-Cys chains, a split primary peak appears, with local maxima at smaller wavelengths, and a global maximum coincident with the primary maximum observed at analogous α030° illumination direction of the horizontal chains.
Interestingly, the absorptance is larger in vertical array at wavelengths before the global maxima, but larger maximal absorptance is reached in horizontal arrays. The red-shifted peak is smaller in vertical arrays than at analogous α030° illumination direction of horizontal Ag-Cys chains (red-to-orange spectra in Fig. 4). The 558-nm length of the chain makes possible near-field interaction in horizon- tal arrays, as the 21-nm distance between the ensembles is commensurate with the decay length of the plasmon field at Ag–water bounding media.
At the secondary maximum, the P0600 nm periodic grating may result in coupling into modes corresponding tom03 close to the investigatedφ030° angle of incidence, while the condition of grating coupling to modes corresponding to m04 is fulfilled at φ060° angle of inci- dence. The higher secondary peaks observed in the case of φ060° incidence angles are related to exactly met grating coupling condition.
Fig. 4 Transformation of the split spectra of a linear Ag-Cys aggregate consisting ofN063 Ag NPs arrayed at 0.6 nm gap, when the angle of incidence is 0° (purple), 30° (blue), and 60°
(orange) in horizontal array, and 60° (green) and 30° (red) in vertical array. Thepicturesin- dicate the normalizedE-field at the primary (odd numbers) and secondary (even numbers) peaks on the spectra
The decreased primary peak in the case of vertical arrays in comparison to primary maximum on horizontal array illuminated at analogousα060° reveals complex coupling effects. A larger primary peak, which is expected in the case ofφ060° angle of incidence due to the commensurability of the chain length with the half wavelength of grating-coupled modes corresponding tom05, is not observable in vertical arrays. The observed tiny difference between the primary peaks on spectra of aggregates in horizontal and vertical arrays may originate partially from symmetry breaking in the near field of neighboring extended aggregates and might be related to the parallelism of the horizontal chains to the grating wave vector.
Theoretically, the grating coupling results in excitation of modes corresponding to m04 at ∼360 nm wavelength at φ030° angle of incidence, while coupling to resonant modes corresponding tom05 occurs around 400 nm atφ060° angle of incidence. This incidence angle-dependent coupling effi- ciency explains the wavelength-dependent ratio between the primary peaks originating from vertical/horizontal arrays at analogousα030° (φ030°/60°) illumination directions.
The near-field images about theE-field distribution at the secondary peaks indicate interference of different coexistent modes on the long linear Ag-Cys chains. The intensity distribution reveals collective resonance oscillation corresponding tom01 andm02 in the case of perpendicular incidence, even though odd dipolar oscillation is expected based on excitation of longitudinal modes by p-polarized light (picture 2 in Fig.4). At φ030°/60° incidence angles, resonant modes predicted by grating coupling theory corresponding to m03/4 are not observable on the aggre- gates in either of the horizontal or vertical arrays (pictures 4/
8 and 10/6 in Fig.5).
Similar complex collective oscillations are observable at the primary maxima (images indicated by odd numbers in Fig.5). In horizontal array, the even/odd modes are notice- able at φ030°/60° incidence angles in agreement
with the theory predicting grating coupling to modes corresponding to m04/5 at the primary peaks (picture 3/7 in Fig.5). In vertical arrays, the effect of analogous grating coupling is less noticeable on the intensity distribution (pic- ture 9/5 in Fig. 5). This proves that the parallelism of the long axes of the aggregates promotes efficient mode excita- tion via grating coupling in horizontal arrays. To inspect the contribution of different array effects that may be at play in vertical and horizontal arrays, a different aggregate geome- try was also investigated.
Effect of Wavy Ag-Cys Aggregates' Orientation
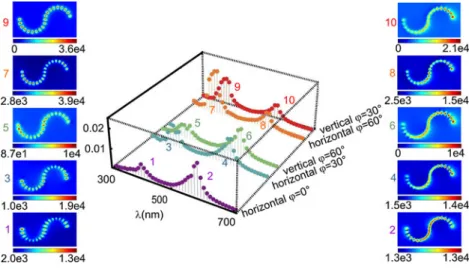
The ratio of the primary (398 nm) and secondary (577 nm) maxima is ∼3, when wavy aggregates of N020 Ag-Cys bioconjugates are illuminated by perpendicularly incident light, i.e., the primary peak is the most pronounced in this geometry (solid purple curve in Fig.2band purple spectrum in Fig.4). Illumination of the horizontal array consisting of wavy Ag-Cys ensembles atφ030° causes a decreased red- shifted peak and a split UV peak (blue spectrum in Fig.4).
A further enhanced UV maximum appears atφ060° inci- dence angle at the same spectral position without split. The secondary peak is smaller than the primary peak atφ060°
angle of incidence, i.e., the ratio of the absorptance values at the maxima is reversed at large φ polar angles (orange spectrum in Fig.4).
The spectra modify in a different manner, when wavy Ag-Cys aggregates are illuminated in vertical instead of horizontal arrays, in comparison to the long linear Ag-Cys aggregates (green-to-blue and red-to-orange spectra in Fig. 5). The primary peak in the vertical array illuminated atφ060° exhibits a similar split but is slightly smaller than the maximum on horizontal array at analogousα060° illu- mination direction (green-to-blue spectra in Fig.4). A single primary peak appears atφ030° angle of incidence on the vertical array, but the absorptance is smaller than in NP
Fig. 5 Transformation of the split spectra of a wavy Ag-Cys aggregate consisting ofN020 Ag NPs arrayed at 0.8 nm gap, when the angle of incidence is 0° (purple), 30° (blue), and 60°
(orange) in horizontal array, and 60° (green) and 30° (red) in vertical array. Thepicturesin- dicate the normalizedE-field at the primary (odd numbers) and secondary (even numbers) peaks on the spectra
ensembles illuminated atα030° in horizontal array (orange- to-red spectra in Fig.4). The secondary red-shifted peaks are coincident in vertical and horizontal arrays of wavy Ag-Cys bioconjugates at analogous illumination directions.
The 123-nm length of the wavy Ag-Cys ensembles in 600-nm unit cells does not make possible near-field interac- tion in horizontal arrays caused by ten times larger distance between the wavy Ag-Cys aggregates in comparison to linear Ag-Cys chains. The same spectral position of the split on primary peaks observed in horizontal and vertical arrays at analogous α060° illumination direction, as well as the strong polar angle dependence of maximal values, reveals different array effects. Namely, atφ030° incidence angle, then02/1 order grating–coupling enables excitation of plas- mon modes with wavelength, which is commensurate with the length of the wavy aggregate at the primary/secondary peak. When the light is incident atφ060° angle onto the arrays, then03/1 order grating–coupling is capable of ex- citing plasmons with wavelength commensurate with the long axes of the wavy chain. The expected modes corre- spond tom02/m01 cases at the primary/secondary peaks.
The near-field pictures taken at the secondary maxima indicate E-field nodes in at least one end of the wavy aggregates. The intensity distribution reveals collective di- polar oscillation corresponding tom01 in the case of per- pendicular incidence, even though p-polarized light excites longitudinal and transversal modes simultaneously in wavy ensembles (picture 2 in Fig.5).
Atφ030°/60° incidence angles, the entire wavy aggre- gate length seems to be commensurate with a quarter wave- length of the resonant modes corresponding to m′01 (pictures 4/6 in Fig.5) and m′03 (pictures 10/8 in Fig.5), rather than with a half wavelength. The expected decrease in wavelength, (namely by increasing the angle of incidence from 30° to 60° the half wavelength of modes should be commensurate with the long axes, instead of the chain length) is not noticeable (pictures 4 to 8 and 10 to 6 in Fig.5). Interestingly, nodes are located at the entrance of the ensembles with respect to the propagation direction in both arrays at oblique incidence.
At the primary maxima, antinodes are observable at both the entrance and exit of the wavy ensemble (pictures indi- cated by odd numbers in Fig.5). At perpendicular incidence and at α060° illumination direction (φ030°/60°), even modes appear corresponding to m02 in agreement with the literature predicting even modes for bent objects (picture 1, 3, and 5 in Fig.5) [20]. Interestingly, atα030° illumina- tion direction (φ060°/30° in horizontal/vertical arrays), odd modes appear at the primary peak with antinodes at the wavy aggregates' ends (picture 7/9 in Fig.5).
In horizontal array the equality of the wavy aggregate length with the wavelength of the dominant mode atφ030°
angle of incidence is in accordance with the prediction of n02 order grating-coupled mode (picture 3 in Fig.5). At φ060° angle of incidence, a resonant mode corresponding tom01 having a half wavelength equal with the long axis is observable in accordance with n01 order grating-coupled mode, rather than the expected mode corresponding ton03, m02 cases (picture 7 in Fig. 5). However, the intensity distribution in vertical arrays is more similar at an analo- gous α illumination direction of the chains rather than at analogous φ incidence angles onto the arrays. This obser- vation confirms that the relative orientation of the elon- gated NP ensembles with respect to the array plane plays a key role in determination of collective resonances.
Conclusion
The comparative study of Au-Cys and Ag-Cys bioconju- gates' absorption was performed. FEM computations proved that fundamentally different and illumination direction- dependent collective plasmonic resonance oscillations ap- pear at the primary and secondary peaks on spectra mea- sured at the same pH ∼4.9. Short linear chains of Au-Cys bioconjugates have spectra less sensitive to the aggregates' orientation and weakly effected by coupling on arrays with the investigated periodicity. Dipole-like collective oscilla- tions appear along short Au-Cys chains at perpendicular incidence, which are transformed to transversal modes by Table 1 Parameters (N,d,g) of each investigated aggregate geometry
and (λ1andλ2) positions of primary and secondary maxima on the measured/computed spectra, the correspondingΔλsplit, theLaverage
aggregate diameter determined by DSL and the theoretical aggregate length applied in FEM computations
N d(nm) g(nm) λ1(nm) λ2(nm) L(nm) Δλ(nm)
Gold Measured pH04.95 – 13.6 – 535 631 47 96
Linear I 3 13.6 0.6 540 628 43 88
Linear II 5 13.6 0.875 Shoulder 542 625 72 83
Silver Measured pH04.92 – 8.25 – 391 588 523 197
Linear 63 8.25 0.6 414 587 558 173
Wavy 20 8.25 0.8 398 577 181/123 179
increasing the incidence angle more rapidly in horizontal arrays. Grating-coupled antenna-like mode development is observable also for oblique incidence at the secondary peak, while only for perpendicular incidence at the primary peak.
The spectra of very long linear chains of Ag-Cys aggre- gates are more sensitive to the illumination direction and exhibits both near- and far-field coupling-related array effects. The collective resonance oscillations originating from interference of coexistent modes involve antenna-like modes originating from grating–coupling on horizontal arrays of long linear chains.
Wavy Ag-Cys aggregates exhibit the largest primary peak, which becomes rapidly dominant by increasing the illumination angle. Antenna-like even and odd modes ap- pear at the primary and secondary maxima, and modes originating from grating–coupling are identifiable at small incidence angles. Interestingly, the aggregates' orientation determines the near-field distribution, namely the same modes appear at analogous illumination directions with respect to the aggregates' long axes, rather than at the same angle of incidence onto the aggregate array.
The conclusion of the present study is that both spectral properties and near-field distribution might be controlled by appropriately illuminated horizontal arrays of extended aggregates with proper geometry. These findings are helpful in aggregate-based biosensor development and in the design of nanoparticle waveguides for wavelength-selective and directional signal transportation.
Acknowledgments The study was funded by the National Develop- ment Agency of Hungary with financial support from the Research and Technology Innovation Fund (CNK-78549) and OTKA K 75149. The publication is supported by the European Union and cofunded by the European Social Fund. Project title:“Broadening the knowledge base and supporting the long term professional sustainability of the Re- search University Centre of Excellence at the University of Szeged by ensuring the rising generation of excellent scientists.”Project num- ber: TÁMOP-4.2.2/B-10/1-2010-0012. This work is a part of the project“TÁMOP-4.2.1/B-09/1/KONV-2010-0005—Creating the Cen- ter of Excellence at the University of Szeged.”The project named
“TÁMOP-4.2.1/B-09/1/KONV-2010-0005—Creating the Center of Excellence at the University of Szeged”is supported by the European Union and cofinanced by the European Regional Development Fund.
References
1. Jensen T, Kelly L, Lazarides A, Schatz GC (1999) Electrodynam- ics of noble metal nanoparticles and nanoparticle clusters. J Clust Sci 10:295–317
2. Schuller A, Barnard ES, Cai W, Jun YC, White JS, Brongersma ML (2010) Plasmonics for extreme light concentration and manip- ulation. Nat Mater 9:193–204
3. Liz-Marzán LM (2006) Tailoring surface plasmons through the morphology and assembly of metal nanoparticles. Langmuir 22:32–41
4. Lal S, Link S, Halas NJ (2007) Nano-optics from sensing to waveguiding. Nat Photonics 1:641–648
5. Anker JN, Hall WP, Lyandres O, Shah NC, Zhao J, Van Duyne RP (2008) Biosensing with plasmonic nanosensors. Nat Mater 7:442– 453
6. Daniel MC, Astruc D (2004) Gold nanoparticles: assembly, supra- molecular chemistry, quantum-size-related properties, and applica- tions toward biology, catalysis, and nanotechnology. Chem Rev 104:293–346
7. McFarland AD, Van Duyne RP (2003) Single silver nanoparticles as real-time optical sensors with zeptomole sensitivity. Nano Lett 3:1057–1062
8. Quinten M, Kreibig U (1993) Absorption and elastic scattering of light by particle aggregates. Appl Opt 32:6173–6182
9. Rosi NL, Mirkin CA (2005) Nanostructures in biodiagnostics.
Chem Rev 105:1547–1562
10. Sweatlock LA, Maier SA, Atwater HA, Penninkhof JJ, Polman A (2005) Highly confined electromagnetic fields in arrays of strongly coupled Ag nanoparticles. Phys Rev B 71:235408
11. Mandal S, Gole A, Lala N, Gonnade R, Ganvir V, Sastry M (2001) Studies on the reversible aggregation of cysteine-capped colloidal silver particles interconnected via hydrogen bonds. Langmuir 17:6262–6268
12. Jing C, Fang Y (2007) Experimental (SERS) and theoretical (DFT) studies on the adsorption behaviors of L-cysteine on gold/silver nanoparticles. Chem Phys 332:27–32
13. Csapó E, Patakfalvi R, HornokV TL, Sipos Á, Szalai A, Csete M, Dékány I (2012) Plasmonic properties of biofunctionalized silver nanoparticles at different pH. Colloids Surf B 98:43–49
14. Majzik A, Fülöp L, Csapó E, Bogár F, Martinek T, Penke B, Bíró G, Dékány I (2010) Functionalization of gold nanoparticles with amino acid, β-amyloid peptides and fragment. Coll Surf B 81:235–241
15. Szalai A, Sipos Á, Csapó E, Hornok V, Tóth L, Csete M, Dékány I (2011) Numerical investigation of the plasmonic properties of bare and cysteine-functionalized silver nanoparticles. Plasmonics: Me- tallic Nanostructures and Their Optical Properties IX, edited by Mark I. Stockman, Proceedings of the SPIE, 8096:80963B 16. Palik ED (1998) Handbook of optical constants of solids. Aca-
demic, San Diego
17. Arwin H (1986) Optical properties of thin layers of bovine serum albumin, γ-globulin, and hemoglobin. Appl Spectrosc 40:313–318
18. Daimon M, Masamura A (2007) Measurement of the refractive index of distilled water from the near-infrared region to the ultra- violet region. Appl Opt 46:3812–3820
19. Barnard ES, White JS, Chandran A, Brongersma ML (2008) Spectral properties of plasmonic resonator antennas. Opt Express 16:16529–16537
20. Laurent G, Félidj N, Aubard J, Lévi G, Krenn JR, Hohenau A, Schider G, Leitner A, Aussenegg FR (2005) Evidence of multipo- lar excitations in surface enhanced Raman scattering. Phys Rev B 71:045430