Dörgő Gyula Ádám
Pannon Egyetem
2021
Doktori (PhD) Értekezés
Gépi tanulási technikák fejlesztése alarm managementben
Szerző:
Dörgő Gyula Ádám
Konzulensek:
Prof. Palazoglu Ahmet Prof. Dr. habil. Abonyi János
Értekezés doktori (PhD) fokozat elnyerése érdekében a Pannon Egyetem
Vegyészmérnöki- és Anyagtudományok Doktori Iskolájához tartozóan
Folyamatmérnöki Intézeti Tanszék
Pannon Egyetem 2021
DOI:10.18136/PE.2021.789
Doctoral (PhD) Thesis
Machine learning techniques for alarm management
Author:
Gyula Ádám Dörgő
Supervisors:
Prof. Ahmet Palazoglu Prof. Dr. habil. János Abonyi
A thesis submitted in fulfilment of the requirements for the degree of Doctor of Philosophy
in the
Doctoral School in Chemical Engineering and Material Sciences of University of Pannonia
Department of Process Engineering
University of Pannonia
2021
akik már tudnak saját magukon nevetni.
Vagy legalábbis másokon.
Dévényi Tibor
With the love and respect of the research profession, I recommend these few flicks to all those
who can already laugh at themselves.
Or at least on others.
Tibor Dévényi
Kivonat
Mérnöki Kar
Folyamatmérnöki Intézeti Tanszék Philosophiæ Doctor
Gépi tanulási technikák fejlesztése alarm managementben
írta: Dörgő Gyula Ádám
A vegyipari üzemekben a biztonságos működés fenntartása során az operátorok a folyamatirányító rendszerek által adott vészjelzésekre támaszkodnak. A számító- gépek terjedésével azonban a vészjelzések definíciója pusztán digitálisan történik és nem jár a fizikai installációhoz köthető többletköltségekkel. Ennek eredmé- nyeképpen megnövekedett a rossz minőségű jelzések száma, melyek túlterhelik a technológiát üzemeltető operátorokat. Ez a tendencia csak további lendületet ka- pott az Ipar 4.0 forradalom irányelveinek köszönhető robbanásszerű szenzorszám növekedéssel. Ennek eredményeképpen a jelzéseket tartalmazó alarm & event-log adatbázisok elemzése komplex adatelemzési feladattá vált, amelynek elsődleges célja az üzemeltetői munka támogatása. Dolgozatomban alarm management fel- adatok megoldására szolgáló gépi tanulási technikák gyűjteményét mutatom be.
Első lépésben az alarm management rendszerek mérését tekintem át, és bemu- tatom hogyan lehet a manapság alkalmazott adatalapú mérőszámokat azok cél- jai alapján hét kategóriába sorolni. Ezt követően egy döntési fa alapú módszert javaslok a vészjelzések definiálására, mely alapján a vészjelzéseket kiváltó meg- hibásodások azonosítására informatív vészjelzések definiálhatók. Ezt követi az alarm & event-log adatbázisok gyakori szekvencia alapú elemzési módszertanának bemutatása. Multi-temporális gyakori szekvencia bányászat alapú megközelítést javaslok a folyamatok diszkrét esemény alapú azonosítására, majd az azonosított folyamat alapján az események előrejelzésére és a meghibásodások továbbgyűrűző hatásának elemzésére. Végezetül, szemléltetve a mélytanulás területének alarm management célú alkalmazási lehetőségeit, egy rekurrens neurális hálózat alapú osztályozási megoldást mutatok be, mely alkalmas a folyamatokban megjelenő meghibásodások azonosítására a meghibásodást követő vészjelzések alapján.
Abstract
Faculty of Engineering Department of Process Engineering
Doctor of Philosophy
Machine learning techniques for alarm management
by Gyula ÁdámDörgő
In modern industrial plants, operators maintain a safe operation based on the in- dications of the process control systems. However, as with the rise of computers, the definition of alarm messages is determined purely computationally and entails no significant costs at all, the operators of the process become overloaded by un- informative and low-quality alarm messages. This trend just gained momentum with the exploding number of sensors of the Industry 4.0 revolution. As a res- ult, the analysis of industrial alarm & event-log databases has become a complex data analysis task aiming to determine meaningful alarms and the support of op- erator work. In the present thesis, a collection of machine learning techniques is introduced, presenting various possibilities for the reduction of operator workload.
First, an overview of the evolution of alarm system performance metrics is presen- ted, and the current data-based approaches are grouped into seven categories based on the goals associated with each metric. Then, a data-driven method based on decision trees is proposed for the design of alarm messages being informative for fault detection, which considers that the occurring alarm messages initially should be optimal for fault detection and identification. This is followed by the frequent sequence-based analysis of alarm & event-log datasets. A multi-temporal frequent sequence mining-based approach is proposed for the identification of the processes based on the occurring discrete events, for the prediction of future events and for the hierarchical detection of the spillover effect of malfunctions. Finally, illus- trating the application possibilities of the more and more trending field of deep learning, a recurrent neural network-based classifier is proposed for alarm-based fault detection and isolation of chemical processes.
Auszug
Fakultät für Ingenieurwissenschaften Abteilung für Verfahrenstechnik
Doktor der Philosophie
Machine-Learning-Techniken für das Alarmmanagement
von Gyula Ádám Dörgő
Bei einen moderne chemische Anlage kann eine Operator die sichere Betrieb mit Hilfe von die Alarme des Prozessleitsystems gewehrleisten. Heutzutage werden die tatsächliche Bedeutung von Alarmmeldungen mit Hilfe von Computern, rein rechnerisch bestimmt, ohne zusätzlichen physischen Installationen, welche zus- atzkosten verursachen würden. Dadurch kommen aber immer häufiger Meldungen mit schlechten Qualität vor, welche die Operatoren überfordern können. Dadurch ist die Auswertung von Alarm & Event Logs einen komplexen Aufgabe geworden.
Diese Datenanalyse sollte in erste Reihe die sicheren Betrieb unterstützen. In meinen Thesis werde ich eine Sammlung von Techniken des maschinellen Lernens vorgestellten, welche vereinfachen die Lösung von Alarmmanagement Aufgaben und damit reduziert den Workload von Operatoren. Als erstes gebe ich ein Überblick über die Entwicklung der Leistungskennzahlen von Alarmsystemen. Die aktuellen datenbasierten Kennzahlen werden basierend ihren Zwecken in sieben Kategorien eingeteilt. Danach wird ein auf Entscheidungsbäumen basierendes Verfahren vorgestellt. Diese Methode ermöglicht die Erstellung von Alarmmel- dungen, die ausreichend informativ sind über die auslösenden Fehler. Darauf folgt die häufige sequenzbasierte Analyse von Alarm-&-Ereignisprotokoll-Datensätzen.
Zur Identifikation der Prozesse anhand der auftretenden diskreten Ereignisse, zur Vorhersage zukünftiger Ereignisse und zur hierarchischen Detektion des Spillover- Effekts von Fehlfunktionen wird ein multitemporaler Frequent Sequence Mining- basierter Ansatz vorgeschlagen. Zur Veranschaulichung der Anwendungsmöglich- keiten des immer mehr im Trend liegenden Gebiets des Deep Learning wird schließ- lich ein rekurrenter neuralen Netzwerk-basierter Klassifikator zur alarmbasierten Fehlererkennung chemischer Prozesse vorgeschlagen.
Above all, I am very grateful to my supervisors. Prof. Dr. habil. Janos Abonyi, with your constant momentum, you pushed me further and further on my path, even when I made it harder not seeing the light. I am unspeakably grateful for your support and encouragement throughout the years. Prof. Ahmet Palazoglu, thank you very much for undertaking my supervision and making my time possible at the University of California, Davis. Your comments, aspiration and thoroughness shaped me greatly and truly put my research work on another level.
I am also very grateful to the supporting professional community around me. My special thanks and gratefulness go out to Dr. András Dallos for setting me off on this rough path. The colleagues and friends at the Department of Process Engin- eering really made my time during the years of the doctoral training. Moreover, I need to say thanks to the colleagues at the MOL Group for making invaluable practical comments on my work. From the professional community, a supporting friend and former fellow PhD student, Dr. Tamás Ruppert, cannot be left out, thank you very much.
Family and Friends. I know that I can be unbearable when I work, thanks for not letting me down. I am not just thankful, but lucky as well to have so many and so good Friends. The joy you made helped me through the everyday ups and downs.
My doctoral training would not have been possible without the unconditional love and support of my Family. And finally, thank you, Szabina.
them it wouldn’t be fun at all.
vi
Abstract ii
Acknowledgements v
Contents vii
1 Introduction 1
1.1 Research questions and thesis outline . . . 4
2 How to measure the performance of an alarm system? Quality vs. quantity of alarm messages 7 2.1 Introduction . . . 8
2.2 The trends of alarm system performance measurement . . . 10
2.3 Measurement of alarm system performance . . . 15
2.3.1 Alarm attributes . . . 16
2.3.2 Load-based metrics . . . 19
2.3.3 Diagnostic metrics . . . 25
2.3.4 Deployment metrics . . . 28
2.3.5 Scaling metrics . . . 28
2.3.6 Audit metrics . . . 28 vii
2.3.8 Operator’s perspective . . . 32
2.4 How to point out the improvement of an alarm system? - A case study . . . 36
2.4.1 Load-based metrics . . . 36
2.4.2 Specific investigations . . . 40
2.5 Discussion and open challenges . . . 44
2.6 Chapter summary . . . 45
3 Decision trees for informative process alarm definition and alarm- based fault classification 47 3.1 Introduction . . . 48
3.2 Related work . . . 49
3.3 Motivation & contributions . . . 52
3.4 Informative alarm messages for the detection of faulty operation states of complex processes . . . 54
3.4.1 Decision tree classification of regions of operation . . . 54
3.4.2 Data generation & preprocessing . . . 57
3.4.3 Construction and interpretation of decision trees . . . 61
3.4.4 Measuring the performance of the designed alarm system . . 63
3.5 The case study of the vinyl acetate process . . . 64
3.5.1 The simulated data set . . . 64
3.5.2 The alarm levels of the vinyl acetate process simulator . . . 65
3.6 Limitations and development opportunities . . . 71
3.7 Chapter summary . . . 74
4.1 Introduction . . . 76
4.1.1 The methodologies of alarm design . . . 77
4.1.2 Advanced alarm reduction techniques . . . 78
4.1.3 Motivation and outline of the chapter . . . 80
4.2 Methodology . . . 81
4.2.1 Multi-temporal representation of alarm sequences . . . 81
4.2.2 Probabilistic interpretation of temporal patterns . . . 85
4.2.3 The multi-temporal mining algorithm . . . 88
4.2.4 Workflow of the methodology . . . 89
4.3 Results and discussion . . . 90
4.3.1 The multi-temporal representation of a dynamic process . . 90
4.3.2 Defining and implementing faults into the vinyl acetate pro- cess simulator . . . 93
4.3.3 The generation of the log files of process alarms . . . 93
4.3.4 Correlation of occurring alarms . . . 95
4.3.5 The characterization of faults based on their complexity . . 96
4.3.6 Development of alarm suppression rules . . . 101
4.3.7 Limitations . . . 103
4.4 Chapter summary . . . 104
5 Hierarchical Frequent Sequence Mining for the Analysis of Pro- duction Processes 106 5.1 Introduction . . . 107
5.2 Hierarchical mining of multi-temporal alarm sequences . . . 110
5.2.2 Probabilistic interpretation of hierarchical sequences . . . 113
5.2.3 The hierarchical multi-temporal mining algorithm . . . 115
5.2.4 Measuring the orientation of the propagation of the effect of process malfunctions . . . 115
5.3 Industrial case study . . . 118
5.3.1 Description and preprocessing of the analysed dataset . . . . 118
5.3.2 Hierarchical alarm sequences of the analysed delayed coker plant . . . 124
5.3.3 Sequence based causality analysis . . . 125
5.4 Discussion of results . . . 129
5.5 Chapter summary . . . 131
6 Sequence-based fault detection and isolation 133 6.1 Introduction . . . 134
6.2 Fault classification and visualization of process alarms . . . 136
6.2.1 Formulation of the event sequence based fault classifier . . . 136
6.2.2 Recurrent neural network layer with long short-term memory units . . . 139
6.2.3 Embedding layer based analysis of the alarms and the ana- lysis of node activities . . . 141
6.3 A case study . . . 142
6.3.1 Fault classification problem of the vinyl acetate process . . . 143
6.3.2 Application of the proposed recurrent neural network for fault classification . . . 145
6.3.3 Embedding layer based analysis of process alarms . . . 150
6.3.4 Analysis of the similarity of process faults based on the activ- ities of the long short-term memory units . . . 153 6.4 Chapter summary . . . 155
7 Conclusions 157
8 Thesis findings 160
9 Appendix 163
9.1 Description of the vinyl acetate process simulator . . . 163 9.2 Defining and implementing faults into the vinyl acetate process sim-
ulator . . . 165 9.3 Run length distribution based cleaning of alarm data . . . 166
10 Farewell 170
Acronyms 171
Bibliography 177
Introduction
In process control system-supported production plants, alarm messages are raised when a specific process variable exceeds its associated limits. According to the En- gineering Equipment and Materials Users’ Association (EEMUA) [1] the purpose of an alarm system is to redirect the operator’s attention towards plant conditions requiring timely assessment or action. Accordingly, the process of alarm manage- ment means the efficient design, implementation, operation, and maintenance of industrial process alarms.
At the dawn of the process control systems, the deployment of a new alarm message required the physical implementation of a light or sound signal (lamp or horn) to the system. The definition of each alarm was thoroughly reasoned and considered.
However, with the computer systems gaining more and more space in distributed control systems (DCS) or supervisory control and data acquisition (SCADA) sys- tems, the definition of alarm messages is determined purely computationally and entails no significant costs at all. This resulted in an explosive increase in the num- ber of defined alarm messages in the process control systems. As a consequence, multiple and often redundant messages are implemented and the operators have become overloaded by the received alarm messages as schematically depicted in Figure 1.1. The process engineers faced the problem of recursively analysing and fine-tuning the master alarm databases containing the alarm definitions and mon- itoring the alarm load through the alarm logs containing the alarms and operator actions that occurred during the production. And here comes the topic of the present thesis work to the picture: the analysis of these databases of enormous
1
size without the application of advanced data analysis and machine learning tech- niques is a very time-consuming problem, requiring a significant human workload.
In the following, the development of data analysis and machine learning methods for alarm management are discussed.
Figure 1.1: The process operators have become overloaded by uninformative alarm messages, turning an increased attention towards the process of alarm management. The core topic of this thesis is the development of data-driven
solutions in process alarm management.
The application of data-related solutions is well reflected in the literature as well.
Figure 1.2 provides a bird’s eye view of the literature in the Scopus database with the search term "alarm management" and "machine learning" and "sequence" or
"pattern" in the engineering, chemical engineering, energy and computer science domains with the omission of the articles from the medical and social sciences. The figure shows the co-occurrence of keywords in the found 71 articles. Two keywords are connected if they co-occur at least three times. The different colours indic- ate the clusters of the network, representing different data-related fields in alarm management: the blue cluster represents the field of machine learning, data visu- alization, forecasting of events,etc., the red cluster illustrates the sequence-based representation of alarm floods and root cause analysis-related techniques, while in the green cluster, the topic is shifting towards the terms closer to industrial pro- duction plants. The yellow keywords form a collection of decision support-based terms, while the purple cluster provides more insight to the terms in connection with the modern aspects of networks and artificial intelligence.
Figure1.2:Theco-occurrenceofthekeywordsofthearticlesintheScopusdatabaseforthesearchterm"alarmmanagement"and "machinelearning"and"sequence"or"pattern"representsthedata-basedtasksinalarmmanagement.Twokeywordsareconnectedin thenetworkiftheyco-occuratleastthreetimes.(Accessed:May11,2021)
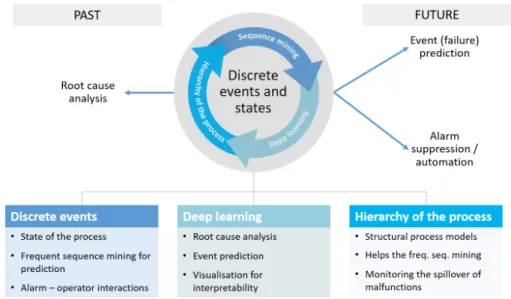
Figure 1.3: The schematic representation of the data-driven tasks of alarm management and the core focus points and driving forces of the present thesis.
Based on the literature overview, Figure 1.3 illustrates the widespread data-driven tasks in alarm management, whose development is also the main motivation and driving force of the present thesis. My focus is on the building of a model of the discrete events and states (represented mainly by alarm messages and operator actions) occurring in a chemical technology. During this task, different approaches and information are utilized: the frequent sequence-based model of discrete events, the currently trending field of deep learning and the application of traditional engineering knowledge in the form of process relevant information. Based on a well-functioning data-driven model built with these techniques, several tasks can be fulfilled. Starting with the supervision of alarm settings, the definition of alarm messages can be revised and optimized with more informative alarm thresholds, or the complex state of the process can be identified and similar alarm floods can be categorized. However, information anterior to the alarm messages can be deduced as well in the form of root cause analysis. On the other hand, predictions are possible as well, providing more time for the operators to avoid or prepare for a specific situation. Once the future alarm is known, assuming that it has no relevant information for the operators, it can be suppressed as well.
1.1 Research questions and thesis outline
The main research questions discussed in the present thesis are:
• How to measure the performance of an alarm system and what aspects char- acterize a well functioning alarm system?
Comparing the alarm management guidelines in the past decades, despite nu- merous publications on the subject, little has changed regarding the metrics used to measure the alarm system performance. The more and more com- plex production plants and the evolving of alarm management tasks from simple operative ones to be an ever-present problem for both management and engineering teams gives immediate rise to the questions: what makes a good alarm system and how to measure or even point out the problems of an alarm system? In Chapter 2, I provide an overview of the different approaches for the assessment of an alarm system, propose a categorization of the different solutions and introduce the results of my investigations on the evolution of the different metrics.
• How is it possible to define informative process alarms for alarm-based fault classification using decision trees?
The primary indicators for the operators of (chemical) technologies from faulty regions of operation are the alarm variables. Based on the assumption that the regimes of normal operation and different malfunctions should be distinguishable based purely on the alarm messages that have been raised, I formulate the problem of alarm limit definition as a data-based classification problem in Chapter 3. For the determination of the optimal alarm limits and description of the application of the generated alarm messages for fault classification, I propose a traditional machine learning technique, a decision tree-based solution.
• Is it possible to represent the complex state of an alarm management sys- tem by the events recorded in the alarm & event-log database and apply this representation for prediction purposes?
The discrete events recorded in the alarm & event-log database are the primary indicators of conditions requiring timely assessment or action for the operators. Relying on the assumption that based on the analysis of these events, the main operation scenario should be traceable, in Chapter 4, I introduce a frequent sequence mining-based approach for the mining of frequently occurring alarm messages. Accompanying the identified frequent sequence models with a Bayesian probability-based mathematical descrip- tion, I present how such models are appropriate for prediction purposes.
• How can we incorporate the information on the hierarchical structure of the process into the data-driven alarm management techniques in order to facil- itate the generation of more informative operational sequences?
Once I have presented how the frequent alarm sequences are capable of rep- resentation of the state of the process in a chemical production plant, a straightforward question is raised: How can we incorporate the vast know- ledge of process engineers and operators into the data-driven analysis tech- niques? In Chapter 5, I present how the process hierarchy can be incorpor- ated into the frequent sequence-based analysis of alarm management systems and how efficient this technique is in the detection of the spillover effect of malfunctions between different process units.
• Can deep recurrent neural networks be applied for the extraction of hidden relationships of discrete events in large process datasets?
The potential of the recently trending field of deep learning for the support of the process industries is unquestionable. However, its application for fault diagnosis in alarm management and the additional advantages of such models were previously undefined. In Chapter 6, a novel deep recurrent neural network-based model for fault diagnosis is proposed, utilizing the occurring alarm messages as inputs of the model. Based on the weights of the hidden layers of the model, I also present how the similarity of alarm messages can be visualized and their interpretation is discussed.
Each chapter of the present thesis starts with an introduction to the discussed topic with the overview of the related literature. Then, the discussion of the applied methodology and tools are followed by the description of the applied dataset and the analytical results. The chapters are ended with concluding remarks and dis- cussions. The chapters discussing the research works are followed by a conclusion section, discussing the general ideas and results. Finally, the thesis is ended by the thesis findings, containing the contributions to the topic of data-driven alarm management. The discussion of the vinyl acetate process simulation, used as a case study in several chapters throughout the thesis is presented in the Appendix.
How to measure the performance of an alarm system?
Quality vs. quantity of alarm messages
Despite significant efforts to measure and assess the performance of alarm systems, to this day, no silver bullet has been found. The majority of the existing stand- ards and guidelines focus on the alarm load of the operators, either during normal or faulty plant conditions, and only a small fraction takes into consideration the actions performed by the operators. In this chapter, an overview of the evolu- tion of alarm system performance metrics is presented and the current data-based approaches are grouped into seven categories based on the goals of and the meth- odologies associated with each metric. Deriving from the categorical overview, the terminological differences between the academic and industrial approaches of alarm system performance measurement are reflected. Moreover, I highlight how extremely unbalanced the performance measurement of alarm systems is towards quantitative metrics instead of focusing on qualitative assessment, invoking the threat of excessive alarm reductions resulting from such a unilateral approach.
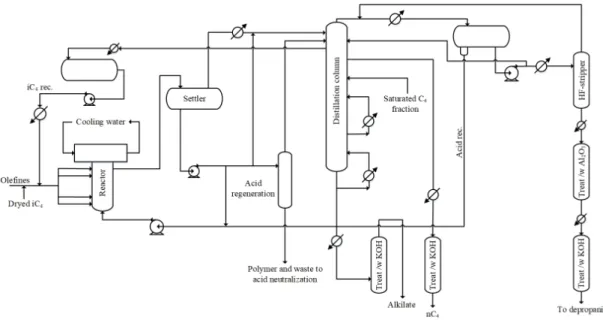
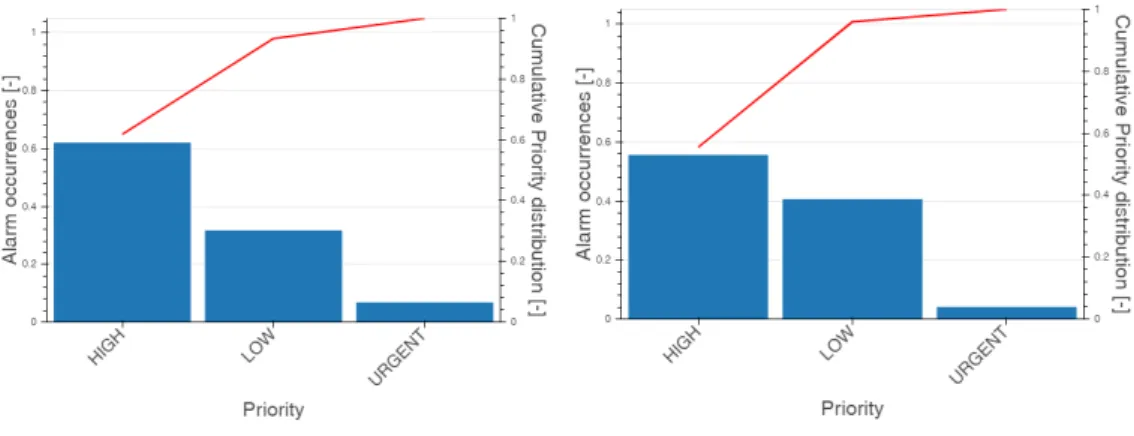
The critical aspects of qualitative performance measurement of alarm systems is demonstrated in terms of the comparison of the alarm system of an industrial hydrofluoric acid alkylation unit before and after the alarm rationalization pro- cess. The quality of the alarm messages is measured via their informativeness and
7
actionability, in other words, how appropriate the parameter settings are for the everyday work and how actionable they are by the operators of the process.
2.1 Introduction
Possibly the poorest alarm message most people may encounter in their everyday lives is the "check engine" light of a motorized vehicle [2]. This alarm message can indicate the presence of a number of malfunctions, with a wide range of con- sequences. Moreover, the optimal actions taken by the driver are also undeter- mined: it can vary from pulling over and stopping the vehicle immediately to a fault that does not affect the safety of transportation and can be handled at the next maintenance opportunity. While having just a single alarm message may be a very good situation for a chemical plant operator who is often overloaded with lots of messages, it is clear that this is neither optimal nor realistic. In the present chapter, I overview the different approaches of measuring the performance of an alarm system and attempt to shift the practice from the quantitative aspect of alarm load analysis to the incorporation of quality-based solutions.
According to the definition of the Engineering Equipment and Materials Users Association (EEMUA) in the well-known industrial standard [3], the purpose of an alarm system is to direct the operator’s attention towards plant conditions re- quiring timely assessment or action. However, as the cost of the software-based definition of alarms is negligible, the number of configured alarms has increased drastically due to intentions for enhanced productivity and safety. Moreover, the alarm messages of the more and more ubiquitous smart field devices generated an- other wave of alarm messages (many of which should be handled by maintenance rather than operations) [4]. The result is counterproductive, as the poor perform- ance of alarm system can undermine both productivity and safety. Moreover, the performance of an alarm system decays over time [5], and needs to be continu- ously monitored by the responsible team. The above mentioned examples, the one with the bad configuration of alarm messages (e.g., the check engine light) and the one explaining the problems of big alarm systems with decaying performance, highlight that during the past decades, the alarm management tasks have evolved from simple operative ones to be an ever-present problem for both management and engineering teams. The immediate questions that come to mind are: what
makes a good alarm system and how to measure or even point out the problems of an alarm system?
Inquiry into these questions gained some momentum with the achievements of Industry 4.0 and the revolution in cyber-physical systems, as an adequate alarm management system is also a prerequisite for the development of high performance human-machine interfaces [6], which is the focus of many production companies.
However, comparing the 1999 edition of the Engineering Equipment and Materi- als Users Association publication, the EEMUA-191 Alarm Systems - A Guide to design, Management and Procurement [7] and the IEC-626822014 Management of alarm systems for the process industries from 2014 [8], one sees that little has changed in the fifteen years between the two publications regarding the metrics used to measure the alarm system performance [9].
As a result, despite numerous publications on the subject, no universal solution has been found providing a simple and comprehensive answer to challenges in the measurement and comparison of different alarm systems. Moreover, even with the arrival and penetration of Industry 4.0 principles, the focal points of the measurement of alarm system performance remained unchanged. The present chapter provides an overview of the different approaches for the assessment of an alarm system, categorizes the different solutions and investigates the evolution of the different metrics. While this chapter aims at a general overview of existing approaches for data-based alarm system performance measurement and serves as a discussion starter in the topic, it also offers some novel contributions:
• A categorical analysis of the existing methods of data-based alarm system performance measurement is provided.
• The unbalanced approach of performance measurement metrics weighted heavily towards quantitative instead of qualitative ones is stressed.
• Two metrics are proposed for the measurement of the quality of the alarm messages in terms of their informativeness and actionability: the appropri- ateness of alarm parameter settings for everyday operations and the level of actionable alarms by the process operators.
The roadmap of the chapter is as follows. A summary of the background and evolution of alarm system performance metrics are provided in the next section
(Section 2.2). The categories of the data-based alarm system performance met- rics are introduced in Section 2.3. The different approaches for the data-based measurement of alarm systems is presented through the comparison of the alarm system of an industrial hydrofluoric acid alkylation unit before and after the alarm rationalization process in Section 2.4. Next, discussion of the results, the outlook and future research challenges are provided in Section 2.5, followed by concluding remarks.
2.2 The trends of alarm system performance meas- urement
The fundamental step to achieve a good alarm system performance is to survey the existing alarm configuration, in other words, to collect data and benchmark the analysed system [2]. This involves the calculation of key performance indic- ators (KPIs) for the alarm system together with the assignment of target values, the reviews of alarm (and controller) configurations and the collection of operator feedback regarding past alarms and events [4]. However, the measurement of the performance of alarm systems and thus the measured and targeted KPIs are not universal as different approaches exist in the academia and the industry and the resulting metrics, together with the targeted values, differ not only between indus- trial sectors but between sites inside the sectors as well. It was no surprise that Goelet al. identified this as the key challenge in the performance measurement of alarm systems during their review of the challenges and opportunities of industrial alarm systems [10].
During the past few decades, several studies have been published on the meas- urement of alarm system performance. Just to mention a few now and leave the details for the latter part of the present chapter, several standards in alarm man- agement mention the topic: all three editions of the EEMUA-191 standard (1999 [7], 2007 [3] and 2014 [1]), the work of the Norwegian Petroleum Directorate [11], the NAMUR standard from 2003 [12], as well as the editions of ANSI/ISA-18.2 (2009 [13] and 2016 [14]), its supporting document, the ISA TR18.2.1-2018 [15], the API RP 1167 ([16] and [17]) and the IEC-626822014 from 2014 [8]. Regarding academic publications, a very early article focusing on the industrial perspective is proposed by Nochuret al. in 2001 [18]. Later, the well-known work of Hollifield
provided [2] a comprehensive guide to practical solutions in alarm management.
Moreover, in the recent years two review articles were published on this topic, one discussing the challenges and opportunities of alarm systems [10] and the other focusing on the main causes of alarm overloading [19]. Finally, several approaches are present in the literature for the graphical assessment of alarm systems as well [20].
A good bird’s eye view picture of the trends in alarm system performance mon- itoring can be obtained by the analysis of the number of academic and industrial publications on this topic. The middle bar chart of Figure 2.1 illustrates the num- ber of scholarly works (orange) and patents (blue) published annually. The data was collected from Lens.org with the search keywords, Alarm system performance in the engineering field, (Accessed: January 25, 2021). The total number of schol- arly works is naturally significantly higher than the number of patents in the topic, as not all research work leads to a successful industrial application. However, the trends actually also reveal a more interesting detail: as the number of published scholarly works is over its peak and turns into a decreasing trend in the recent years, the number of patents gained momentum with an increasing trend. This shift from academic research to industrial patents is a general trend in the case of technologies that turn from research into applied solution. However, the path to this increased industrial attention was paved by several unfortunate incidents fully or partly due to the faults of alarm management (top part of Figure 2.1) and the guidelines and standards published as an attempt to improve the safety of operations (below of the bar chart in Figure 2.1). The bottom of the figure illustrates a specific change in the field, the evolution of the average number of alarms/time unit type of measures, where the time unit used for the standardiza- tion of alarm numbers undergone a change from 10 minutes to first an hour, and later a day-based norm. Recently the monitoring of this daily average alarm rate is removed from the recommendations. The reason for this change is going to be discussed in detail in Section 2.3.2. The incidents and guidelines were adapted and re-edited from [21].
Regarding the topic of academic publications, a systematic examination of the literature of the chemical engineering domain in the Scopus database was carried out with the search term "alarm system performance". Moreover, as a significant amount of articles discussed the topic of blood insulin level related alarms, the articles containing the "blood" word were excluded from the results to narrow
Figure 2.1: The research of alarm system performance more and more turns to industrial applications as the number of academic works published annually seems to be over its peak, giving space to the increasing number of patents in the field. However, this trend is noted by several unfortunate incidents fully or partly due to the faults of alarm management (top) and the guidelines and standards published as a result (below of the bar chart). The bottom of the figure illustrates a specific change in the field, the evolution of the average number of
alarms/time unit type of measures.
down the topic to the chemical process control systems (search term: (alarm AND system AND performance) AND NOT (blood), Chemical engineering domain).
Figure 2.2 illustrates the co-occurrences of the article keywords in the Scopus database. Two keywords are connected in the network if they co-occur among the keywords of the articles at least four times. The different colours indicate the different clusters in the network, which can indicate the major topics of alarm system performance related publications: hazards/safety (blue), human factors (yellow), performance monitoring (red) and fault detection (green).
According to the guidelines of the EEMUA [7], the performance measures of an alarm system can be used:
• as performance targets for acceptability criteria of a new alarm system,
• to assess the performance of an existing alarm system,
Figure2.2:Theco-occurrenceofkeywordsintheScopusdatabaseforthesearchterm"alarmsystemperformance"limitedtothe chemicalengineeringdomainexcludingthe"blood"word.Twokeywordsareconnectedinthenetworkiftheyco-occuratleastfour times.(Accessed:January06,2021)
• as management tools to monitor the effectiveness of on-going improvement programs, and
• to identify specific nuisance alarms.
As it is apparent in the previous list of applications, the literature views the per- formance of an alarm system from different perspectives and hence, measure its efficiency with varying goals. This diversity motivated the present work, aiming to classify the different approaches of alarm system performance performance meas- urement into seven groups, which are related to the different tasks or applications of an alarm system.
Operational problems with the often used univariate data-based alarm strategies has been well-known for a long time [22]. As it was stated by Hollifield and Habibi [2], the measurement of the direct contribution of alarm management im- provements to the plant-based performance indicators is problematic, as there are numerous other factors tightly related to the performance of a chemical plant, e.g., the maintenance of the plant, its control system or the operator performance, among others. The effect of a well-functioning alarm system is more to be traced through the prevention and minimization of the impact of operational anomalies than through direct production improvement. Moreover, as in the present day control systems, complete automation is still a challenge in the chemical industry, and the process operator’s increased ability to reduce the consequences of plant an- omalies becomes the key element of a sound alarm system. While we have known for a long time "..that both objective and subjective measurements determine the performance level. Numbers alone do not; we engineers tend to focus on numbers!"
[2], little has changed in the field of alarm system performance measurement to fully recognize this shortcoming.
This complex picture and the challenges associated with the direct measurement of alarm system performance constitute the key reasons why research in this area could not truly engage the industry and fell short of offering fundamental monit- oring solutions. As a result, the industrial professionals face alone the problems of constantly improving and re-investigating the performance of alarm systems with the guidelines provided by industrial standards. The available performance indicators and solutions together with their target values are highly industry and case-specific, which makes the tasks of alarm management hard-to-automatise and extremely labor-intensive by the experts in the field.
2.3 Measurement of alarm system performance
This section introduces the key starting point of the present chapter, namely, the different approaches to the measurement of alarm system performance. There are various solutions available for the categorization of alarm system performance metrics, and the main directives are the following:
• The EEMUA standard identifies performance and design metrics, basically referring to alarm activation based metrics and the metrics describing the efforts to produce an alarm system capable of achieving the performance metrics in the other category [1]. These metrics are often referred to as dynamic (or activation) and static (or configuration) metrics, respectively, as well [23, 24]. Koene and Vedam [25] also divide the performance metrics of alarm systems to two categories, the static (or configuration) based metrics and the dynamic ones.
• The ANSI/ISA-18.2-2009 standard basically defines the same categories, however, approaches them from the type of data being evaluated: the first category deals with the alarm records (alarms produced during the opera- tion), while the second category comprises the alarm attribute-based eval- uation of a system (describing the underlying structure of alarm messages) [14].
• Another categorization of alarm performance metrics is the definition of the objective (quantitative) and subjective (qualitative) group of metrics [26].
The quantitative metrics can be calculated by algorithms and query tools based on the data recorded in the alarm & event log databases, whereas in the case of qualitative metrics, other factors,e.g., operator workload, experience, environment and other areas that are difficult to assess are considered.
The shortfall of such generic metrics, however, is that they strongly vary between process plants, and they are influenced heavily by the complexity of the process itself and the level of the plant automation and instrumentation [25].
In the present chapter, a new categorization is offered, using seven groups dis- tinguished by the aspects that the examination of the performance of the alarm system is based on: Load-based metrics (Section 2.3.2), Diagnostic metrics (Sec- tion 2.3.3), Deployment metrics (Section 2.3.4), Scaling metrics (Section 2.3.5),
Audit metrics (Section 2.3.6), Design metrics (Section 2.3.7), and finally the Op- erator’s perspective (Section 2.3.8). In the following subsections, each of these categories is introduced and discussed, and examples of the related metrics are provided.
2.3.1 Alarm attributes
The first task for the measurement of alarm system performance is the determin- ation of what can be measured. Naturally, the performance of an alarm system can be most evidently captured using the attributes of an alarm message, let it be the timestamp of its occurrence, its priority, temporal length, etc. In this section, a brief overview of alarm attributes is provided, or rather, characteristics that can be assigned to an alarm message similar to [27]. Various attributes are directly assigned to alarm messages in industrial alarm systems and several more attrib- utes or characteristics can be derived from the information systems related to the operation, e.g., process layouts, process control systems, shift schedules and hu- man resource databases, etc. Table 2.1 provides an overview of the most generally accepted alarm attributes that are often present in processing industries. As can be seen in the first column, the different data sources are divided by horizontal lines in the table. However, it is important to highlight that every industrial database is unique, therefore Table 2.1 only aims to provide a general picture of information content for alarm systems and the specific definition of the source of the information or its data format is only for illustration purposes.
The first group of attributes is often stored in the Alarm & Event Log database and contains the information closely related to the message presented to or performed by the operator in the case of an alarm event. Naturally, an alarm has a tag or tag ID, a unique identifier of the alarm message. The units of the alarmed variable indicate the unit of measure of the process variable, while thealarm type or interval identifier of the alarm attribute provides information on the level of the process variable related to the assigned alarm thresholds. Besides the presence of low (L) and high (H) alarms, several other levels can be defined, in most of the cases the more severe alarms are indicated as low-low (LL) or high-high ones (HH), but these definitions are often arbitrary. In support of the operator work, a briefdescription of the problem is provided as well. The actual alarm threshold set by the operators is also present in the database. The event type describes
Source Alarm attribute Example
Alarm&EventLogdatabase
Tag 43TI2085, LIG502,
Units ◦C, %, m3, -
Alarm type LL, L, H, HH
Alarm threshold (actual) 12, 0.4
Start time 2021-06-26T14:30:59+00:00
(timestamp)
End time 2021-06-26T15:10:22+00:00
(timestamp)
Description PV2085 temperature, T502 level
Event type Alarm, Return to normal, Acknow-
ledge, Operator action, Operator mes- sage, Ignore, Suppress, Unsuppress, Shelved, UnShelved
Priority Low, emergency, high, normal, journal
Suppressed Binary, 1 - 0
Shelved Binary, 1 - 0
From value Unit/state based
To value Unit/state based
MasterAlarmDatabase
Alarm threshold (master) 10, 0.5
Consequence of deviation Pump cavitation, Tank overflow, Pres- sure drop
Consequence category Equipment, safety, environmental Corrective action Stop pump, Close inlet valve, Bypass
inlet flow Allowable response time 0.5 min, 4 min
Basis Pump cavitation at 2%, tank overflow
at 107%
Retention period 1 year, 5 years
Report requirements Pump report, Safety report, Environ- mental report
Notification requirements None, Environmental/Safety coordin- ator
Process Layout Hierarchical classification
Production unit
Coker, Absorber, Distillation Unit Furnace, Pump, Column
Controller Outlet pressure, inlet temperature Table 2.1: The different attributes and available information for an alarm
message.
what happened in the related event with the specific tag: alarmed, returned to normal, was acknowledged by an operator, an operator action was performed or the alarm was suppressed or shelved. An important indicator of a well designed alarm system is the distribution of the different alarm priorities indicating the severity of the event to the operators. Suppressing an alarm refers to any mechanism to prevent the indication of the alarm to the operator when the base alarm condition is present [14]. For example, an alarm that is caused by another alarm that is already handled can be suppressed. Shelving an alarm temporally suppresses it for a specific duration of time, and this action is usually performed by the operator.
The alarm is automatically unshelved when the duration runs out. The suppressed and shelved alarms are not raised for the operators, however, they are listed in the alarm and event summaries. The suppressing and shelving of alarm messages can be indicated by various data formats: by binary variables indicating the shelved or suppressed alarms, or by the timestamp of the start and end times or by a state indicator, which indicates whether the alarm is in an active, suppressed, shelved, or another state. In the case of alarm threshold modification, the ’from’ and ’to’
values can also be recorded.
The second group of attributes contains the original definition and implementa- tion logic of the alarm message. This information is usually stored in the alarm philosophy documents, the alarm definitions of the master alarm database and the deployment descriptions. These attributes are often not displayed to the operators during the production as they are either aware of this information or it would only unjustifiably increase their information load. As such, the originalalarm threshold of the master database is not displayed directly to the operator together with the alarm message, as only the actual threshold setting is relevant during the current situation. Moreover, in the case of a well-established and rationalized alarm mes- sage, the existence of the alarm message is well-proven, therefore, its consequence and its consequence category, corrective action, the response time for the correct- ive action and a brief explanation of thebasis of alarm message is provided in the documentation of the alarm system. Thenotification and report requirements can also be defined.
The third category of alarm message attributes describes the place of alarmed variable within the process, which is important for the monitoring of the spillover effects of malfunctions [28]. Several hierarchical decomposition structures can be defined for chemical processes, following the guidelines of the ISA-95 standard [29].
The application of the following hierarchical levels is recommended (enumerated in top-down order): enterprise, site, area, production unit, unit, and the level of sensors and actuators (although the standard focuses on the first four levels).
Therefore, if an alarm is raised, its origin can be defined hierarchically: the pro- duction units (such us columns, reactors, separators, etc.) are composed of units (furnaces, pumps,etc.). At the bottom level of the presented hierarchy, the sources of event signals are presented, i.e., the sensors and actuators.
2.3.2 Load-based metrics
In industrial environments, the group of load-based metrics is most likely referred to as the measurement of alarm system performance, as these measures are mainly monitored and targeted by the operations. These metrics usually do not provide any insight to the problems of an alarm system, as their aim is to provide a general, bird’s eye view of whether the alarm system is overloaded or functioning in a manageable or predictive intensity. Another characteristic feature of these measures is that they may not identify any specific problems regarding the location, cause or origin of the problems of an alarm system, either.
Univariate alarm system load
Theload-based metrics are based on the event occurrences recorded in the Alarm &
Event Log database of the system. According to the recommendations, in general, at least 30 days of alarm data is required for calculating most of the metrics presented in this subsection [14]. The calculated alarm loads are normalized to different time units (10 minutes, hours, days, etc.) providing an alarm occurrence frequency-base of measure. The following are the typical metrics in this category:
• Average alarms per time unit and per operator position
• Percentage/number of stale alarms
• Peak (maximum number of) alarms per time unit
• Distribution of activated alarm priority in the specific temporal period
• Percentage of time units containing more than a defined number of alarms, usually a special case is considered when the threshold on the number of
alarms is set to the same number above which an alarm flood is defined on the system
• Percent of time the system is in a flood condition
There are two tables that cannot be left out from any work discussing the per- formance metrics of industrial alarm systems. These popular tables compare the performance of an alarm system to the recommendations of the guidelines using the general, alarm log based performance metrics. The alarm system performance recommendations of the ANSI/ISA-18.2 standard, which are used as a reference in many works is presented in Table 2.2. As can be seen in the similarly popular comparison of the alarm management performance of different industrial sectors presented in Table 2.3, these metrics are far from the state of the industry (Table 2.3 is adapted from [23] and the presented data is extended with the metrics of [14]). The significant underachievement of performance targets is also reinforced by the work of Kim VanCamp [9].
An evolutionary trend is indicated by the red-highlighted rows in Table 2.2, as these performance indicators have been deleted from the recommendations between the 2009 [13] and 2016 [14] versions of the standard. The deletion of the authoriz- ation related metrics, namely the "Unauthorized Alarm Suppression" and "Unau- thorized Alarm Attribute Changes" performance indicators, is simply due to the new approach that the monitoring of the unauthorized actions should be a separ- ate process from alarm system performance assessment. This can be understood as some of the unauthorized suppression methods cannot be detected algorithmic- ally (cutting wires or silencing a horn) [30] and the alarm authorization has been removed from the monitored KPIs of alarm management. However, for the sake of completeness, these metrics are discussed in Section 2.3.6.
The details of the road leading to the deletion of the "average alarm number per time unit" type of performance metrics for hours and days are illustrated in the bottom timeline of Figure 2.1. The original recommendation of 1 alarm/10 minutes by the Bransby & Jenkinson survey [31] aimed for the maintenance of a well-distributed alarm load on the operators. However, this metric was quickly turned to 6 alarms/hour, which was upscaled to 150 or 144 alarms/day around 2010. However, in 2016, the monitoring of the daily alarm numbers was deleted and the standards returned to the 10-minute and hour-based metrics. The reason was simple: the human operators cannot maintain an increased performance for a
MetricTargetvalue AnnunciatedAlarmsperTimeTargetValue:VeryLikelytobeAccept.TargetValue:Maximum Manageable AnnunciatedAlarmsperDayperOperating Position∼150alarmsperday∼300alarmsperday AnnunciatedAlarmsperHourperOperating Position∼6(average)∼12(average) AnnunciatedAlarmsPer10MinutesperOp- eratingPosition∼1(average)∼2(average) MetricTargetValue Percentageofhourscontainingmorethan30 alarms∼<1% Percentageof10-minuteperiodscontaining morethan10alarms∼<1% Maximumnumberofalarmsina10-minute period≤10 Percentageoftimethealarmsystemisina floodcondition∼<1% Percentagecontributionofthetop10most frequentalarmstotheoverallalarmflood∼<1%to5%maximum,withactionplanstoaddressdeficiencies QuantityofchatteringandfleetingalarmsZero,actionplanstocorrectanythatoccur. StalealarmsLessthan5percentonanyday,withactionplanstoaddress AnnunciatedPriorityDistribution
3priorities:∼80%Low,∼15%Medium,∼5%Highor 4priorities:∼80%Low,∼15%Medium,∼5%High,∼<1%‘highest’ Otherspecial-purposeprioritiesexcludedfromthecalculation UnauthorizedAlarmSuppressionZeroalarmssuppressedoutsideofcontrolledorapprovedmethodologies UnauthorizedAlarmAttributeChangesZeroalarmattributechangesoutsideofapprovedmethodologiesorMOC Table2.2:Therecommendedalarmperformancemetricsin[14]).Theredrowshavebeenremovedfromtherecommendationsbetween 2009[13]and2016[14]versionsofthestandard.
EEMUA191ANSI/ISA18.2Oil&GasPetrochemicalPowerOther Averagealarmsperday144150120015002000900 Averagestandingalarms95perday501006535 Peakalarmsper10minutes1010220180350180 Averagealarms/10-minuteinterval116985 Distribution%(Low/Med/High)80/15/580/15/525/40/3525/40/3525/40/3525/40/35 Table2.3:Cross-industrycomparisonofalarmactivationnumbers(adaptedfrom[23]andextendedwiththemetricsof[14]).
longer time period. For comparison, consider the following analogy: The current world record holder of 100 m run (as of 2021), Usain Bolt, could run 100 meters in 9.58 sec in 2012, but it is clear that no sprinter can maintain this speed for longer time periods, as this would mean 100 secs for 1000 meters or a little bit more than an hour for a marathon (67.37 minutes). By comparison, the current official world record for marathon running is 2:01:39, held by Eliud Kipchoge (unofficially, he could already break the two-hour barrier). Similarly, a well-trained and good-performing operator is able to express a superhuman-like performance and attention for a short period of time in the case of a serious malfunction, but cannot maintain this performance for a longer time period. This is a significant problem as the worker fatigue costs $77-$155 billion per year to U.S. companies due to increased health costs, production loss and damage due to accidents [32].
Based on the above logic, one can ask what a reasonable time unit should be. The answer is an expected one in the process industries: it depends on the process.
For a new alarm system, the time required for an alarm to be handled needs to be estimated (e.g., based on the expected rate of change of the process variable).
As in the case of a new alarm system, every alarm should have a specific response from the operator, which necessitates the estimation of the average response time for all configured alarms in the system. This way, the operators will have enough time to acknowledge every alarm message properly and the optimal value of this metric should be 1 alarm/average response time/operator. If this target value of 1 is significantly exceeded, then the process is clearly not in a well-operated and safe state. In the case of an existing alarm system, the average time when an alarm is active can be estimated. This would be the time limit for an alarm message to be acknowledged or responded by a specific operator action and it should be used for the calculation of an informative performance metric. However, the calculation of an average time for operator response holds some practical problems: there should be no alarm message disappearing without being acknowledged or being acknowledged after the variable has returned to normal. Similarly, there should be no alarm acknowledged but not returned to normal over the time period chosen for the calculations. Therefore, there should be no stale, chattering or fleeting alarms during the calculations, which leads to a significant practical calculation problem, requiring a systematic and careful cleaning of the data. Another pro- cess specific question that we need to consider during the determination of the informative unit is the tasks of the operator outside of taking operator actions on the human machine interface. If the operators working in front of their operator
console need to rely on the work of other operators or communicate with the field operators to perform some specific tasks, the tasks handled by the operator can increase significantly (or the other operators can provide support as well) and this should be also incorporated in the calculations. These logics are well explained and documented in [30].
Multivariate performance metrics
Based on the above discussion, one aspect is clear, regardless of the choice of time unit, the average alarm rate does not provide an overall summary of the performance of the alarm system and certainly not support the problem diagnosis:
if low, then the alarm system is probably good; however, if it is high, we need to know more about the system. A high alarm rate can simply indicate the presence of a process upset and in this case the analysed alarm system just performs its task, yet this can also indicate a highly under-performing system. This leads us to the discussion of multivariate alarm load-based performance measure of alarm systems, that are gaining more and more emphasis in recent years.
EEMUA 191 addresses the monitoring of the average alarm rate per 10 minutes in steady-state operation and the maximum number of alarms in a 10-minute period per day in upset conditions, averaging these metrics over a month of operation.
Here again, several approaches are present with several categories and thresholds defined, but the general picture is presented in Figure 2.3. The two performance metrics used for monitoring are usually the average and the maximum alarm rates per time unit per operator and based on their respective values, categories as overloaded, reactive, stable, robust and predictive (in the order of increasing per- formance) are defined. The region where the average alarm rate is higher than the maximum alarm rate is of course impossible to reach. Similar charts are defined in the second and third editions of the guidelines of the EEMUA [3, 1], but different versions of similar performance evaluation charts are present in different processes.
Hu et al. introduced how these multivariate plots can be extended to three vari- ables by pointing out the number of unique alarms in the related temporal period on a bubble chart [27]. As discussed in [33], the improvement of an alarm system over time is well-traceable in these charts.
While a highly intuitive metric of the alarm load-based performance measurement would be the economic analysis of alarm systems, this is a highly sensitive and problematic question and a separate section is devoted to it in Section 2.5.
Figure 2.3: The multivariate monitoring of alarm system performance
2.3.3 Diagnostic metrics
Thediagnostic metrics of an alarm system are aimed at the identification of specific problems on specific alarms. These metrics are usually monitored by the owner of the alarm system or the personnel responsible to take actions for its maintenance or efficiency improvement. The various combination of the measures from the performance and diagnostic metrics form the basis of the most often monitored metrics in industrial plants and usually the construction of alarm management reports, dashboards and KPIs are based on them.
Some commonly used metrics are the following:
• Listing and quantity of the most frequent alarms (Top N bad actors)
• Listing and quantity of chattering alarms
• Listing of stale alarms
• Listing of shelved alarms, possibly with shelving duration
• Listing of out-of-service alarms, possibly with durations
• Listing of potentially redundant alarms shown by analysis
Top N bad actors
A majority of alarms are usually generated by a small number of process variables known as bad actors. According to the literature, a bad actor is "an alarm that is suspect and cannot be relied upon to deliver accurate information to the operator, such as stale, chattering, duplicate or suppressed alarms" [34]. In practice, by bad actors, the most frequent alarms in the Alarm & Event log database are referred, which are responsible for the bulk of the alarm load. According to the ISA- 18.2 standard [13], "Relatively few individual alarms (e.g., 10 to 20 alarms) often produce a large percentage of the total alarm system load (e.g., 20 % to 80 %). The most frequent alarms should be reviewed at regular intervals (e.g., daily, weekly, or monthly). Substantial performance improvement can be made by addressing the most frequent alarms". This Pareto-like, 80-20 rule of distribution that 20 % or less of alarm variables are responsible for the 80 % or more alarms is common, extreme cases where only one variable contributes to more than 50 % of the total alarm load are known [35]. In other cases, the top 5 bad actors contributed to 87 % [36], or the top 10 bad actors contributed to more than 75 % of the total number of annunciated alarm messages [37]. Numbers like this are not considered outliers based on our experience as well. Therefore, the monitoring of the top 10 most frequent alarms is strongly recommended by alarm standards, and they should not contribute to more than 5 % of the total alarm load (no bad actors are acceptable) [35]. Usually, top (5-)10 alarms are monitored regularly on bar plots indicating their number and a line plot is applied to show their cumulative proportional contribution to the overall alarm number [37], but their temporal comparison is common as well [27]. Thanks to their practical importance and good problem-solving efficiency, several frameworks incorporate their usage [35, 38, 21].
Chatter index
Less informative alarms, namely nuisance or constant ones, significantly increase the operator workload by nonactionable distractions. The most common form of nuisance alarms are the chattering ones, which do not sound for a sufficient time to allow the operators to perform corrective actions and in critical plant conditions can significantly hinder the work of the operators. In a properly rationalized and designed alarm system, after the elimination of nuisance (chattering) alarms, the resultant alarm rate reflects the ability of the control system to keep the operation
in the normal operating zone without operator interactions [14]. The chattering alarms are essentially in conflict with the philosophy that each alarm should be actionable. Hollifield et al. claim that chattering alarms are the most common type of alarm, constituting about 70% of all alarms [2]. Similarly, constantly sounding alarms are also harmful to the quality of the alarm data. In an industrial environment, these long-standing alarms are ignored by the operators either as a result of their uninformativeness, or the fact that they are hidden from the operators as shelved or forbidden alarms (these alarms are usually still present in historical datasets). Different approaches are present for the detection of the presence of a chattering alarm, for example the balance between the actions taken by the operator and occurrences of alarms [39], but the most well-known and commonly used approach is the application of the chatter index introduced by Kondaveeti et al. [40], [41]. Various studies applying the chatter index in alarm management are summarized in the following list:
• Kondaveetiet al. introduced the chatter index for the quantification of alarm chatter [40]
• Wang and Chen developed an online method for the detection and reduction of chattering alarms due to oscillations [42]
• The improvement of the alarm system of an industrial power plant case study [36]
• Plotting the Chatter Index over one week’s period for top 50 alarms [43]
• Sun et al. reduces the number of chattering alarms via median filters [44]
• The application of the chatter index for the alarm system improvement in a Combined-Cycle Gas Turbine Power Plant [45]
• The design of alarm deadbands for the reduction of false and missed alarms and alarm chattering [46]
• In our previous work, we applied the chatter index to prefilter the alarm and event log database before sequence mining [28]
• Naghoosi et al. developed a method to estimate the chatter index based on statistical properties of the process variable as well as alarm parameters [47]
The calculation of the chatter index is discussed in Section 9.3.
2.3.4 Deployment metrics
The deployment metrics describe the progress of the implementation or modific- ation tasks on an alarm system. Therefore, these metrics are only interesting during deployment and monitored and targeted by the alarm system owner and personnel responsible to measure the progress. A few examples for the most often used deployment metrics of alarm systems are:
• Percent of alarms rationalized
• Percent of alarms monitored
• Priority distribution of rationalized alarms.
2.3.5 Scaling metrics
The scaling metrics are usually not used for the direct measurement of the alarm system performance but to obtain a scaled and comparative measure by scaling other metrics to a unit base. These metrics are not directly used or reported, but are used in reporting other metrics. The unit base can be obtained by scaling to various units depending on the aim of comparison: time unit, control loops, number of operators, plant-based counts, etc., can be derived.
2.3.6 Audit metrics
From a certain viewpoint, the audit metrics are not in line with alarm system performance metrics, as the scope of data audits, despite being present for decades, has been removed from the tasks of alarm management by the latest ANSI/ISA- 18.2 standard in 2016 [14]. In order to respect the traditions and for the sake of completeness, I briefly recall the aim of these measures. The audit metrics simply describe the amount of data that has been (or missed to be) audited. Two simple examples are the "number and nature of unauthorized changes" and the
"number and nature of unauthorized alarm suppression". However, as the process of authorization can be considered a technical or rather system administration question from the view point of alarm management, it was removed from the list of measures strictly focusing on the performance of alarm management tasks.
2.3.7 Design metrics
The design metrics are the measures aiming for the determination of the alarm thresholds optimal from a certain point of view. Although they serve a practical purpose, these measures are primarily utilized by the academia as an indicator of how well the designed alarm thresholds are appropriate for specific tasks providing a clear choice of the cost function of optimization tasks. They can be formulated for the characterization of a certain alarm level or the whole analysed alarm system as well.
The most often used design metrics of alarm systems are:
• False Alarm Rate (FAR)
• Missed Alarm Rate (MAR)
• Average Alarm Delay (AAD)
• Receiver operating characteristic (ROC) curve
• Fault detection rate (FDR)
In order to get a deeper insight into the task of alarm threshold design, the fun- damental practical problems of the design of a perfect (univariate) alarm message is to be considered. First, as presented in Figure 2.4, industrial processes and the measurement (measurement noise) of process variables are subject to uncertainty.
The process variables are scattered over the mean value of the specific state and these distributions usually overlap with each other. As a result, the determination of a perfect alarm threshold for the separation of normal and faulty operation may not be feasible in most cases. Even if we statistically improve the accuracy of the measurement, the faultless and the faulty operation may not be distinguish- able by a single measurement. The more permissive the chosen threshold is the more missed alarms we get during the operation. On the contrary, the stricter thresholds generate an increased false alarm rate. This is indicated on the right side of Figure 2.4.
Considering the performance of not a single alarm message but the system of mul- tiple alarm messages, the problem of connected/correlated alarm variables arises as depicted in Figure 2.5. As the variables monitored by the alarm messages
Figure 2.4: The problem of measurement and process uncertainty is to be considered during alarm design: the faultless and faulty operations may not be
distinguishable by a single measurement.
are usually connected by the underlying physical properties of the system, the shape of the optimal operational area most likely cannot be delimited by univari- ate thresholds. Therefore, not just the uncertainty of process variables, but the inaccurate delimitation of the optimal operating range also poses a problem. The accuracy of the detection of process abnormalities is further complicated by the speed of determination.
Figure 2.5: The problem of connected variables and the application of uni- variate alarm design.
Motivated by the above mentioned problems, a trade-off between the accuracy and speed of the determination of process malfunctions is drawn. The primary metrics used here are the false alarm rate (FAR) and missed alarm rate (MAR) and the average alarm delay (AAD) [48]. For the formal description of these