in clustering Babakoohi Anticline joints north of Shiraz, Iran
HAJAR KAZEMI
1,2, KOUROS YAZDJERDI
2p,
ABDOLMAJID ASADI
2and MOHAMMAD REZA MOZAFARI
31Department of Geology, Fars Science and Research Branch, Islamic Azad University, Fars, Iran
2Department of Geology, Shiraz Branch, Islamic Azad University, Shiraz, Iran
3Department of Mathematics, Shiraz Branch, Islamic Azad University, Shiraz, Iran
Received: September 10, 2018 • Accepted: March 18, 2020 Published online: August 27, 2020
ABSTRACT
The fuzzy clustering technique is one of the ways of organizing data that presents special patterns using algorithms and based on the similarity level of data. In this study, in order to cluster the resulting data from the Babakoohi Anticline joints, located north of Shiraz, K-means and genetic algorithms are applied. The K-means algorithm is one of the clustering algorithms easily implemented and of fast performance; however, sometimes this algorithm is located in the local optimal trap and cannot respond with an optimal answer, due to the sensitivity of this algorithm to the centers of the primary cluster. In addition, it has some basic disadvantages, such as its inappropriateness for complicated forms and also the dependency of the final result upon the primary cluster. Therefore, in order to perform the study more accurately and to obtain more reliable results, the genetic algorithm is used for categorizing the data of joints of the studied area. Applying this algorithm for leaving the local optimal points is an effective way. The results of clustering of the aforementioned data using the two above techniques represent two clusters in the Babakoohi Anticline. Furthermore, for validity and surveying of the results of the suggested techniques, various mathematical and statistical techniques, including ICC, Vw, VMPC, and VPMBF, are applied, which supports the similarity of the obtained results and the data clustering process in two algorithms.
KEYWORDS
Babakoohi, fuzzy clustering, genetic algorithm
INTRODUCTION
Clustering is considered to be one of the most ideal mechanisms for working with vast amounts of data; it aims to provide patterns that are extracted from the data and make decisions based on those patterns (Anthony and desJardins 2006). In fact, clustering is the process of dividing a data set or sample into a bunch of K groups or clusters based on their similarity or dissimilarity (Yaghini et al. 2012). This technique is a statistical method, in which similar groups or clusters are separated from each other, based on one or more specific attributes; each object in a cluster is similar to the other objects of the group and dissimilar to the objects of the other group. The main objective of the clustering procedure, in the words of Kowalski (2007), is to present the user with a visual representation of the document space limited by the search criteria, ultimately resulting in better data organization, and to help determine the precise location of the information. Practically, clustering optimizes the pro- cess of information search and reduces the user’s search time. Furthermore, by use of clustering, a group of similar topics falls within a single classification and is organized by a general title. This is highly influential in accessing the information related to the considered
Central European Geology
63 (2020) 1, 38–48 DOI:
10.1556/24.2020.00004
© 2020 The Author(s)
ORIGINAL ARTICLE
*Corresponding author.
E-mail:kyazd@yahoo.com
topic. It also results in favorable access to topic-shared data.
Ultimately, it can be said that the nature of clustering analysis is unsupervised classification. Basically, data or observations are divided into homogeneous and distinct categories through the cluster analysis.
The idea of cluster studies was introduced in the 1930s for the first time and nowadays has a special place in various fields such as engineering, medicine, social sciences and marketing, due to its huge advancements and improve- ments. Thus, this idea has been discussed in various geologic trends including sedimentology, tectonics, geochemistry, and so on. Despite the passing of more than 40 years of studying this subject, there are still many challenges in the clustering process, both from theoretical and practical points of view (Jain and Law 2005). Clustering comes in two types:
classic and fuzzy. In the classic clustering, each input sample belongs to one and only one cluster, and cannot be a member of two clusters or more, while in a fuzzy cluster, it can. Using fuzzy preferences provides the opportunity of more flexibly dealing with the belonging or non-belonging of a data point to a section, so that this paves the way for the results of clustering to get closer to real-world issues. In fact, in fuzzy clustering a fuzzy segregation occurs. That is, each data point with its degree of belonging can belong to any cluster. In real conditions, fuzzy clustering works more naturally than classic clustering, since the data in the borderline of different clusters do not have to fully belong to a single cluster. They will be segregated by a belonging de- gree of zero to 1, indicating their proportional belonging.
Various clustering techniques dealing with the orienta- tion of structures such as fractures have been investigated from the 1970s on by civil engineer researchers, including Wallbrecher (1978),Hammah and Curran (1998),Peel et al.
(2001), Marcotte and Henry (2002), Klose et al. (2005), Jimenez-Rodriguez and Sitar (2006). Later on, geo- technicians and geologists likeBaer et al. (1994), Jolly and Sanderson (1997),Peel et al. (2001),Whitaker and Engelder (2005), Ahmadhadi et al. (2008), Yamaji et al. (2010), Yamaji and Sato (2011),Bigi et al. (2013),Andre and Milen (2014), Yamaji (2016b), and Shahamiri et al. (2017), have specifically and systematically studied structures such as joints, dikes and mineral veins. Clustering is also important for understanding brittle tectonics (Yamaji and Sato 2011), so that the paleostress orientation can be determined by the classification of microcracks (Lespinasse and Pecher 1986;
Kowallis et al. 1987) or joints and faults (Shahamiri et al.
2017;Takhur et al. 2017; Whitaker and Engelder 2005). In addition, the orientation of dikes, mineral veins, and their classification is used for determining paleostress during the formation of a dike or vein (Baer et al. 1994; Jolly and Sanderson 1997; Yamaji et al. 2010;Yamaji and Sato 2011;
Yamaji 2016b). Fracture orientation clustering can also be useful for determining multiphase tectonics (Yamaji et al.
2010).
Joints are the most abundant and, at the same time, the most complex tectonic structures in terms of different di- mensions, measurements, and orientations, which have not been investigated accurately and widely. There are two main
reasons of the slow progress in this field: a) The relatively small number of studies and articles about joints, mainly due to the complex behavior of these structures; b) Lack of fa- miliarity on the part of geologists with the new methods of organizing information. In fact, joints are a kind of planar fracture which are formed in response to the stress in a region (Gudmundsson 2011).
Nowadays, improvements have been made in the field of joints using new statistical techniques and methods based on mathematics, physics and computer science (Hammah and Curran 1998; Marcotte and Henry 2002; Jimenez-Rodriguez and Sitar 2006; Yamaji et al. 2010; Yamaji and Sato 2011;
Ander and Milen 2014;Yamaji 2016a,2016b;Shahamiri et al.
2017). These methods, along with structural geologic methods, play an important role in their interpretation and perfor- mance. In the above methods, dip and dip direction are used mainly for clustering the joints. The studies and statistical analyses resulting from the data concerning joint orientation of a region can be used in the construction of engineering structures (tunnels, bridges, dams and roads), in finding mineralization sources, surface water and groundwaterflow, and also the stress situation of an area (Shahamiri et al. 2017);
therefore, it is essential to divide and classify the joints sta- tistically along with the structural investigation (Yamaji and Sato 2011). In structural methods, joint studies are generally carried out based on rose diagrams and stereonets, which lead to more precise results if these structural methods are com- bined with statistical techniques and methods.
To carry out optimal clustering, the appropriate algo- rithms should be used. In this regard the algorithms help us to obtain optimized clustering using formulated and orga- nized solutions. So far, many algorithms have been intro- duced in this area, with some advantages and disadvantages.
In this article, in order to distinguish and classify the Babakoohi Anticline’s joints, located to the north of the city of Shiraz (Fig. 1), two methods of K-means and genetic al- gorithms are used for clustering the relevant data, which are considered originally a component of fuzzy clustering methods (Hammah and Curran 1998; Jimenez-Rodriguez and Sitar 2006). The applied theory in fuzzy clustering analysis concentrates on the fuzzy relations and target functions. Since the prototypes are selected accidentally in the K-means algorithm, the algorithm may be located in the local optimal trap and cannot produce an optimal answer.
Therefore, in order to exit the local optimal situation, and considering the advantages of the genetic algorithm in comparison with the K-means algorithm, a better and more reliable answer can be obtained. In this paper, validation indices have also been used to verify the validity of the number of clusters, which aim tofind the most appropriate clusters for the intended data.
GEOLOGIC SETTING
The Babakoohi Anticline in Fars province, north of Shiraz, is part of the Zagros orogenic belt. This orogenic belt has a northwest-southeast trend and a length of about 1,800 km in
a folded sedimentary basin, which is the result of the convergence of the Afro-Arabia and Eurasian continents in the Late Cretaceous and is still active (Stocklin 1974; Ber- berian and King 1981; Alavi 2004; Sarkarinejad and Azizi 2008;Agard et al. 2011;Pireh et al. 2015;Ajirlu et al. 2016;
Sarkarinejad and Heibati 2016). This orogenic belt spreads from the east of Turkey to the north of Iraq and the northwest of Iran to the islands of Hormuz and Oman (Alavi 1994; MacQuarrie 2004; Homke et al. 2010; Agard et al. 2011;Ajirlu et al. 2016). Based on tectonostratigraphic divisions, this orogenic belt includes the following areas, respectively, from southwest to northeast (Alavi 2007; Sar- karinejad and Azizi 2008; Sarkarinejad and Ghanbarian 2014; Sarkarinejad and Heibati 2016): 1) Zagros Fold Belt (ZFB) or Simple Fold Belt; 2) Zagros Fold and Thrust Belt (ZFTB) or High Zagros; 3) Zagros Suture/Ophiolite Zone; 4) Sanandaj–Sirjan HP–LT Metamorphic Belt; 5) Sanandaj–
Sirjan HT–LP Metamorphic Belt; and 6) Urmia–Dokhtar Magmatic Belt. According to this classification, the studied
area is located in the Zagros Folded Thrust Belt (ZFTB;
Fig. 1a).
The Babakoohi Anticline, with a general trend from northwest to southeast and 258northwest and more than 20 km in length, is considered as the north wall of Shiraz. The Jahrom Formation forms the core of the anticline and the Asmari Formation forms the northern margins in the north, south, and northwest plunge of this mountain (Fig. 1b).
The “Akbarabad”, “Abrishami”, “Posht-e-Mole” and
“Quran Gate” faults are the main faults, and normal faults are scattered in the region (Fig. 1b). The Abrishami Fault has affected the southwest hillside of the Babakoohi Anticline.
This longitudinal fault, with thrust mechanism and dip di- rection to the northeast, has led to the reversal of the layers of the Jahrom and Asmari Formations in this section. Also, due to the activation of this fault at the anticline peak, normal faults have been generated due to stretching. Ac- cording to the magnetometery basement map of the region, the magnetic disturbance in the northern margin of the Figure 1.a) Structural subdivision of the southwest of the Zagros Orogenic Belt, salt diapirs and ophiolites (Sarkarinejad and Heibati 2016);
b) geologic map of the Babakoohi Anticline and its position in the Zagros Orogenic Belt
Shiraz Plain indicates that the Abrishami Fault is a basement fault (Yousefiet al. 2001).
The Akbarabad Fault has affected the northern hillside of the Babakoohi Anticline; this fault is also in the group of longitudinal and thrust faults, with a dip direction toward the southwest. Severe changes in layer dip, the reversal of layers, morphological inelegances, fault scarps and the removal of parts of the northern edge of this anticline are its mechanism. The Posht-e-Mole Fault is also a transverse fault that runs northeast–southwest, having a sinistral and normal mechanism. The sinistral movement of this fault has resul- ted in the cutting off and falling of the eastern block of the fault at the footwall of the fault.
The Quran Gate Fault, set in a northeast–southeast di- rection, is situated in the Quran Gate region of Shiraz. The mechanism of this fault is dextral and normal. The existence of numerous fault breccia and dip walls on both sides in- dicates the fault structure of the Quran Gate Strait. The Babakoohi Anticline is cut by numerous transverse faults, especially on the southern edge; most of these faults are normal, which has resulted in local downthrown or slip movements. From the lithological point of view, the Jahrom Formation (Eja) makes up a large part of the Babakoohi Anticline (Fig. 1b) and consists mainly layers of yellow crystalline, brown and light gray to white limestone. The Asmari carbonate formation outcrops on the northern and
southern edges of the anticline. It should be noted that the facies similarities of the Jahrom and Asmari Formations are such that their separation is carried out based on detailed studies of petrology and paleontology, combined with field surveys and evidence. What is known is that the Asmari Formation in the region has a greater clay content than the Jahrom Formation, and thus shows a mild morphological state (Yousefiet al. 2001). Based on paleontological studies the age of these formations has been determined to range from Oligocene to Miocene (Yousefiet al. 2001).
The study of the Babakoohi Anticline’s joints, with the aim of evaluating clustering patterns, has been the main objective of this study.Figure 2a–drepresents the joints of the studied area.
METHODOLOGY
In order to distinguish and classify the Babakoohi Anticlines joints to the north of Shiraz, after field observations and recordings of joints’dip and strike using the linear method (Marshak and Mitra 1988), two genetic algorithms (evolu- tionary algorithms) and K-means have been used. These two algorithms are considered as the fuzzy clustering methods in the classification of the joints (Hammah and Curran 1998).
It is worth mentioning that in structural geologic methods,
Figure 2.Examples of the joints in the studied area based onfield observations
we use stereographic images and the poles as well as rose diagrams. By examining and interpreting these images, the tectonic condition of the area is determined based on the joints. In this case, the larger the number of joints, the more accurate is the result obtained. However, in stereographic images, there may be an overlap between the joints; these are usually ignored. In addition, using fuzzy clustering methods, we can separate the outlier and inaccurate data extensively.
In this paper we try to analyze the two methods and determine their advantages and disadvantages.
Fuzzy clustering K-means
The fuzzy clustering method of K-means (MacQueen 1967) is one of the most common and simplest partitioning methods for clustering (Han and Kamber 2001;Zalik 2008;
Jain 2010) that is widely used due to the ease of imple- mentation and high efficiency. In the K-means algorithm the number of clusters or K is predefined. In executing this al- gorithm, the k-sample is first selected as cluster centers.
Thereafter other samples are placed in one of the clusters, based on the least distance to the center of the clusters. In this way, we obtain k clusters, each containing some sam- ples. Then the average samples of each cluster are calculated and considered as new centers of that cluster, and the samples are then clustered again on the basis of that new cluster center. In this way we will obtain clusters with new samples.Figure 3b represents the K-means algorithm; the following equation (Yaghini et al. 2012) illustrates the termination condition of the algorithm:
SSE¼Xk
i¼1
X
P∈Ci
jPmij2 (1)
In the correlation (1) P is the point representing a sample,miis the center of the clusterCiand SSE is the sum of the squared deviations for all samples. To investigate the clustering of Babakoohi Anticline joints,first the contour of stereographic pole of the joints was drawn. Then, with the help of mathematical and fuzzy methods, the best and most ideal clustering was carried out using the K-means algo- rithm. The following diagram illustrates the clustering of the joints of the region using the above-mentioned method.
According to the corresponding charts, k 5 2 is the best
classification of the joints for the Babakoohi Anticline, based on the clustering indices. The graph also displays the over- lapping and outlier data.
In the fuzzy K-means clustering method, the accuracy of the number of clusters is determined by the fuzzy algorithms validation indices. The purpose of this validation is to find the clusters that have the most consistency with the data (Hammah and Curran 1998; Klen and Lana 2014;
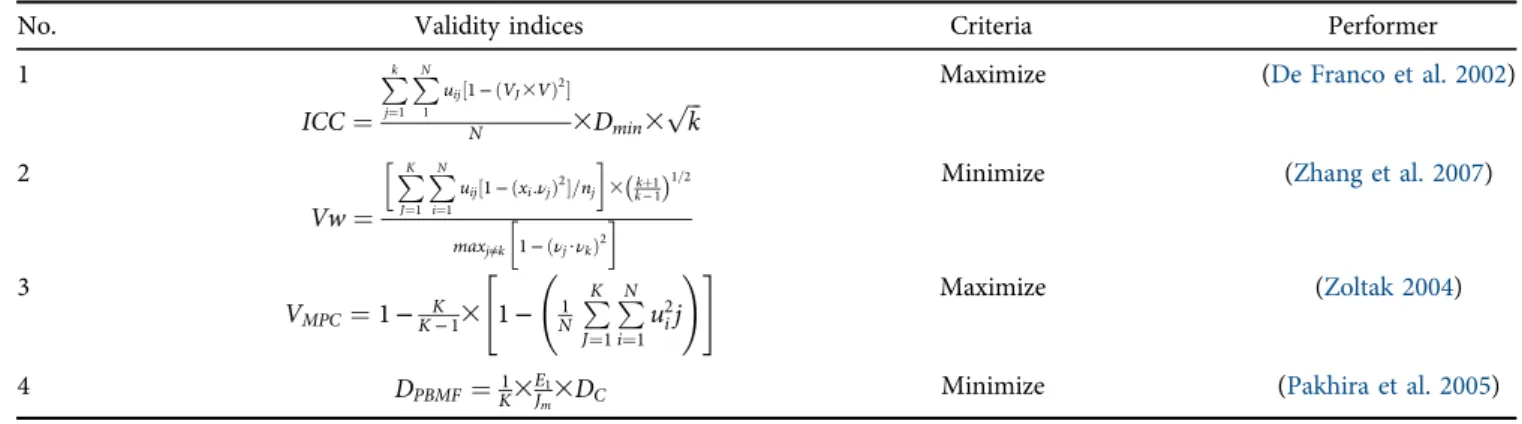
Shahamiri et al. 2017). According toZhang et al. (2007), in assessing the accuracy of clusters, more than one validation index should be used, because the same or similar indices may not be able to correctly identify the number of clusters for all data. Therefore, the ICC, Vw, VMPC, VPBMF indices have been used to verify the accuracy of data clustering in the study area.Table 1shows these indices: The ICC (Inter Class Contrast) index (De Franco et al. 2002) depends on the separation and compression of the clusters. This index is used for the detection of very close centers of clusters. The ICC determines the correctness of clustering by displaying the maximum possible value. The Vw (W validity) index (Zhang et al. 2007) is based on the assumption that the number of clusters should be minimal, to minimize varia- tions as much as possible. According to the VMPC (Modi- fication of Partition Coefficient) index (Zoltak 2004), the selection of the number of clusters is achieved by maxi- mizing the function. The PBMF (Fuzzy Validation of Pak- hira, Bandyopadhyay and Maulik) index (Pakhira et al.
2005) performs the best partitioning from a data set in such a way that the least number of clusters or the highest density could be achieved. According to the following diagrams, by checking the above-mentioned validation indices, the points of minimum and maximum cluster in each of the four graphs show the number two, which corresponds to what has been shown in the joints’ stereographic poles diagram (Fig. 4).
Fuzzy genetic algorithm
The GA genetic algorithm as one of the most effective algorithms to search for the best data categorization (Yamaji 2016a,2016b) and is one of the numerical opti- mization techniques based on evolutionary computing, whose main idea is formed from Darwins theory of evo- lution (Sivanandam and Deepa 2008). This algorithm was
Figure 3.a) Display of stereographic poles related to the Babakoohi Anticline joints in the K-means
developed by Babu and Murty (1993), Bandyopadhyay and Maulik (2000, 2002), Krishna and Murty (1999), Lazlo and Mukherjee (2007), Shelokar et al. (2004), Sung and Jin (2000), and Zhang et al. (2007), and pre- sented by considering combination, selection and muta- tion operators. Since the prototypes are randomly selected in the K-means algorithm, the algorithm may be located in the local optimal trap and do not produce the optimal response (Yaghini et al. 2012); therefore, in studies on data categorization or clustering, it is advisable to use one or two other methods.
In this paper, the GArcmB software was used to study the clustering of the data obtained from the Babakoohi Anticline joints (Yamaji 2016a). The performance of this software in the Matlab environment is based on the genetic algorithm according to the dip and dip direction of the joints, considering the distribution components of the mixed Bingham Distribution Components (Love 2007;Yamaji and Sato 2011; Yamaji 2016a, 2016b). In the software, the number of clusters is selected in several steps by the user, until the algorithm ends. Regarding data of the area under study, the K value was set from 1 to 5, and in K 5 5 the algorithm was terminated. In each step, the number of produced g, the value of the quasi-logarithmic function L
and the BIC value are determined. Also, for each clustering, according to the mixed Bingham Distribution, the mixing coefficientϖ, the stress ratioF, and the values of the density axes e1, e2, e3 and the density parameters k1, k2 are deter- mined. Because of the importance of the subject and the clarity of the above, here are some explanations about the performance of the genetic algorithm and the mixed Bing- ham distribution.
Regarding Fig. 5a, in the genetic algorithm the entire data is initially considered as the initial population (the initialization step), and each member (X) shows the com- ponents of K Bingham (Yamaji and Sato 2011). In the evaluation stage, the suitability of each member of this population X is investigated (considering that the genetic algorithm operates based on the merits of the members, at this stage their qualification is evaluated), and at the end of this stage, the quasi-logarithmic functionL for each suit is determined:
LðXÞ ¼XN
n¼1
logePmBðνnjXÞ (2)
At the intersection stage or the crossover (Baker 1985), which is the most important operator in the genetic algo- rithm (Yamaji 2016b), two strings are considered as parents,
Figure 4.Charts related to Validation Indices for data obtained from Babakoohi Anticline joints Table 1.Validation Indices (Shahamiri et al. 2017)
No. Validity indices Criteria Performer
1
ICC¼ Pk
j¼1
PN
1
uij½1−ðVJ3VÞ2
N 3Dmin3 ffiffiffi
pk Maximize (De Franco et al. 2002)
2
Vw¼ hPK
J¼1
PN
i¼1
uij½1−ðxi:νjÞ2=nj
i
3ðk−1kþ1Þ1=2
maxj≠k
h
1−ðνj$νkÞ2
i
Minimize (Zhang et al. 2007)
3
VMPC¼1−KK−13
"
1− N1 PK
J¼1
PN
i¼1u2ij
!# Maximize (Zoltak 2004)
4 DPBMF¼K13EJm13DC Minimize (Pakhira et al. 2005)
and they form new children by exchanging a subclass be- tween the two strings, where a and b strings are considered as parents and c and d are considered as children.
The selection stage (Baker 1985) is used to remove members of low competence from among other members, and then the mutation operator acts as a popular operator to modify part of a string. According to the below image, a bit in a string is formed as a new child. The logic of using these operators in the genetic algorithm is that the algorithm does not go through searches at local optimum points and searches for more space (Yaghini et al. 2012).
At the end of the stage of the genetic algorithm, at the recording stage, the Xopt point is reported as the best member and other high competence and competence members are reported as well (Yamaji 2016b). Also, the quantitygLmaxis introduced as the function representing the highest generating g (Yamaji 2016b). The genetic algorithm ends whenLmaxis created and the conditiong5gþKΔgis met; whereΔgis 100 or 1000; this depends on the difficulty of dividing the data set into the number of clusters K (Yamaji 2016b,Fig. 6).
Based on Fig. 5b, the mixed Bingham Distribution is a representation of the density of points generated by linear
data in a region that is defined on the basis of density pa- rameters. k1, k2 show the status of the clusters with a negative sign; so, ifk15k250, the cluster is uniform. Ifk1
< k2, the cluster is circular and if k1 ≈ k2, the cluster is elliptical (Yamaji 2016a, 2016b). e1, e2, and e3, respectively represent the minimum, intermediate and maximum compression axes, which is consistent with the axes of ten- sion σ1, σ2, and σ3 (Baer et al. 1994; Yamaji et al. 2010).
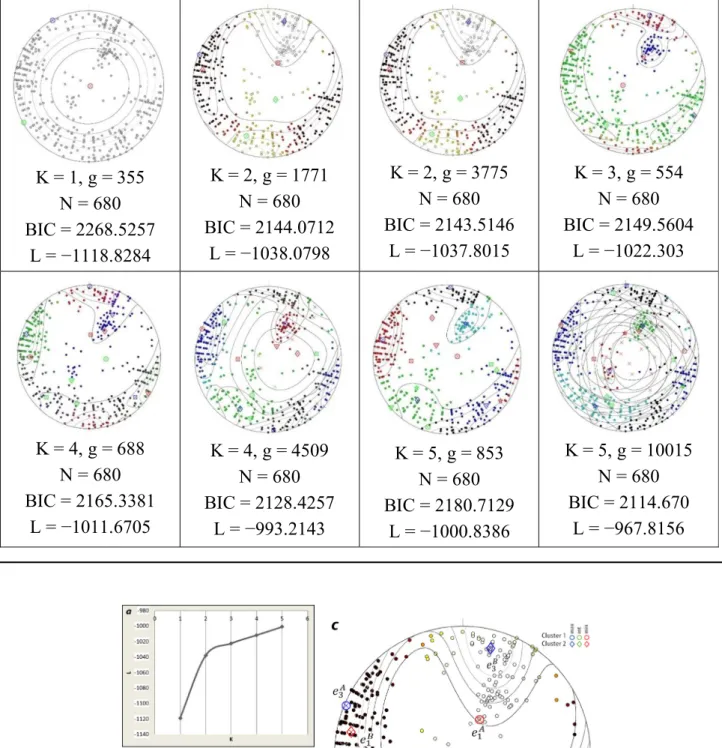
According to the values of the density parametersk1,k2, the stress ratio is obtained through the relationshipF 5k1/k2 (Yamaji 2016a, 2016b). The algorithm was terminated for data of the study area when g 510,015. According to the data of the study area, of which there are 680, the classifi- cation is carried out in several stages of the production of g, and the poles of the joints are shown in circular diagrams.
The diagrams ofTable 2show the process of data clustering using the genetic algorithm according to the process described.
In order to analyze the number of clusters obtained from the data of the area studied and also to check the validity of the results, the L chart versus K and the BIC chart versus K are investigated. In general, the uniform increase of L is a function of the value of K. Accordingly, the L chart versus K Figure 5.a) Genetic algorithm function display; b) display of Bingham’s circular diagrams considering the ratio of Bingham’s parameters
and the density axes (Yamaji 2016b)
Figure 6.a) General mode of the L diagram against X (Yamaji 2016b); b) trend of increasing production by increasing the quasi-logarithmic function (L) for the data of the study area
is a curved graph with upward convexity (Yamaji 2016a, 2016b); if the data for a region is a graph other than this, the result is wrong. According to Fig. 7a, the graph shows the
validity of the algorithm G and the resulting outcome. Also, since it is important to determine the precise value of K from a statistical point of view, the BIC (Bayesian Information Table 2.Charts derived from clustering of data of Babakoohi Anticline joints at each production stage (g) by the genetic algorithm
Figure 7.a) L chart versus K; b) BIC chart versus K; c) demonstration of data clustering using a genetic algorithm and position of density axes in two clusters A and B
Criterion;Schwarz 1978) is also used to verify the accuracy of data (Yamaji 2016a, 2016b). The best number indicating the number of clusters is when the BIC reaches the mini- mum (Yamaji 2016a,2016b).
The min point in Fig. 7bshows the number of clusters that represents the number two.Figure 7cis also a demon- stration of the data clustering situation and the position of the axis of data compression from the joints of the study area.
Table 3also shows values for density axis, stress ratio, Bing- ham mixing coefficient and Bingham components.
DISCUSSION AND CONCLUSIONS
Generally, in structural geology studies, for the study of joints, as well as stress analysis in a region, rose diagrams and the stereonets are used. Nowadays, with the help of modern statistical techniques, it is possible to take an effective step in understanding and interpreting such structures. Fuzzy clustering techniques are one of these techniques where data is divided into clusters whose mem- bers are similar to each other. In principle, cluster analysis is used to classify data or observations according to similarity or degree of proximity, in which data are divided into ho- mogeneous and distinct categories. The purpose of this clustering is to extract fuzzy models, analyze data and recognize the exact patterns that are consistent with the data, which usually shows a good fit with the real world.
Since clustering methods are based on the considering algorithms, they are considered recurrent and, hence, their results would be almost precise and acceptable after applying the multi-stage algorithm. Of the advantages and disad- vantages of clustering techniques the following items could be implied: 1) Through cluster-led analysis, the data or observations can be categorized into homogenous and distinct types; 2) This method is an indirect one which discovers the hidden patterns and improves the performance of direct methods; 3) its usage is almost easy and it can be used in various scientific fields; 4) clustering can be utilized for different distances provided that the distances are chosen properly; 5) the data and observations would be in some way summarized and, hence, would be easier to interpret; and 6) finally, the clustering processes guarantee the fast and secure access to the associate information and determination of the logical relation between them.
On the other hand, this technique suffers from some disadvantages and weak points: 1) choosing the exact range of distances and the weights is not easy; 2) clustering is sensitive to primary parameters, including the number of clusters, the minimum proximity and the primary cluster;
3) the interpretation might be difficult and usually entails
specialists experience, particularly for interpreting big data and results; 4) this technique cannot entirely meet all needs; 5) assessing a great deal of data with huge dimension is problematic due to the time complexity; and 6) the re- sults of clustering algorithms would be interpreted in multiple ways.
The K-means algorithm is one of the most important and most practical fuzzy algorithms used in this study to cluster the data from the Babakoohi Anticline joints. With respect toFig. 3a, the stereographic poles show two separate clusters. Comparing these results withfield studies (Fig. 2), the rose diagrams and contour diagrams obtained from structural geologic methods (Kazemi et al. 2018) show a significant adaptation. Therefore, it can be said that, in the study area, there are two distinct tectonic joints that are formed perpendicular to the anticline axis and parallel to the anticline axis (Kazemi et al. 2018). Also, the presence of scattered points in the stereographic diagram shows the existence of joints with a change in the trend, which is due to the operation of local faults in the study area. In order to verify the accuracy of the number of specified clusters, the ICC, Vw, VMPC and VPBMF Validation Indicators were analyzed and validated. In accordance withFig. 4the indices Vw and VPBMF at the minimum point and indices VMPC and ICC at the maximum, show the point of number two.
In this study, a genetic algorithm was used for clustering of the joints of the study area in order to ensure the accuracy and reliability of the results. This algorithm is commonly used in optimization problems and its standard deviation is negligible.
Further, given that the cluster centers are randomly selected in K-means algorithms, and that the algorithm may be located in the local optimal trap and does not produce the optimal response, then the genetic algorithm is used. In general, the genetic algorithm is a new idea, which has a high ability to solve optimization problems. In this study, the ge- netic algorithm, considering the Bingham mixing compo- nents, according to the dip data and dip direction of the joints, shows the number of clusters 2, which is identical to that presented in the K-means method. According toFig. 7c, the two clusters A and B are separated by the highest density of points. The pointseA1andeB1represent the maximum stress, the pointseA2 andeB2 are intermediate stresses and the points eA3andeB3 show the minimum stress. Based on the position of these points, it can be stated that the clusters A are of the tension stress and the cluster B formed from the strike-slip stress in the region, which, of course, is consistent with the results of the study of the rose diagrams, contour diagrams and an examination of fault slip faults in the region (Kazemi et al. 2018). In this method, the accuracy of the result was confirmed on the basis of the L chart against K and BIC Table 3.Results from clustering of Babakoohi Anticline joints using the genetic algorithm based on Bingham mixing distribution
Clusters e1 e2 e3 k1 k2 F ϖ
Cluster A 26.5/65.5 209.1/24.4 292.7/1.7 7.955 1.590 0.1998 0.6043
Cluster B 281.3/12.4 154.7/69.8 14.9/15.7 7.957 2.511 0.3156 0.3957
versus K. Since it is necessary to compare the two methods, it is concluded that in spite of providing similar results with both methods, in general, because of higher accuracy, the more reliable result, and lower standard deviation, the genetic algorithm excels in the K-means algorithm.
However, it is reasonable that in any scientific research for any purpose, either each method should be used sepa- rately or in a combination of the two algorithms. Nowadays, in most studies of data clustering, combinational methods are also used which, of course, require the provision of specific software in various scientific and research fields.
ACKNOWLEDGEMENTS
We thank the Vice President of the Islamic Azad University, Shiraz Branch, for cooperation during the carrying out of this study.
REFERENCES
Agard, P., Omrani, J., Jolivert, L., Whitechurch, H., Vrielynek, B., Spakman, W., Monie, P., Meyer, B., & Wortel, R. (2011). Zagros Orogeny: a subduction-dominated process.Geology Magazine, 148(5–6), 692–725.
Ahmadhadi, F., Daniel, J. M., Azizzadeh, M., & Lacombe, O. (2008).
Evidence for pre-folding vein development in the Oligo-Miocene Asmari Formation in the Central Zagros Fold Belt, Iran.Tec- tonics,27, TC1016,https://doi.org/10.1029/2006TC001978.
Ajirlu, M. S., Moazzen, M., & Hajialioghli, R. (2016). Tectonic evolution of the Zagros Orogen in the realm of the Neotethys between the Central Iran and Arabian Plates: an ophiolite perspective.Central European Geology,59(1–4), 1–27.
Alavi, M. (1994). Tectonics of Zagros Orogenic Belt of Iran, new data and interpretation.Tectonophysics,229, 211–238.
Alavi, M. (2004). Regional stratigraphy of the Zagros Fold-Thrust belt of Iran and its proforland evolution.American Journal of Science,304, 1–20.
Alavi, M. (2007). Structures of the Zagros fold-thrust belt in Iran.
American Journal of Science,307, 1064–1095.
Andre, M. K., Milen, S. L., (2014). Fuzzy Algorithm of dictionary sets. REM: REVISTA ESCOLA DE MINAS.Ouro Preto,67(4), 439–445.
Anthony, A. & desJardins, M. (2006). Open problems in relational data clustering. In: Proceedings of ICML workshop on open problems in statistical relational learning, Pittsburgh, p. 3.
Babu, G. P. & Murty, M. N. (1993). A near-optimal initial seed value selection for K-means algorithm using genetic algorithm.
Pattern Recognition Letters,14(10), 763–769.
Baer, G., Bethy, M., & Reches, Z. (1994). Dikes emplaced into fractured basement, Timna Igneous Complex, Israel.Journal of Geophysical Research,99(24), 24039–24051.
Baker, J. E. (1985). Adaptive selection methods for genetic algo- rithms. In:Proceedings of the first international conference on genetic algorithms. L. Erlbaum Associates Inc., Hillsdale, pp.
101–111.
Bandyopadhyay, S. & Maulik, U. (2000). Genetic algorithm-based clustering technique.Pattern Recognition,33(9), 1455–1465.
Bandyopadhyay, S. & Maulik, U. (2002). An evolutionary technique based on K-means algorithm for optimal clustering in RN.In- formation Sciences,146(1–4), 221–237.
Berberian, M. & King, G. C. P. (1981). Towards the paleogeography and tectonic evolution of Iran. Journal of Earth Science, 18, 210–265.
Bigi, S., Battaglia, M., Alemanni, A., Lombardi, S., & Campana, A.
(2013). CO2 flow through a fractured rock volume: Insights from field data, 3D fractures representation and fluid flow modelling. International Journal of Greenhouse Gas Control, 18, 183–199.
De Franco, R. C., Silva, L., Vidal, A., & De Oliveira Cruz, J. A.
(2002). A validity measure for hard and fuzzy clustering derived from Fisher’s linear discriminant. Proceedings of the 2002 IEEE International Conference on Fuzzy Systems, 2, 1493–1498.
Gudmundsson, A. (2011). Rock fractures in geological processes.
Cambridge University Press, Cambridge, p. 592.
Hammah, R. E. & Curran, J. H. (1998). Fuzzy cluster algorithm for the automatic identification of joint sets.International Journal of Rock Mechanics and Mining Science,35(7), 889–905.
Han, J. & M. Kamber (2001). Data mining: concepts and tech- niques. Morgan Kaufmann Publishers, San Fransisco, p. 550.
Homke, S., Verges, J., Van Der Beek, P., Fernandez, M., Saura, E., Barbero, L., Badics, B., & Labrin, E. (2010). Insights in the exhumation history of the NW Zagros from bedrock and detrital apatitefission-track analysis: evidence for a long-lived orogeny.Basin Research,22(5), 659–680.
Jain, A. K. (2010). Data clustering: 50 years beyond K-means.
Pattern Recognition Letters,31(8), 651–666.
Jain, A. K. & Law, M. H. C. (2005). Data clustering: A user’s dilemma. In: Pal S. K., Bandyopadhyay, S., & Biswas, S. (Eds.), Pattern recognition and machine intelligence. Lecture notes in computer science,Vol. 3776, pp. 1–10.
Jimenez-Rodriguez, R. & Sitar, N. (2006). A spectral method for clustering of rock discontinuity sets. International Journal of Rock Mechanics and Mining Sciences,43(7), 1052–1061.
Jolly, R. J. H. & Sanderson, D. J. (1997). A Mohr circle construction for the opening of a pre-existing fracture.Journal of Structural Geology,19(6), 887–892.
Kazemi, H., Yazdjerdi, K., Asadi, A., & Mozaffari, M. R. (2018).
Analysis and study of the western part of Babakoohi Anticline fractures in the north of Shiraz City and determination of the stress based on new structural geology methods and comparison with mathematical methods. PhD thesis, Islamic Azad Univer- sity, Tehran.
Klen, A. M. & Lana, M. S. (2014). Fuzzy algorithm of discontinuity sets.REM: Revista Escola de Minas,67(4), 439–445.
Klose, C. D., Seo, S., & Obermayer, K. (2005). A new clustering approach for partitioning directional data. International Journal of Rock Mechanics and Mining Geology, 42(2), 315–321.
Kowallis, B. J., Wang, H. F., & Jang, B. (1987). Healed microcrack orientations in granite from Illinois borehole UPH-3 and their relationship to the rock’s stress history.Tectonophysics,135(4), 297–306.
Kowalski, G. J. (2007). Information retrieval systems: theory and implementation. Kluwer Academic Publishers, New York, p.
282.
Krishna, K. & Murty, M. N. (1999). Genetic K-means algorithm.
IEEE Transations on systems, Man and Cyberenetics, Part B:
Cybernetics,29(3), 433–439.
Lazlo, M. & Mukherjee, S. (2007). A generic algorithm that ex- changes neighboring centers for K-means clustering. Pattern Recognition Letters,28(16), 2359–2366.
Lespinasse, M. & Pecher, A. (1986). Microfracturing and regional stress field: a study of the preferred orientations of fluid-in- clusion planes in a granite from the Massif Central, France.
Journal of Structural Geology,8(2), 169–175, 177–180.
Love, J. J. (2007). Bingham statistics. In: Gubbins, D., & Herrero- Bervera, E. (Eds.), Encyclopedia of geomagnetism and paleo- magnetism. Springer, Dordrecht, pp. 45–47.
MacQuarrie, N. (2004). Crustal scale geometry of the Zagros fold-thrust belt, Iran. Journal of Structural Geology, 26(3), 519–535.
MacQueen, J. B. (1967). Some methods for classification and analysis of multivariate observations.Proceedings of Fifth Ber- keley Symposium on Mathematical Statistics and Probability,1, pp. 281–297.
Marcotte, D. & Henry, E. (2002). Automatic joint set clustering using a mixture of bivariate normal distributions.International Journal of Rock Mechanics and Mining Sciences,39(3), 323–334.
Marshak, S. & Mitra, G. (1988).Basic methods of structural geology.
Prentice-Hall, Upper Saddle River, p. 446.
Pakhira, M. K., Bandyopadhyay, S., & Maulik, U. (2005). A study of some fuzzy cluster validity indices, genetic clustering and application to pixel classification. Fuzzy Sets and Systems, 155(2), 191–214.
Peel, D., Whiten, W. J., & McLachlan, G. J. (2001). Fitting mix- tures of Kent distributions to aid in joint set identification.
Journal of the American Statistical Associations,96(453), 56–
63.
Pireh, A., Alavi, S. A., Ghasemi, M. R., & Shaban, A. (2015).
Analysis of natural fractures and effect of deformation intensity on fracture density in Garau Formation for shale gas develop- ment within two anticlines of Zagros fold and thrust belt, Iran.
Journal of Petroleum Science and Engineering,125, 162–180.
Sarkarinejad, K. & Azizi, A. (2008). Slip partitioning and inclined dextral transpression along the Zagros Thrust System, Iran.
Journal of Structural Geology,30(1), 116–136.
Sarkarinejad, K. & Ghanbarian, M. A. (2014). The Zagros hinter- land fold and thrust belt in-sequence thrusting, Iran.Journal of Asian Earth Science,85, 66–79.
Sarkarinejad, K. & Heibati, Z. (2016). Vorticity analysis in the Zagros orogen, Shiraz area, Iran.International Journal of Earth Sciences,106, 2041–2065.
Schwarz, G. (1978). Estimating the dimension of a model.Annals of Statistics,6(2), 461–464.
Shahamiri, R., Yazdjerdi, K., Asadi, A., Mozafari, M., & Ahmadi, V.
(2017). Clustering of Sabzpushan anticline joints by fuzzy method and comparison with classical methods in the geology of Southwestern Iran.Bulgarian Chemical Communications, (in press).
Shelokar, P. S., Jayaraman, V. K., & Kulkarni, B. D. (2004). An ant colony approach for clustering.Analytica Chimica Acta,509(2), 187–195.
Sivanandam, S. N. & Deepa, S. N. (2008).Introduction to genetic algorithm. Springer Verlag, New Delhi, p. 442.
Stocklin, J. (1974). Possible ancient continental margins in Iran. In:
Burke C. A. & Drake, C. L. (Eds.),The geology of the continental margin. Springer, New York, pp. 873–887.
Sung, C. S. & Jin, H. W. (2000). A tabu-search-based heuristic for clustering.Pattern Recognition,33(5), 849–858.
Takhur, P., Srivastava, D. C., & Gupta, P. K. (2017). The genetic algorithm: a robust method for stress inversion. Journal of Structural Geology,94, 227–239.
Wallbrecher, E. (1978). Ein Cluster-Verfahren zur richtungs- statistischen Analyse tektonischer Daten. Geologische Run- dshau,67(3), 840–857.
Whitaker, A. E. & Engelder, T. (2005). Characterizing stressfields in the upper crust using joint orientation distributions.Journal of Structural Geology,27(10), 1778–1787.
Yaghini, M., Soltanian, R., & Noori, J. (2012). A hybrid clustering method using genetic algorithm with new variation operators.
International Journal of Industrial Engineering and Production Management,23(1), 121–128.
Yamaji, A. (2016a).GArcmB software package, user’s guide. Kyoto University, Kyoto, p. 9.
Yamaji, A. (2016b). Genetic algorithm forfitting a mixed Bingham distribution to 3D orientations: a tool for the statistical and paleostress analyses of fracture orientations.Island Arc,25(1), 72–83.
Yamaji, A. & K. Sato (2011). Clustering of fracture orientations using a mixed Bingham distribution and its application to paleostress analysis from dike or vein orientations.Journal of Structural Geology,33(7), 1148–1157.
Yamaji, A., Sato, K., & Tonai, S. (2010). Stochastic modeling for the stress inversion of vein orientations: Paleostress analysis of Pliocene epithermal veins in southwestern Kyushu, Japan.
Journal of Structural Geology,32(8), 1137–1146.
Yousefi, T., Vakil, F., & Nimroozi, A. (2001).Record of the 1:25000 map of Shiraz, IIINE 6549. Geological Survey and Mineral Exploration of Iran, Tehran (In Persian).
Zalik, K. R. (2008). An efficient K-means clustering algorithm.
Pattern Recognition Letters,29(9), 1385–1391.
Zhang, Y., Wang, W., Zhang, X., & Li, Y. (2007). A cluster validity index for fuzzy clustering. Information Sciences, 178(4), 1205–1218.
Zoltak, B. (2004). VMPC One-way function and stream cipher.
Lecture Notes in Computer Science,3017, 210–225.
Open Access statement. This is an open-access article distributed under the terms of the Creative Commons Attribution-NonCommercial 4.0 International License (https://
creativecommons.org/licenses/by-nc/4.0/), which permits unrestricted use, distribution, and reproduction in any medium for non-commercial purposes, provided the original author and source are credited, a link to the CC License is provided, and changes–if any–are indicated.