Beáta Nagy & aNNa SeBők
66
2.3 FEMALE AND MALE MANAGERS
Beáta Nagy & Anna Sebők
Share of men and women in management positions
Data from the Labour Force Survey of the Central Statistical Office (CSO) indicate that the share of women in management positions is increasing. The gender ratio in the first main category of the Hungarian Standard Classifi- cation of Occupations (HSCO) (managers) is close to balanced: the share of women in the 2010s exceeds 41 per cent. One of the important reasons for this high proportion is the increasing female dominance in the younger gen- erations in higher education, which increases the female management pool.
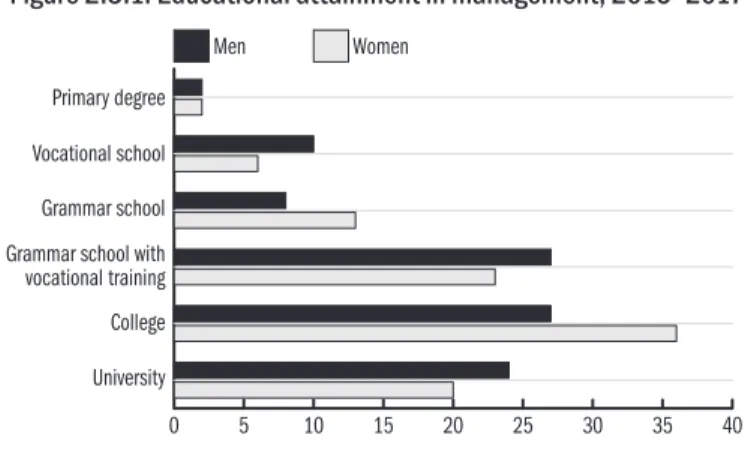
However, this 41 per cent share hides the excessive heterogeneity of the cat- egory, since it includes all management categories (ministers, heads of nurser- ies, business leaders or railway stationmasters). That is why the most frequent educational attainment level in the main category of management positions is college degree, followed by upper-secondary qualification, while university degree is only the third most frequent for women and men alike (Figure 2.3.1).
Figure 2.3.1: Educational attainment in management, 2015–2017
Source: Labour Force Survey of CSO.
Where are women in managerial positions?
Women more frequently hold management positions in the public rather than in the private sector (see data in Pocketbook). When further analysing horizontal segregation, the gender gap is also striking across economic sec- tors: women primarily work as managers in finance and budgeting, followed by manufacturing, while the order is just the opposite for men. Apparently, women and men hold management positions in different sectors and, as will be seen later, in different occupational categories (Figure 2.3.2).
0 5 10 15 20 25 30 35 40
Women Men
University College Grammar school with vocational training Grammar school Vocational school Primary degree
0 20 40 60 80 Organisations assisting
business activities Trade and service Heads of service units Heads of production units Finance-budgeting Social (advocacy) Public administration
20162011 20162011 20162011 20162011 20162011 20162011 20162011
0 10 20 40 40 50
Organisations assisting business activities Trade and service Heads of service units Heads of production units Finance-budgeting Social (advocacy)
20162011 20162011 20162011 20162011 20162011 20162011
Percent Percent
0 10 20 30 40 50 60 70 80
Percent
2011 2012 2013 2014 2015 2016
0 10 20 30 40 50
Percent
2012 2013 2014 2015 2016
Public sector Private sector
2.3 Female and male managers
67
* Because of the small number of cases, the Figure does not include the category of HSCO-111: legislator and senior officials.
Source: Wage Survey, National Labour Office (NLO).
The narrower the categories, the more striking the segregation of female and male managers according to branches of industry: Figure 2.3.3 illustrates this difference with the examples of managers in ICT and education.
Figure 2.3.2: The share of women in management categories (2011 and 2016)
Public sector* Private sector
Figure 2.3.3: The share of female managers in information and communications technology and in education
Information and communications technology Education
Source: Wage Survey, National Labour Office (NLO).
How much do managers earn?
The aggregate difference between the wages of men and women, according to data from the Wage Survey, was 16 percentage points in 2016, the major- ity of which results from segregation, the fewer hours worked by women be- cause of family obligations and less work experience. However, an analysis of managers compares more homogeneous female and male groups of leaders.
Figure 2.3.4 presents the wages of female and male managers in the public and private sectors.
0 200 400 600 800 Thousand HUF Organisations assisting
business activities Trade and service Heads of service units Heads of production units Finance-budgeting Social (advocacy) Public administration
womanman womanman womanman womanman womanman womanman womanman
0 200 400 600 800 1000 Thousand HUF Organisations assisting
business activities Trade and service Heads of service units Heads of production units Finance-budgeting Social (advocacy)
womanman womanman womanman womanman womanman womanman
Beáta Nagy & aNNa SeBők
68
Source: Wage Survey, National Labour Office (NLO).
In the public sector, both male and female managers earned the highest wages in advocacy, administration and finance-budgeting in the period investigat- ed (Figure 2.3.4). The wage advantage of male leaders is significant in all cat- egories except for the management of service organisations. As for the man- agers of service organisations, male leaders typically had the highest wages at financial institutions, while women had the highest wages as managers of healthcare and educational institutions.
In the private sector, men had the highest wages at leading organisations assisting business activities, followed by managers at special interest organi- sations and business organisations. Similarly, the highest average wages for women leaders were seen at organisations assisting business activities, fol- lowed by leaders at service organisations and business organisations. The wag- es of women managers were lower than those of men in all categories, mostly quite massively.
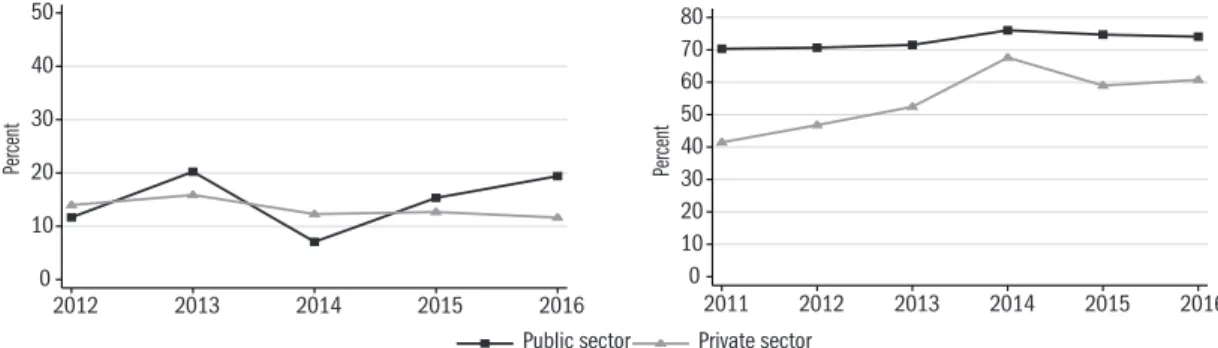
Do women managers have a family life?
There is a well-known correlation between holding a management position and the difficulties of balancing work and family life (the higher the position, the greater the difficulty). While men often may rely on their wives (partners) and children as resources, the ‘second shift’ drains resources in the case of women. Hungarian data also show that female managers are less often mar- ried or cohabit: in the 2010s, 70 per cent of male managers and 62 per cent of female managers lived in a relationship, according to the Labour Force Survey.
In families and households, the tasks of caring for dependents place more burden on women: caring for children and the elderly mainly falls to women. It is underpinned by the fact that more female than male managers receive social transfers related to child and elderly care. Data from the Labour Force Survey Figure 2.3.4: Average wages of men and women in management positions, 2016
Public sector Private sector
2.3 Female and male managers
69 indicate that 0 per cent of men as opposed to 6–7 per cent of women manag- ers receive parental leave benefits or domiciliary care allowance in the 2010s.
Although data suggest a very high (41 per cent) proportion of women man- agers in Hungary, the patterns of occupational segregation are also seen. Social norms and roles keep women in feminized sectors and occupations, which are less-paid and in this way they account for some of the gender wage gap in management. Nevertheless the wage disadvantage of female managers, except for a single occupational category, is also conspicuous in a detailed category- by-category comparison. The disadvantage of female managers is reinforced and sustained by the fact that women more often than men are responsible for caring for dependents in the family.
K2.1 Women in science – in Europe and Hungary Veronika Paksi & Dóra Groó
In accordance with the strategy of the European Union, the share of women in research and devel- opment (R&D) has been growing since the millen- nium; however, the gender gap is only very slowly decreasing. Women accounted for only one-third of the European R&D sector in 2012, and the share of women was even lower in the field of engineer- ing and technology (28 per cent) in spite of a sub- stantial labour shortage. One of the main reasons for the low presence is the significant disadvantages that female researchers still face during their ca- reer. A lower proportion of them is able to obtain a job in research or in a field corresponding to their qualifications and a higher proportion of them work under precarious employment contracts, es- pecially in higher education. Although the gender wage gap has decreased since the millennium in R&D, women still received 18 per cent lower wages for the same job in 2012 – which was larger than the wage gap seen in the economy overall. Vertical segregation (the so-called glass ceiling) remained strong, particularly in male dominated professions, despite the fact that the proportion of female heads
of higher education institutions and the share of women in decision making bodies significantly im- proved in that period. Nevertheless, the proportion of female professors in the field of technology did not exceed 13 per cent in 2012 (EC, 2013, 2015).
The situation of Hungarian female researchers is less favourable than that of their European col- leagues or their male counterparts. Their head- count has increased more slowly than that of men in R&D since the millennium, thus their propor- tion has been continuously decreasing – currently it does not even reach one-third. Horizontal seg- regation across sectors (the so-called glass wall) forces women into the low-paid public sector and only one-fifth of them holds a job in the better paid private sector. Although the largest increase in the headcounts of women was seen in technology, their proportion is the lowest in this field (22 per cent) and there is intense movement between the sectors:
women typically move from the private to the pub- lic sector (EC, 2012, 2015). Qualitative research has highlighted that this trend is partly due to striving for a better work-life balance, meanwhile, knowl-