OPTICAL DOPPLER FOR SPACE NAVIGATION R. G. Franklin and D. L. Birx 1 2 The Franklin Institute Laboratories
for Research and Development, Philadelphia, Pa, ABSTRACT
The difficulties entailed in the use of optical Doppler techniques with natural radiation for the measurement of space velocities and the advantages of template spectroscopy in this connection are discussed. An experimental arrange- ment with a potential capability of measuring velocities of the order of meters per second is described. Preliminary re- sults are given using the rotation of the sun as a source of Doppler shifts.
Inability to measure extremely small wavelength shifts in light sets a limit to the accuracy obtainable. Optical heterodyning could be employed to shift optical Doppler measurements to the radio frequency range where precision frequency measuring techniques are available. The diffi- culties and limitations of one such system are discussed.
The use of Lasers to produce a highly monochromatic source of light which can be mixed with natural spectral lines to set up "beat" frequencies offers interesting possibilities for the detection of small wavelength shifts. An experimental arrangement for such a system is proposed.
INTRODUCTION
In a recent study undertaken for Wright Air Development Division (l)3 natural radiation from the sun, the stars, and interstellar space in both the optical and radio portion of the spectrum were investigated with the aim of determining their value to space navigation, particularly in the
Presented at ARS Guidance, Control, and Navigation Con- ference, Stanford, Calif., Aug. 7-9, 1961. This work was supported by the USAF Wright Air Development Division, Dayton, Ohio, under Contract AF 33(616)-7244·
•^Research Physicist.
^Manager, Electronics Laboratory*
3Numbers in parentheses indicate References at end of paper.
469
measurement of velocity using the Doppler phenomenon, As a result of this study, ensuing interest has centered about the measurement of velocity through Doppler spectral shifts in the optical range. Excellent detectors exist in this range, the equipment is relatively compact, and a large number of natural sources exist. Except for the sun, however, the energy re- ceived from natural sources in the vicinity of Earth is very small, and special techniques are required to derive useful signals. Two potentially useful techniques, template spectro- scopy and optical heterodyning, are currently under investiga- tion and are discussed herein.
TEMPLATE SPECTROSCOPY Basic Techniques
The template spectroscopy method as originally proposed by Felgett (2) consists of using a photographic negative of the spectrum of a source of light at rest as a "template". This is placed in the focal plane of the spectrograph and matched with the spectrum of the source at rest. As the source of light
(or the observer) moves in the line of sight, the spectrum lines are displaced according to the Doppler equation
dk = XdV/c
and the amount the template must be moved to restore the match conditions is a measure of the relative velocity change.
As seen from this equation, the Doppler shift varies with wavelength, but practically, over a limited spectral range, the shift for all lines will be reasonably the same, and good matches can be obtained.
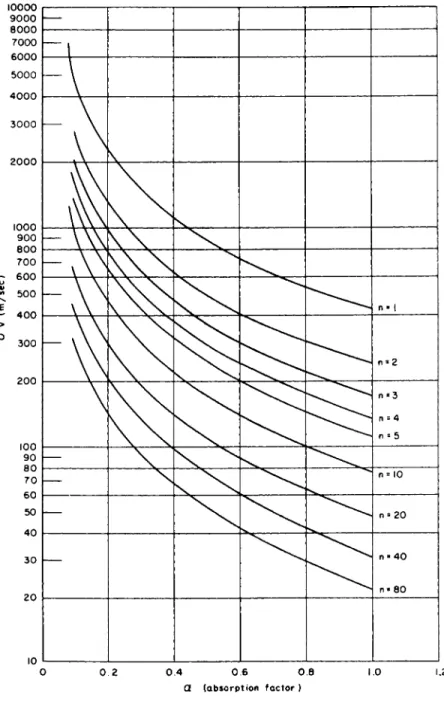
The advantage in using this method is shown in Fig. 1, which is a plot of noise level expressed in units of velocity
(m/sec) vs. the average absorption factors of the spectral lines. The error equation
<r(V) =
where E \ = Hsd ^ Oe 2 <>
HsdX> = irradiance of star = 1 χ 10 w/cm - A 0 = area of collecting telescope = 500 cm^
e = attenuation of spectroscope optics =0.1 o(V) = error in velocity measurements
a « absorption factor of lines
S « sensitivity of phototube - 2 χ 10? Lta/pw G « gain of tube = U x 1 00
ID β dark current of tube » 5 x 10""** amp t = smoothing time = 100 sec
c = velocity of light 0
λ « average wavelength = 4000A η = number of absorption lines used
e « electron charge = 1.6 x lO^'coulombs Δ λ - half width of line = ll
w β half width of line on template = 1A.
is reproduced here from Ref. 1 with typical values used in the calculation of data for the curve. The equation is based on a simplified shape of spectral lines, considering them to be triangular for ease of calculation rather than Gaussian or some other more representative form. If δ is the wavelength shift of the lines, a the fraction of the light absorbed at the center of the line, ß the transmission of the template at the line, and τιΕχ the light incident on the template from η lines if no absorption were present, then the total change in transmitted light may be shown (3) to be given by
dL • ΐ/2α/3δηΕλ
A. comparison of this expression with the one obtained by the common method of using balanced detectors on either side of the line (e.g., the Babcock Magnetograph, Ref. 4) shows that the template system is only lA as sensitive, but since sev- eral lines may be used, it is expected that nE^will more than compensate for the decrease in sensitivity.
The data presented in Fig. 1 assume a 10-in. telescope and a standard value for stellar irradiance of 1 χ 10""l6w/cm2-X.
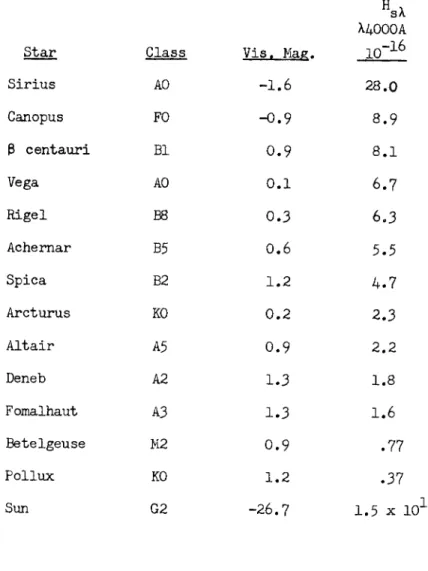
The earlier paper showed that there is practically no benefit derived from a larger collector. In order that the data in Fig. 1 may be applied to determine the actual expected errors from typical stars, Table 1 lists the irradiance values at
λ = 4000& of several of the brighter stars and the sun.
It should also be pointed out that actual stellar spectra, Fig. 2, contain lines of varying intensities or transmission factors. Only the strongest lines contribute advantageously since the signal, is a function of the absorption of the lines and the transmission of the template. Therefore, with any natural spectrum, it is apparent that there is an optimum number of lines for the template, beyond which no further in- crease in sensitivity may be expected.
471
Experimental Arrangement
To test the feasibility of the template spectroscopy method, equipment has been set up initially to use the sun as a
source. By scanning across the equator of the sun a Doppler shift corresponding to a velocity of + 2 km/sec may be ob- tained. Moreover, the sun is a star representative of class G-2 which contains many metallic lines in its spectrum. It is an intense source of light, convenient for alignment and calibration, which may be later filtered to simulate stellar intensities. In looking at any portion of the sun, some in- crease in noise due to random Doppler shift will have to be expected and compensated for as far as possible by longer integration times. Use of the whole sun or a star would pro- vide some natural integration to reduce the magnitude of the random excursions.
Fig. 3 shows the general arrangement of the equipment. A coelostat on the roof of the laboratory reflects the sunTs rays to a hot-cold mirror, the angle of tilt of which can be controlled from within the laboratory to align the beam of the sun with the vertical telescope axis. The telescope ob- jective is a coated lens, 3è in. diam with a 4 ft focal length that forms an image of the sun about J in. diam. The magnify- ing lens enlarges this image about 8 times to form an image of the sun approximately 4 in. diam at the sampling.slit.
Tilting of the hot-cold mirror permits the solar image to be shifted across this slit so that any portion of the sun may be viewed. The image of the sampling slit is then focussed on the spectrograph through a lens system designed to con- serve as much of the light as possible. A Pechau prism in the optical path permits the image of the sun to be rotated so that its axis may be aligned with the sampling slit.
A Bausch and Lomb Littrow spectrograph with glass optics is being used in this work. Although the dispersion is not as great as that which ideally may be desired, it appears to be adequate& The dispersion of the present instrument is 3A/m m at 3600 A, 4 V ™ a t 4000Â, and 7.5A/mm at 4500 A, the region of probable interest. The focal length at the NaD line is 1827 mm and the f/no. = f/26.
One template being used is a high contrast negative of the solar spectrum, masked to include only desirable regions, i. e#, those regions containing distinct intense lines. The match point under these conditions is the point of minimum light transmission, as indicated by the photomultiplier detector in the diagram. A photograph of an iron arc spec- trum has also been successfully used as a template, since
the majority of the strong lines in the spectral region used are due to that element.
The Doppler displacement of the spectra is very small at the dispersions contemplated and the velocity accuracy de- sired. Table 2 lists the change in velocity dV, the corre- sponding wavelength shift dX, and the linear displacement dl at the template for the wavelengths
36OOA
and 4500A, making use of the Doppler formula dX = dVX/C and the known disper- sion of the spectrograph. A number of methods were consid- ered for measuring these small displacements, and the technique chosen was that of rotating a flat glass plate approximately 1 mm thick placed in front of the lens prism system as shown in the diagram. At the end of a long lever arm (approximately 6 ft) attached to this plate, a motion of approximately 1 mm for every 300 m/sec velocity change is achieved. Substitution of a quartz plate 0.5 mm thick, in- creased the sensitivity to approximately 170 m/sec for 1 mm motion. A micrometer head is provided for accurately measur- ing the motion of this arm, the position of which to achieve exact match provides a measure of the relative velocity between the observer and source. Some aberration is intro- duced into the system by the glass plate, since all the rays do not impinge upon it at the same angle of incidence. How- ever, for the small solid angle of the incident beam and the limited spread of the refracted angles, these aberrations are negligible. Fig. 4 shows the amount of shift achieved in the lines of the iron arc spectrum when the plate is shifted an amount corresponding to 8 cm at the micrometer end of the lever. Measurements on a comparator showed that this shift was about 0.075 mm at all wavelengths from 3800Â to 4400Â, the spectral range employed. This corresponds to a wave- length shift of about 0.261 at 3800A and 0.47Ä at 440θΧ and a velocity of 23 km/sec and 32 km/sec, respectively. The micro- meter vernier is calibrated in divisions of 0.01 mm, which gives it a resolving capability of 3 to 4 m/sec.In order to facilitate the detection of the match point a wobbulator mechanism was introduced into the system to vibrate the spectrum at the template, thus setting up an alternating signal and permitting detection by sensitive ac methods. This was most easily accomplished by adding a mechanism to shift the slit in the viewing screen back and forth. The image of the slit in the focal plane of the spectrograph slit acted as the spectrograph slit and as it vibrated back and forth, the spectrum in the plane of the template moved back and forth over the template. At the match point this produced waves of equal amplitude as shown in the oscilloscope traces of the signal, depicted in Fig. 5-a
Fig. 5-b and 5~c show oscilloscope traces at mismatch points.
These traces were taken at different positions on the image of the sun as it was scanned across the equator. A movement of the lever arm of 0.25 - 0.30 mm produced a detectable signal which corresponds to approximately 45 - 50 m/sec. It is hoped that much of the noise appearing in the traces can be elimi- nated by more sophisticated wobbulating and detection tech- niques, permitting greater sensitivities.
OPTICAL HETERODYNING Basic Technique
A very intriguing method of measuring small Doppler shifts is suggested by the light mixing experiment performed by Forrester, Gudmundsen, and Johnson ( 5 ) , wherein it was demon- strated that beats could be obtained between spectral lines from two incoherent light sources provided the frequency separation of the lines is large compared to their spectral widths. Narrowest lines in the visible region run about 0.001A or 10** cps in width, so that for a well defined beat, two sources should be separated by at least 1 0 ^ cps. Then, if a line at 6000Â (5 x 10^ mc) were being used, a "local oscillator" could be arranged to have a frequency 10,000 mc above or below this line corresponding to wavelengths of 5999.88Â or 6000.12Â. Then, with no relative velocity be- tween the source and the observer, a frequency of 10,000 mc would be observed. Assuming a velocity range of interest from 0 to 100 km/sec, Table 3 lists the beat frequencies that would be obtained.
It is apparent that such a procedure would result in a sen- sitive means of measuring velocities in the range from 0 to 1000m/sec. Above this point, the frequency shifts involved are so large that any one piece of equipment would be too restricted in range to be useful.
Improving the S/N Ratio
Forrester found that shot noise in the photomixer tube was a serious problem, and starting with an S/N ~ 10""^ at the in- put to the detector he was able to obtain a signal to noise ratio of only 2 after using radiometer techniques and inte- grating for 250 sec. In studying ways of improving the S/N ratio, the most hopeful approach seemed to be an increase in the bandwidth capability of the photomixer radiometer com- bination. The bandwidth employed in the original experiment
was 7 mc - the maximum permitted by receivers then available.
A bandwidth equal to the line ividth (1000 mc) would permit a maximum amount of signal energy.
Radiometers are available with a 1000 mc bandwidth at a center frequency of 10 kmc. The problem of obtaining a wide band width in the photomixers is more serious. The original tube incorporated a narrow band cavity (Q ~ 1470) for ex- tracting the beat frequency energy from the electron beam.
To broaden the cavity to 1000 mc would require a Q of
approximately 10. By assuming the use of such a cavity, the results to be expected can be calculated in terms of S/N ratio.
For any cavity
Q = U)CR
where uu = resonant frequency of cavity = 2nf R = equivalent shunt resistance C = equivalent shunt capacity If of = the cavity bandwidth
f o/6f = u)CR
and Rôf = 1/2TTC, which is a constant for any given cavity configuration. In the narrow band case, using values ob- tained by Forrester, the following is obtained;
2 2
Signal power = ι R = R
where I = total photocurrent = 3.85 x 1 0 exp -6 amp ôf = bandwidth of cavity « 7 mc
Af = bandwidth of signal » 1000 mc 0 λ = wavelength of spectral line = 546l A
(5.46 χ 1 0 exp -5 cm)
Ω —* solid angular spread in the light at the photocathode
A = area of cathode ΑΩ = 0.17
R == equivalent shunt resistance of cavity
« 0.247 x 1 06 ohms
By substituting these values, it is found that the signal power into the cavity was approximately 2.2 χ 1 0 exp -l6 watt.
For noise power, the following is obtaineds
*75
Shot noise = 2eI6fR
where e = electron charge s 1.59 x 10 exp -19 coulomb, and other terms are as previously defined.
Substituting
Shot noise = 2.1 χ 10 exp -12 watt Thermal noise = ktof
= (1.38 χ 10 exp -23) (300) (7 x 10 exp 6)
= 2.9 x 10 exp -14 watt
Thermal and receiver noise (noise figure of receiver
= 8)
= 8 x thermal noise
= 2.32 χ 10 exp -13 watt
The S/N ratio at the input to the radiometer becomes, therefore a at / · i\ « 2.2/4. x 10 exp -l6 ~ ι η j
S/N (input) - 2[ - « χ 1 0 e x£ _1 2 - 10 exp -4
which checks the figure given by Forrester. At the output of the radiometer, it would be expected for 250 sec integration
S/N (output) = Q U + ^ Φ^ S^ a p : — — JVttTr ' v ^ ' Shot + Thermal + Receiver Noise Vv '
= (10 exp -4)^(7 x 10 exp 6) (250)
= 4
For the broad band case, Q = 10, and the equivalent shunt resistance is approximately 1730Ω. Both the signal power and the shot noise power into the cavity remain the same since any change in of is countered by an equivalent inverse change in R. Thermal noise power, however, increases with the band- width. Therefore
Thermal noise power = 4.2 χ 10 exp -12 watt
Thermal and receiver noise power = 35.2 χ 10 exp -12 watt and
S/N (input) =' v ^ ' Shot + Thermal Noise q h + f i T1 P? T - _ 2.24 χ 10 exp -16
2.1 χ 10 exp -12 + 4.2 χ 10 exp -12
= 0.35 x 10 exp -4
At the output of the radiometer, for 250-sec integration S/N (output) « 0.35 x 10 exp -k*J(lO exp 9) 250
= 3
According to this analysis, no improvement in S/N over that achieved by Forrester would be possible by using a broad band cavity. This is primarily due to the fact that the signal power into the cavity remains the same regardless of band- width, whereas the noise power increases directly with band- width. Thus the increased detectability of the broad band radiometer is effectively cancelled by the deterioration in S/N at the input. In a companion paper, Reisener analyzes the S/N ratio obtainable in a TWT type structure for the mixer tube where the photosensitive cathode initiates the modulated electron beam, which is then focussed and caused to traverse a helix. The front end of the helix is terminated in its
characteristic impedance and the RF energy is coupled from the output of the helix into the radiometer. With such a
structure it is found that the necessary broad band coupling can be attained without any deterioration in the ratio of signal to noise.
Use of Lasers
The use of Lasers in an optical heterodyning system offers interesting possibilities. The benefits are clearly discern- ible in active systems (6) where the monochromatic signal re- ceived from a Laser source can be beaten against a similar but displaced signal from a Laser local oscillator. The extremely narrow band signals permit the use of narrow band detectors in the radio frequency range. Even with natural spectral lines, which are relatively wide, Lasers still offer some distinct advantages. Consider, for instance, the system outlined in Fig. 6.
In this arrangement, either two Lasers with outputs f^ and Î2 or a single tunable Laser could be used for the local
oscillator. The Laser frequencies would be arranged to bracket a spectral line of interest as shown and would be allowed alternately to irradiate a photomultiplier together with the output of a natural line source. The video amplifier passes beat frequency energy lying in a bandwidth W on either side of the Laser output. Other signals in this range caused by beats between the frequency components of the line itself would normally be too small to cause interference. If the energy from the two bands is compared in a synchronous detector, a null will be observed in the output with the lines in the
477
position shown. Any shift in relative position such as that caused by Doppler effects will result in an excess of energy in one or the other of these bands, depending on the direction of movement, which will be recorded in the output. The
chopper-synchronous detector combination affords a degree of freedom from gain fluctuations and changes in signal strength, and the output is proportional to the line shift for small deviations. If the Lasers permit, a feedback path can be added to control the frequency and maintain the output in a null condition. The output of the feedback loop would then become the measure of velocity.
The Laser system considerably eases the bandwidth require- ments of the detection elements and eliminates the need for a high frequency receiver. In all probability, a commercially available photomultiplier would prove adequate for the mixer.
This would not improve the S/N ratio, but it would raise the signal level to the point where receiver or amplifier noise would not be a problem.
CONCLUSIONS
Although the system has not yet been carried to its ultimate detection limit, template spectroscopy has been established as a useful technique for improving the S/N ratio when measuring Doppler shift with low energy sources. Estimates based on the data acquired thus far indicate that relative velocity
measurements down to the order of meters per second will be obtainable with respect to the sun. Stellar sources have yet to be tried.
Optical heterodyning could be employed to shift optical Doppler measurements to the radio frequency range where pre- cision frequency measuring techniques are available. The wide lines of optical spectra, however, necessitate the use of wide bandwidth high frequency equipment and specialized optical equipment to make possible the observation of the beat fre- quency. Without this highly complicated apparatus, the S/N ratios obtainable are too low for reliable measurement. The recent development of the Laser opens the way for improved observability using lower frequency, smaller bandwidth systems, and commercially available photomultiplier s for the mixing element.
ACKNOWLEDGMENT
The authors would like to express their appreciation to D. A. Guidice and W. L. Harmon of Wright Air Development Division for their stimulating discussions and helpful sug- gestions during the course of this investigation.
REFERENCES
1 Franklin, R.G. and Birx, D.L., MA study of natural electromagnetic phenomena for space navigation," Proc. IRE, no. k, 532-541 (April I960).
2 Felgett, P., "A proposal for a radial velocity photo- meter, rT Optica Acta 2, 1, (1955)·
3 "Study of electromagnetic techniques for space navigation,"
Franklin Instit. Quart. Progress Rep. no. Q-A2415-3, Contract no. AF 33(6l6)-7244, Aug. 16 to Nov. 15, I960.
4 Babcock, H.W., "The solar magnetograph," Astrophysics J.
118, 387-396 (Nov. 1953).
5 Forrester, A.T., Gudmundsen, R.A., and Johnson, P.O.,
"Photoelectric mixing of incoherent light," Phys. Rev. 99, 1691-1700 (Sept. 1955)·
6 Forrester, A.T., "Photoelectric mixing as a spectroscopic tool," J. Opt. S o c of Amer. £ 1 , 253-259 (1961).
479
Table 1 Spectral irradiance of some bright stars at 1|000 A (w/cm2/A)
Star Class Vis. Mag.
sX λ^ΟΟΟΑ
Ι Ο "1 6
Sirius AO -1.6 28.0
Canopus FO -0-9 8.9
Ρ centauri Bl 0.9 8.1
Vega AO 0.1 6 . 7
Rigel B8 0.3 6.3
Ache m a r B5 0.6 5.5
Spica B2 1.2 4 . 7
Arcturus KO 0.2 2.3
Altair A5 0.9 2.2
Deneb A2 1-3 1.8
Fomalhaut A3 1.3 1.6
Betelgeuse M2 0.9 . 7 7
Pollux KO 1.2 . 3 7
Sun G2 -26.7 1.5 χ ΙΟ ,11
Table 2 Wavelength shifts and template displacements for various velocity increments
dV (m/sec) 100
1000
ill 3600 4500 3600 4500
dX(A) 0.0012 0.0015 0.012 0.015
dl (mm) 0.0004 0.0002 0.004 0.002
Table 3 Optical heterodyning - beat frequencies for various velocities
Velocity (m/sec) 0
1 10 100 1,000 10,000 100,000
Beat Frequency (mc) 10,000
10,001.67 10,016.7 10,167-0 11,670.0 26,700.0 177,000.0
481
0 2 0 . 4 0 . 6 0 . 8 α (absorption f a c t o r )
1.2
Fig. 1 Velocity errors v se absorption factor for star of irradiance Hsd = 1 χ 10""^ w/cm^ = 0 A by template spectroscopy
-P u
ϋ CD
α CO
-Ρ ο
-Ρ ο
CD CL
CO α;
JH -Ρ •Η
χ ) CD
ω -Ρ
•Ρ CÖ
C p r-t
•Η XÎ a.
(0 CO ϋ 10 CÖ r-» W)
ai CH Ο cö C!
cö Ο
M •Η -Ρ -Ρ
ϋ CÖ
CD -Ρ
a, Ο ω u
ο
W
•Η
P u
485
Λ Λ Λ.
Λ
' \ / \ ' ν ; *
/ w ν ν ν
Figo 5 Oscilloscope traces of Wobbulator signal, a) At match point (western limb); b) at mismatch (center); c) at mismatch (eastern limb)
LASERS
O P T I C A L CHOPPER
f i LASERS iz
SPECTRAL LINE
W « BANDWIDTH OF DETECTION CHANNELS
REFERENCE
f| Off;
S P E C T R A L - L I N E
PHOTOTUBE
Ο
BANDWIDTH AMPLIFIER V I D E O « W ISYNCHR0N0USI DETECTORINTEGRATION CIRCUITS
AND RECORDER
Figo 6 Optical mixing for doppler determination using a laser
"local oscillator"