MONITORING THE ORDER PICKING PROCESSES WITH THE ELLI3 MEASUREMENT TOOL
Prof. Bojan Rosi University of Maribor
Celje, Slovenia
E-mail: bojan.rosi@fl.uni-mb.si Csc Péter Földesi Széchenyi István University
Győr, Hungary E-mail: foldesi@sze.hu
Emőke Ila Baladincz Széchenyi István University
Győr, Hungary Tel.: +36/70-60-28-806 E-mail: emoke.baladincz@gmail.com
Tamás Bódis Széchenyi István University
Győr, Hungary Tel.: +36/70-60-06-035 Mail: bodis89@gmail.com Abstract
Order picking is one of the most time-consuming activities in warehousing. Having appropriate measurements and accurate data about the real time-requests of different operations like travel time, searching and picking time or setup time is inevitable for making the decisions about further logistics process developments. These parameters and the correspondence between them can be unique in each warehouse. We are developing the Elli3 tool for this measurement and monitoring purposes in Szabó-Szoba R&D Laboratory at Széchenyi University Győr. The Android-based Elli3.COM program is running on tablet which is extended by a professional bar-code reader for the automated identification of locations. In our essay we present the first successful application of the Elli3.com tool at a warehousing company.
Key words: order picking, time request measurement
1.INTRODUCTION
Modelling has key role in logistics system design and further development. Based on models and simulations it is easier and cheaper to discover problems and bottle necks of logistics processes. Furthermore these are the only objective methods to find optimal and adaptive solutions, or test the available alternatives. (Bódis at al. 2012)
Every modelling process should start with measurements, when the modelled system, processes, problems and possible bottle necks are measured and get to know. After the modelling it makes the development team able to validate the designed model.
In our essay we present an innovative consultancy cycle and the Elli3 measurement framework what are developed in Szabó-Szoba R&D Laboratory at Széchenyi University Győr. We will concentrate on the measurement of the logistics processes. After describing the Elli3 equipment we will introduce the first successful application at distribution warehouse on the field of order picking. We will present the detailed measurement and evaluation of order picking process as a case study.
2.INNOVATIVE CONSULTANCY CYCLE Figure 1: Consultancy cycle of innovation
Source: Bódis et al. 2012
The measurement and evaluation of the real warehouse is usually the first step of the innovation processes. The deep knowledge of the developed system is essential. It is required to the effective and usable results of the logistics re-engineering processes.
Sometimes the measurements start after an interactive training. The main aim of this previous training is to get to know the actual solutions, processes, best practices and problems together with the partners. They can also realize the importance of innovation.
The interactive training and modelling environment have couple of functions during the innovation cycle, where the plotting board and the computer simulation are synchronised. This is the field of the active cooperation between consultants and partners.
During the detailed modelling processes the consultants make much deeper computer based simulations about the previously prepared and evaluated alternatives. These models are constructed with real scaled layouts and running with detailed programmed algorithms.
These can test long time intervals and computationally intensive solutions. Furthermore it is possible to automatically generate all kind of statistics to compare alternatives.
The innovation and development projects are never linear process. These require continuous feedbacks and round by round development. In my consultancy cycle, each element has two-way cooperation with all of the other elements. Each element has special added value for the processes. The final solution has to work in the simulation model, has to be visible and understandable in the interactive environment and has to be valuable and usable in the real system. The development and the fine-tuning processes are impossible without continuous round-by-round tests and feedbacks. (Bódis at al. 2013)
3.ELLI3 MEASUREMENT SYSTEM
On the way of modelling and simulation the first step is having the appropriate data.
That is why the innovation process starts with the measurement of the actual system. Elli3 is an android based application developed in Szabó-Szoba Laboratory for monitoring the time request of all pre-defined warehouse operations with automatic time stamps. The examination of the workflow display-interface is adapted to the pre-defined actions appears to be measured - the assessor will tap to activate each key, and the device records the sequence of events with timestamps. (Bancsó et al. 2013)
By using our Elli3 tool we can discover many hidden parameters of product and information flow. Based on the results and analysis we can classify the main features of the operations and the product structure.
The Android-based Elli3 applications are running on tablets supported by bar-code reading tools for the automated identification. During the measurement the application is logging the time interval of the previously defined movements (i.e.: searching, counting, administration...). Furthermore it is possible to read any standard barcode to support the later data processing, it makes us able to merge the measured and the partner’s data sources.
In the following chapters, we will describe the general Elli3 framework and the protocol of warehouse measurement.
3.1 The aim of the measurement
The main aim of the measurement is to get experiences about the system characteristics, exact algorithms, collect time requirement and parameters for modelling the measured logistics systems.
The measurement is essential to get the real warehouse model and find easier the problematic aspects of the warehouse.
The proper quality and quantity data processing, discovering the links can give us proposal to create a measurement method. It shows us the time requirement ratio and tells which operation’s optimization is necessary.
3.2 The Elli3 protocol
The measurement is always compatible with the particular warehouse, its process and special problems. After the warehouse is mapped, we make a flow diagram about the system in order to get the total view. This diagram helps us to build up the system. When we have the Elli3 application to the specific warehouse the next step is the testing phase. If something is wrong, we correct it until it will not be completely good.
In the frame of the general measurement process the measurement people follow the operator worker and measure his work. It is important to make sure, do not bother him in his work. Just measure, observe and get detailed information about the process.
3.3 Output and evaluation
During the measurements 2 types of *.csv are generated for each measured event (i.e.:
for each picking process). One of the files contains the logged event with time stamp and interval. The other file contains the read barcodes with time stamps.
Further input data for the analysis are the material data, WMS log files and layout.
The measured data will be merged with the partner’s data sources and analysed the actual logistics system.
3.4 The measured process operation:
Receipt of goods (Elli3.gin)
Homogenization
Store in, upload picking position, over storing to the picking position (Elli3.sin, Elli3.uld)
Picking (Elli3.com)
Palletisation
Final control (Elli3.fin)
The previously assumed context regarding to the “loading of goods” processes (homogenization, to storage, order picking, assembling)
The operation time is depends on the quantity specifics:
o Number of pieces
o Collection unit (the collector volume or per unit can be met)
The operation time is depends on article characteristic
o Entity/Unit (collectively or pieces) geometrical dimension (volume, aspect ratio)
o Unit weight
o Unit manageability, tangibility, etc.
The operation time is depends on storage space features o Storage space level
o Availability of storage space
4. CASE STUDY OF ELLI3.COM APPLICATION
We measured the picking process in a distribution warehouse, and we used the Elli3.Com application what we adapted to the given warehouse process.
The basic warehouse operations depend on the actual physical conditions, characteristics, but also on the degree of correlation. The individual factors are not known, in different warehouses it can be substantially different. The measurement perform is indispensable because the simulation program runs during these basic operations occur in great numbers, and if the estimated data its incorrect, the accuracy of the simulation can significantly reduce.
Order picking has long been/has been long time identified as the most labour-intensive and costly activity for almost every warehouse; the cost of order picking is estimated to be as much as 55% of the total warehouse operating expense. Any underperformance in order picking can lead to unsatisfactory service and high operational cost for the warehouse, and consequently for the whole supply chain. In order to operate efficiently, the order-picking process needs to be robustly designed and optimally controlled. (Koster et al. 2007)
Order picking is one of the most time-consuming activities in warehousing. Having appropriate measurements and accurate data about the real time-requests of different operations like, travel time, searching and picking time or setup time are necessary for making the decisions about further logistics process developments. These parameters and the correspondence between them can be unique in each warehouse.
The order picking time is influenced mainly by moving, searching, picking and unit load building time. According to the scientific literature the most crucial parameter is the travelling time, which gives the 50% of the whole picking time. (Koster et al. 2007) Figure 2: Time distribution of order picking movements
Source: Chan et al. 2011
First of all we investigate the picking processes to see the global view, and we made the flow chart about the process. The exact description of the process played an important role in the preparation of the application.
Figure 3: The picking flow diagram sample
Source: Baladincz et al. 2013
In the Elli3.COM measurement application we separate the processes about the commonly used terminology: Travel (transport, travel, motion) , Pick ( picking), Search ( search, identification), Setup ( palletisation) and Other.
The picking worker get the picking list and with the jet (automatic pushcart) he will go and pick all the goods what he has on the picking list. When he finished he should put the pallet with the goods in the control area.
Figure 4: Main screen of Elli3.COM
Source: Baladincz et al. 2013
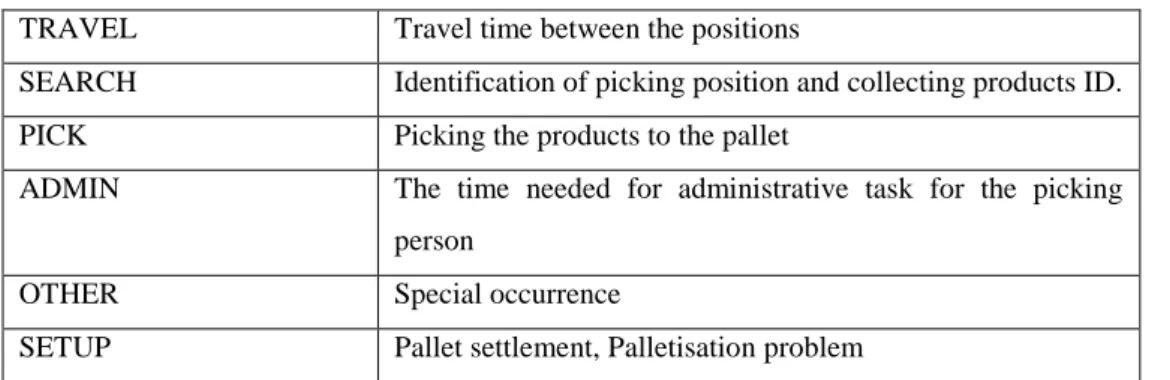
In the following table you can find the meaning of the buttons which are in the main screen:
Table 1: Functions of the main screen
TRAVEL Travel time between the positions
SEARCH Identification of picking position and collecting products ID.
PICK Picking the products to the pallet
ADMIN The time needed for administrative task for the picking person
OTHER Special occurrence
SETUP Pallet settlement, Palletisation problem 4.1 Elli3.COM case study
4.1.1 General functions PLAY-PAUSE-STOP
Always start the measurement by pressing the Play button
With press the play button the picking list extracting time will be recorded
It is appropriate to use, if the measuring person make an mistake during date capture ( for example he forget to push the picking button, he made an error he pushed the wrong button, ect.)
When you touch the pause button the Csv files will stopped automatically and when you will touch the play button new Csv file will start. (file name will be quite the same just the new file name will get an “-2” number on the end.
To stop the measurement process you have to press the Stop button
The related operations Csv and Barcode Csv files are prepared and closed RECORD
Voice record function
During the picking is something irregular happening , the assessor person has to push the record button to record the voice, and he have to tell everything about the irregular event because it is important in the evaluation.
To stopped the record you have to touch one more time the record button
The files are saved with time stamp into the measuring device memory, so the valuation of the picking task can assigned clearly
Identification of the elementary picking process
TRAVEL
Travel, transportation time spent between the picking positions - Pressing the button once to start operation, travel shows, any other operation button will automatically mean the end of the operation, Travel
The start of the operation when the machine start to the picking area to halt until the target position
SEARCH
Usually is recorded after the Travel button, but it may happen that with one stop the picking person can pick two or more items so doesn’t have to move the jet because the picking positions its really near each other.
The search operation start with the identification of picking position and ends with the collecting products ID.
PICK
Normally, the Search process begins with the completion of the last pallet put into picking product lasts
When the picking warehouse colleague has a space and staff product knowledge thanks to the Search operation is very short (less than or completely), it may, after the operation Travel - Search for skipping - Pick will be recorded
The picking of the tablets recording the position data via Bluetooth barcode reader attached to Pick validation process takes place after that.
ADMIN
The time needed for administrative task for the picking person
Administrative task can be indication of the performance of the picking list or includes the study of the pick list to select the next picking position
The admin process is start when picking person pick up a pen and finish when put down for his hands the pen and the picking list
Equally important to record the time needed for administrative tasks - these tasks can be marked in the performance of the picking list or pick list includes the study of the next picking position to select
OTHER
Here are recorded the previous operations not falling within the scope of activities, such as the inclusion of pallets or pallet placement of the manipulation of the collected background
SETUP
The time what you spent with the palletisation and rearrange stack.
4.2. Data Processing
The Elli3 software records the time-stamped data to the dedicated folders on the tablets by three forms:
start and duration of the operations edited by the screen (travel, search, pick, admin, setup, other, in 'csv' extension)
the involved storage IDs during the picking is sent by barcode readers via bluetooth connection (in 'csv' extension)
specific additional information - needed for later evaluation ( in '3gp' format) The evaluation is based on the several measurement day with different occupation.
4.3. Sorting the input data
The created files (picking list) by Elli3.COM application (processes and positions codes) are copied to a worksheet
We filter the picking operations in a separate column and colligate with the appropriate storage IDs from the list registered by the barcode readers (in case of divergence we clarify with the help of voice files and printed picking lists)
We assign the paper based invoice codes with the appropriate worksheet
We transform the received data tables for further processing (clustering and processing input data)
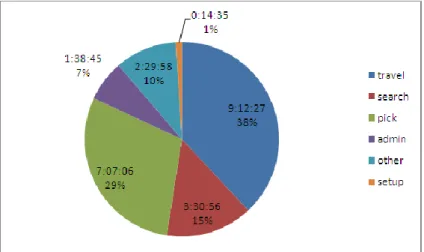
4.5. Comparison of the proportions of picking operations
sum up the time spent on each elementary operations, and the occurrence of operations, sort by the picking lists into a tables
The following graphs are created as a sample:
The left graph shows the time-consumption, the right shows the frequency of elementary operations.
Figure 5: Elli3.COM Time-share of elementary operations
Source: Baladincz et al. 2013
Figure 6.: Elli3.COM Frequency of elementary operations
Source: Baladincz et al. 2013
The proportion of PICK/SEARCH, SEARCH/PICK, PICK/ADMIN and ADMIN/PICK operations are demonstrated on the bar graphs below.
Figure 7: Pick/Admin proportions
Source: own study
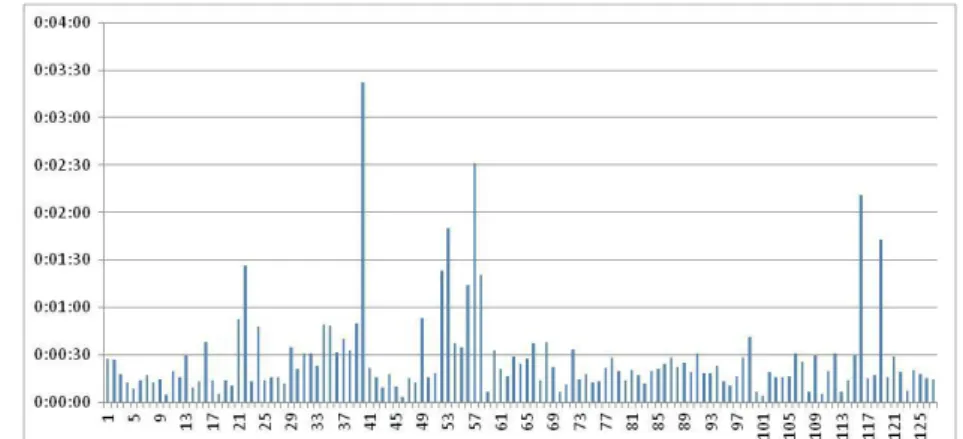
Figure 8: Average PICK time
Source: own study 4.6. Partition
We arrange the duration of operations in a summary worksheet
We sum up the occurrence of each operations
The next sample graphs show the allocations of particular operations
For the better understanding we transform the tablets into the appropriate scales
For example the green cell shows the PICK operation with the duration between 5-10 seconds has been registered 230 times
Figure 9: Allocation of time-consumption in Pick operations
Source: Baladincz et al. 2013
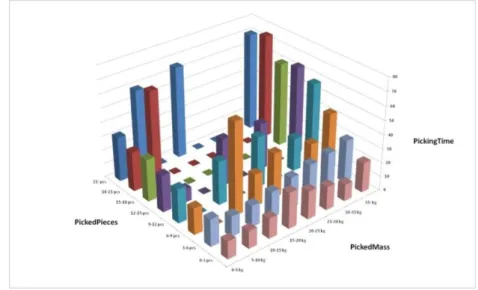
4.7. Forming typical operation clusters
We form the clusters based on the quantity and weights for analyze the picking specification
We integrate the different weights and the palletisation properties into the list of item numbers (the database we received from the partner)
Sum up the total moved mass in kilograms by picking tasks
We perform the clustering with the method described in the previous paragraph considering the number of items and the mass
Using the database functions we create statistical indicators according to the clusters (mean, median, mode, range, standard deviation, variation)
From the obtained value we form a 3D graph:
Figure 10: Average picking time value by the recorded clusters regarding to the collected quantity and total weight
Source: Baladincz et al. 2013.
Figure 11: Amount of measured data in clusters
Source: Baladincz et al. 2013.
5. CONCLUSION
In this paper we presented the Elli3 application, which is good for measuring order picking processes in a warehouse. We showed a case study about a measurement made at a warehousing company in Hungary.
After the measurement we could see the time request of the elementary order picking operations and the time consumption of the operators among others. We evaluated the average picking time of the clusters we made from the collected data.
In the future we will extend the Elli3 monitoring applications in manufacturing and further logistics processes.
6. ACKNOWLEDGEMENT
This research was supported by the European Union and the State of Hungary, co- financed by the European Social Fund in the framework of TÁMOP 4.2.4. A/2-11-1- 2012-0001 ‘National Excellence Program’.
7.REFERENCES:
1. K. Rózsa Bancsó, T. Bódis, P. Bajor: Learning-by-doing modelling and simulation of warehousing processes in the WaNDa environment; Recent advances in agriculture, mechanical engineering and waste policy – International student scientific conference;
Nyitra-Slovakia; 22th-23th April, 2013
2. E. Ila Baladincz, T. Bódis: Development of the Elli3 tool for monitoring order picking process; XXXI. National Scientific Conference for Students; Kecskemét-Hungary;
24th-26th April, 2013
3. T. Bódis, K. Vöröskői, S. Trafela, Prof. P. Földes, Prof. B. Rosi: Innovative solutions for modelling warehouse activities in the WaNDa QRea environment; The 9th International Conference on Logistics & Sustainable Transport, Celje-Slovenia, 14th- 16th June, 2012
4. Felix T.S. Chan, H.K. Chan: Improving the productivity of order picking of a manual- pick and multi-level rack distribution warehouse through the implementation of class based storage, Expert Systems with Applications 38 (2011) 2686–2700
5. R. de Koster, T. Le-Duc, K. J. Roodbergen: Design and control of warehouse order picking: A literature review; in. European Journal of Operational Research 182 (2007) 481–501, doi:10.1016/j.ejor.2006.07.009