CONSISTENT POVERTY ACROSS THE EU
ANNA B. KIS – ANDRÁS GÁBOS1
ABSTRACT This paper investigates consistent poverty, defined as living at the risk of both income poverty and material deprivation. Using EU-SILC data from 2012 we analyze patterns of consistent poverty across EU member states and the main individual and household-level factors predicting this status. Our results show that consistent poverty is present in all Member States, although there are fairly large cross-country differences in its extent. The share of those living in consistent poverty is highest in the New Member States and the Southern countries. Living in consistent poverty is associated with several household characteristics. Those living in consistent poverty are more likely than those in severe material deprivation or income poverty to live in bigger families, to have lower levels of education, and to have weak or non-existent links to the labor market. In addition, they evaluate their financial circumstances as being worse, ceteris paribus.
KEYWORDS: poverty, material deprivation, consistent poverty, EU2020, EU-SILC
1 Anna B. Kis is research assistant, András Gábos is senior researcher at TÁRKI Social Research Institute (emails: anna.bkis@tarki.hu; gabos@tarki.hu)
INTRODUCTION
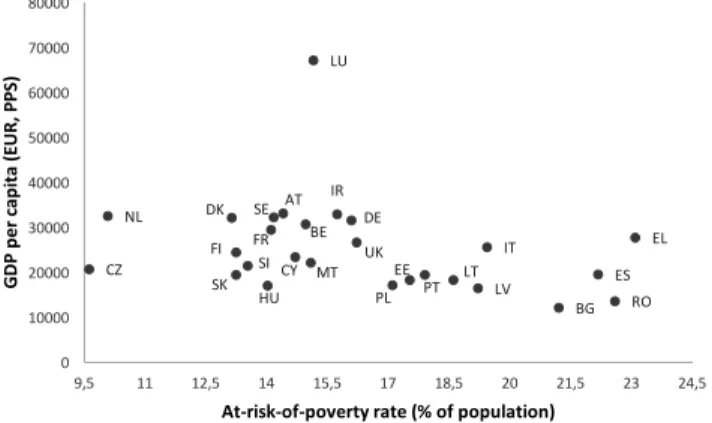
One of the recent challenges in conceptualizing and measuring poverty in Europe as a whole lies with the considerable cross-country disparity in living standards and in the scope of social policy in this field.2 While the structure of income inequality (and consequently, the risk of relative income poverty)3 shows greater variation within the groups of Old and New Member States than between those country clusters, the material deprivation rate4 reflects the disparities in the income levels of countries much more strongly than the at-risk- of-poverty rate does. Figures 1 and 2 clearly indicate the difference between the overall distributions of these two measures plotted against GDP. The negative correlation between GDP per capita and the at-risk-of-poverty (AROP) rate–an indicator based on national median income–in the EU Member States is weak:
New Member States can be found in each part of the AROP country ranking.
2 Research for this paper has benefited from financial support from the European Union’s Seventh Framework Programme (FP7/2012-2016) under grant agreement No. 290613 (ImPRovE: Poverty Reduction in Europe: Social Policy and Innovation; http://improve-research.eu).
2 We would like to thank Bea Cantillon (Herman Deleeck Centre for Social Policy) for her comments on the draft version of this paper. We are also grateful to Karel Van den Bosch (Herman Deleeck Centre for Social Policy) and participants at the ImPRovE Meeting in Budapest (November 2014) for their useful comments. We also acknowledge the assistance provided by Klára Gurzó in the early phase of the work. Any errors or misinterpretations are our own.
3 An individual is defined as living at risk of poverty if he or she lives in a household with an equal- ized disposable income (after social transfers) below the poverty threshold, which is set at 60% of the national median equalized disposable income. That is, poverty is defined in relative terms, and every year a different threshold is defined in each country.
4 Material deprivation is defined as the inability of the household to afford at least three of the fol- lowing items: (i) to avoid arrears in rent, mortgage or utility bills; (ii) to keep the home adequately heated; (iii) to face unexpected expenses; (iv) to eat meat or proteins regularly; (v) to go on holiday;
(vi) to have a television set; (vii) to have a washing machine; (viii) to have a car; (ix) to have a telephone. Severe material deprivation occurs when the household cannot afford at least four of the nine items listed above. The term ‘material deprivation’ is also used in this paper to describe the phenomenon in general, while ‘severe material deprivation’ is used in relation to the indicator itself.
Figure 1. At-risk-of-poverty rate (%) and GDP per capita (EUR, PPS) in the EU Member States, 2012
Source: authors’ figure based on EU-SILC 2012 and Eurostat 2012.
Notes: PPS – purchasing power standard. For the definition of relative income poverty, see footnote 3.
Figure 2. Severe material deprivation rate (%) and GDP per capita (EUR, PPS) in the EU Member States, 2012
Source: authors’ figure based on EU-SILC 2012 and Eurostat 2012.
Notes: PPS – purchasing power standard. For the definition of severe material deprivation, see footnote 4.
When social inclusion was identified as one of the main pillars of the Europe 2020 strategy,5 the European Union adopted a multidimensional concept of
5 European Commission (2010).
AT BE
BG CZ CY
DK DE
EE ES
FI FR EL
HU IR
IT LT LU
MT LV NL
PL PT
RO SE
SI SK
UK
0 10000 20000 30000 40000 50000 60000 70000 80000
9,5 11 12,5 14 15,5 17 18,5 20 21,5 23 24,5
GDP per capita (EUR, PPS)
At-risk-of-poverty rate (% of population)
AT BE
BG CZ CY
DKDE
ES EE
FI FR GR
HU IR
IT LT LU
LV MT
NL PT PL
RO SE
SI SK
UK
0 10000 20000 30000 40000 50000 60000 70000 80000
0 5 10 15 20 25 30 35 40 45 50
GDP per capita (EUR, PPS)
Severe material deprivation rate (% of population)
poverty in order to define a target for reducing the number of people living in poverty or social exclusion. The chosen indicator is based on a union approach6 and considers an individual to be living in poverty or social exclusion if he or she lives in a household affected by any of the following three risks: income poverty, severe material deprivation or low work intensity (European Commission 2010).
Among other literature, recent work by Nolan and Whelan (2011a,b), Copeland and Daly (2012), and Maître et al. (2013) discusses extensively the theoretical and policy implications of defining a single European-level target for combating poverty and social exclusion that is based on a multidimensional approach.
Transcending the unidimensional concept of income is largely acknowledged (Nolan and Whelan 2011b; Hick 2012a; Decancq et al. 2013) to be an improvement in monitoring poverty and social exclusion in an enlarged Europe. However, the method used to define it comes in for criticism in many respects. From the point of view of this paper, the most important criticism relates to the use of the union approach instead of the overlap approach (Nolan and Whelan 2011a,b).
The ambition of capturing the most deprived in an EU-wide framework, as well as dealing with the double (national and EU-level) benchmark has resulted in several proposals for combining relative income poverty with material deprivation based on an overlap instead of a union approach (Förster et al. 2004;
Nolan and Whelan 2011a,b; Whelan et al. 2008; Whelan and Maître 2010). Nolan and Whelan (2011b), for example, discuss the overlap approach, which better identifies those most in need from a poverty-reduction perspective (Nolan and Whelan 2011b).
From a conceptual point of view, the concept of consistent poverty can be seen as an attempt to reconcile the previously dominant resource-based approach to defining and measuring poverty with more recent attempts to define poverty in a much broader way and place stronger emphasis both on the multidimensionality of the problem and on the societal outcome, described most often by the term
‘social exclusion’. While the former approach is exclusively based on income, the latter is more complex and includes initiatives based on the adequacy of income, on needs and on the capabilities of individuals to participate in society (e.g. Sen 1989), as well as that of material deprivation (which concept is rooted in the work of Townsend 1979).
Our paper aims to contribute to this debate by focusing on the factors which help differentiating between consistent poverty (as a measure of the overlap
6 When a composite of individual indicators is applied, the union approach defines the population at risk as being affected by any of the individual risks (this is the case for the EU2020 social inclusion indicator). By contrast, the overlap approach defines the population at risk as those affected by all the individual risks together.
approach) and other forms of poverty. We follow the proposal of Nolan and Whelan (2011a,b) in measuring consistent poverty in the European Union. The concept of consistent poverty, as conceived by Nolan and Whelan (2011a), is captured by two of the three indicators of poverty and social exclusion (EU2020 poverty target indicator): the risk of living in relative income poverty, and the risk of severe material deprivation. Specifically, we are interested in:
(i) how the incidence of consistent poverty varies across EU Member States, (ii) what socio-economic factors predict living in consistent poverty, rather
than living either in income poverty or in material deprivation only.
In this paper we focus on the relationship between the relative income and the material deprivation concepts of poverty by identifying the main individual and household-level factors that affect the simultaneous occurrence of both (consistent poverty), compared to exclusive forms of poverty (being either at risk of income poverty or at risk of material deprivation). While previous research has concentrated more on the factors that differentiate between those living in consistent poverty and all others, our analysis also looks at factors that increase the risk of consistent poverty compared to the risk of income poverty only or material deprivation only. In terms of policy and monitoring, the paper is designed to provide input to help select lead poverty and social exclusion indicators in Europe, and also reflects on proposals by Noland and Whelan (2011a), and Notten (2015). The paper relies on timely data (from the EU-SILC 2012 wave), providing a cross-country comparative analysis for the EU-27 member states, either at a country (using descriptive statistics) or country group-level (using descriptive statistics and multivariate analysis).
In what follows, we first briefly overview the most important conceptual and methodological issues related to consistent poverty. Section 3 presents the data and methodology we use in the analysis, while Section 4 describes the empirical results: the main descriptive statistics and the results of the multivariate analysis on EU and national-level factors associated with consistent poverty. Section 5 concludes.
CONCEPTS, MEASURES AND RESEARCH QUESTIONS
The rationale behind the EU’s multidimensional poverty definition is not only conceptual but is also largely based on the importance of capturing cross-country differences in living standards. At the same time, politics have also played a role, since Member States arrived at a compromise that permitted the constitution of
this broad definition of poverty. Nolan and Whelan (2011a,b) argue that the use of a combined approach with multiple aspects is a great step forward in terms of the elaboration of an EU-wide measure. However, they criticize both the lack of an adequate explanation for the adoption of this definition and the methodology that was applied in its construction.
Although no theoretical work concerning the relationship between income poverty, material deprivation and low work intensity preceded the adoption of the target, it was clearly connected to intensive conceptual and methodological work that concerns multidimensional poverty in general, and the topic of material deprivation in particular (e.g. Förster et al. 2004; Guio 2009; Nolan and Whelan 2011a,b). This line of analytical research is aimed at transcending the solely income-based concept of poverty and tries to develop valid and reliable indicators of the multidimensional concept of poverty. On the other hand, the decision to use a composite poverty and social exclusion indicator in itself generated much interest in terms of the analysis and refining of the component measures (e.g. Decancq et al. 2013; Guio and Marlier 2013; Nolan and Whelan 2011b; Israel and Spannagel 2013; Ayllón and Gábos 2015).
As a consequence of the union approach, the EU target remains very broadly defined. The danger of such a broad definition is that it is much more complicated to interpret and is much less accurate in determining those at highest risk (that is, who are most in need). With this in mind, Nolan and Whelan (2011a) suggest using alternative measures of poverty and social exclusion based on the consistent poverty approach (as also proposed by Notten 2015), relying on measures of relative income poverty and material deprivation. They introduce three alternative measures based on the overlap approach, where the combination of being at risk according to several measures is used to define the target group.7 This way, they argue for a measure which combines a unidimensional concept of poverty (relative income poverty) with a multidimensional one (material deprivation), since its use provides an opportunity to combine national and EU-level poverty thresholds. They also argue that income poverty and material deprivation complement each other in a beneficial way: while income poverty directly measures the input side of
7 Some scholars argue for an even broader concept of multidimensional poverty based on Amartya Sen’s capability approach (Hick 2012). Hick argues that an assessment of material deprivation requires making a lot of assumptions in itself, which may not be the case with the capability ap- proach where the broader dimensions may be agreed on. At the same time, he argues that the weight given to material deprivation and income poverty should not be the same. As material deprivation captures broader aspects of poverty, especially in the capability framework, the author suggests that greater relative importance should be assigned to material deprivation when we define consistent poverty (Hick 2012a).
the financial situation of households, material deprivation is correlated to the ability to make ends meet, capturing a subjective evaluation of poverty.
The three alternative measures are as follows (Nolan and Whelan 2011a: 129):
(i) national consistent poverty (NCP) – constructed by choosing a deprivation threshold at the national level that identifies the fraction of the population that corresponds as closely as possible to that identified by the threshold of 60% of median equalized household income;
(ii) EU consistent poverty (EUCP) – those identified as being both at risk of poverty, according to the EU threshold, but above the deprivation threshold that identifies the fraction of the population as close as possible to that found below the corresponding income threshold;
(iii) Mixed-level consistent poverty (MCP) – combines income information at the national level with information relating to consumption deprivation at the EU level.
The authors argue for the use of MCP, instead of the measure adopted by the European Union (Nolan and Whelan 2011b).
DATA AND METHODS
As income poverty and material deprivation are assumed to capture different aspects of poverty, they may also be expected to identify fairly different population groups at risk of poverty. In the following, we analyze patterns of consistent poverty across EU member states by distinguishing between four possible combinations of income poverty and severe material deprivation status:
not at all at risk; at risk of income poverty only; severely materially deprived only; and living in consistent poverty. Further, multivariate regression analysis is performed to identify the main individual and household-level factors that predict consistent poverty status (defined as the overlap between income poverty and severe material deprivation).
The cross-sectional EU-SILC database serves as the data source for our analysis. EU-SILC (European Statistics on Income and Living Conditions) is the reference source for comparative statistics on income distribution and social inclusion in the European Union. EU-SILC was launched in 2003 and provides both cross-sectional and longitudinal annual data. The reference population in EU-SILC includes all private households living in EU member states. We perform all types of analysis using Stata statistical software using 2011 as the income reference year (2012, according to the Eurostat protocol).
We use the following groups of countries based partly on geographical considerations, but also in strong correspondence with the usual welfare regime type classification found in the literature (Esping-Andersen 1993; Ferrera 1996):
• Continental countries: Austria, Belgium, France, Germany, Luxembourg and the Netherlands;
• Nordic countries: Denmark, Finland and Sweden;
• English-speaking countries: Ireland and the United Kingdom;
• Southern countries: Cyprus, Greece, Italy, Malta, Portugal and Spain;
• New Member States: Bulgaria, Czech Republic, Estonia, Hungary, Latvia, Lithuania, Poland, Romania, Slovakia and Slovenia.
Our main objective is to identify individual and household characteristics that differentiate between different poverty states. We use logit regressions with robust standard error estimation (observations clustered by households) with country fixed-effects.
In our regressions, the dependent variable is consistent poverty (CP). We consider a household to be living in consistent poverty if that household is at risk according to both poverty measures: if its members are severely materially deprived and live below the at-risk-of-poverty threshold. We compare those in consistent poverty with three different reference groups in three different models.
Model 1 compares those living in consistent poverty (AROP=1, SMD=1) to those not at all at risk (AROP=0, SMD=0). Model 2 compares those in consistent poverty to those only deprived (AROP=0, SMD=1), while Model 3 compares this group to those only at risk of income poverty (AROP=1, SMD=0).
(1) CPi = β0 + β1*Zi + β2*country groups + ui, where
– Z: vector of household-level controls for sex, age, education of the household head, work intensity8 and urbanization density of the households, inability to make ends meet (IMEM) – Country groups: New Member States, English-speaking, Continental, and Southern coun-
tries; reference group: Nordic countries.
8 Household work intensity (WI) is the average of individual work intensities in a household. In- dividual work intensity is the ratio of the number of months worked by a working-age household member during the income reference period to the number of months he or she could theoretically have worked. The ratio as a continuous measure ranges from 0 to 1, but we transformed it into a five-category variable for use in our regression analysis: 1 if the value of WI is lower than 0.2; 2 for values between 0.2 and 0.45; 3 for values between 0.45 and 0.55; 4 for values between 0.55 and 0.85; and 5 for values over 0.85.
EMPIRICAL RESULTS
The incidence of consistent poverty in Europe
Investigating the relationship between income poverty and severe material deprivation, we distinguish four categories in the population: (i) not at risk of poverty at all; (ii) at risk of income poverty only; (iii) at risk of severe material deprivation only; and (iv) at risk of consistent poverty.
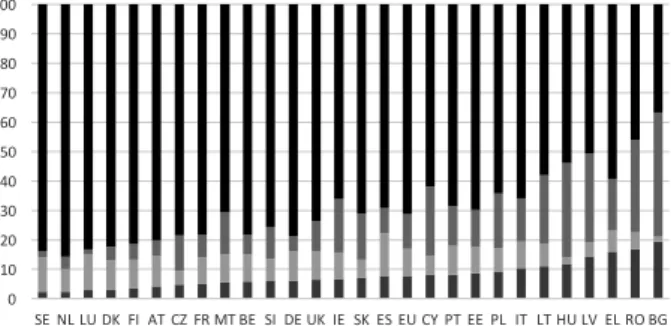
Figure 3 displays the distribution of the population across these poverty statuses in 2012 on a country basis. It can be seen that consistent poverty is present in all Member States, while the share of those living in consistent poverty is highest in the New Member States and the Southern countries. The distribution of consistent poverty across countries is relatively strongly correlated with the distribution of those not at all at risk: a higher rate of being at risk is associated with higher rates of consistent poverty. Countries with a low at-risk population and hence low consistent poverty usually include the Nordic and Continental Member States, while countries with the highest at-risk population and the highest consistent poverty rates are the New Member States and the Southern countries. We can clearly see that variation in the ‘at risk of poverty only’ rates is much lower across countries than it is in the ‘severely materially deprived only’ rates. However, while this relationship between different poverty statuses is dominated by income poverty status in the Southern countries, the same role is attached to material deprivation status in the New Member States.
Figure 3. Consistent poverty in EU Member States, 2012 (%)
Source: authors’ figure based on EU-SILC 2012.
0 10 20 30 40 50 60 70 80 90 100
SE NL LU DK FI AT CZ FR MT BE SI DE UK IE SK ES EU CY PT EE PL IT LT HU LV EL RO BG Poor, deprived Poor, not deprived Not poor, deprived Not poor, not deprived
Multivariate analysis
In this section we look at how those living in consistent poverty differ from others in terms of the main socio-economic characteristics of the households they live in. In accordance with the identification presented in Section 3, we apply three types of logit regression models to compare those living in consistent poverty with individuals (i) who are not at all at risk (Model 1), (ii) who are living in severe material deprivation only (Model 2) and, (iii) who are living at risk of income poverty only (Model 3).
All regression models include the individual and household characteristics we are interested in and which are observable in the dataset: sex, age of the household head (and its squared term), household structure, highest level of education attained by the household head, work intensity of the household, the degree of urbanization of the settlement the members of the household live in and the inability of the household to make ends meet. The inclusion of the latter is supported by findings from the literature with respect to the subjective character of the material deprivation indicator (e.g. Crettaz and Sutter 2013, McKnight 2013). This subjective measure can therefore serve as a potential control for country-specific heterogeneity in terms of perceptions (cultural differences).
Country groups are included first as fixed effects, with the Nordic countries acting as the reference category; then, as a second step, separate regressions are run for each country group. The main results are reported in Table 1.
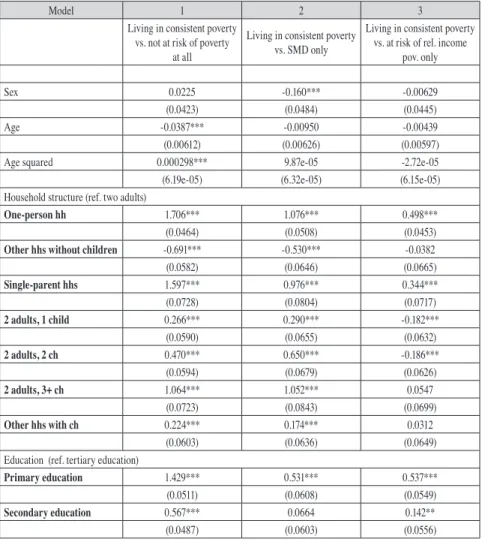
In Model 1, the coefficients of household-level controls usually have the expected sign, indicating that the risk of living in consistent poverty (i.e. being both at risk of income poverty and severely materially deprived) compared to not being at risk at all is associated with low-status household characteristics in general, although important cross-country differences may occur (the discussion of which is outside the scope of this paper). There is no significant difference between male- and female-headed households, all other variables being held constant. Age seems to have a non-linear (U-shape) negative effect on being in consistent poverty. Apart from single-adult households, all household types are significantly more likely than two-adult families to live in consistent poverty.
Having a household head with lower than tertiary education also significantly increases the risk of a household being in consistent poverty relative to households not being at all at risk. Similarly, living in a less urbanized area or living in a family where there are fewer than two full-time working adults makes the household more likely to be at risk of consistent poverty, all other controls being held constant. An inability to make ends meet is associated with an increase in the probability of being at risk of consistent poverty, all other variables being equal.
Looking at the effects of the country-group dummies, living in either a New Member State, a Southern, a Continental or an English-speaking country (rather than a Nordic country) significantly increases the probability of living in consistent poverty. This relationship holds in the strongest way for living in a New Member State, and (to a somewhat lesser degree), in a Southern country. The effect of IMEM (assessed by comparing the presented results with an alternative specification in which IMEM is dropped) appears to be sizable in New Member States and Southern countries, where these effects were the highest of all country groups. This result supports the inclusion of IMEM as a control variable and indicates the presence of a country-group specific component in material deprivation. Whether this component can be interpreted as representing cultural differences in perceiving and reporting financial difficulties across societies should be the subject of further investigation.
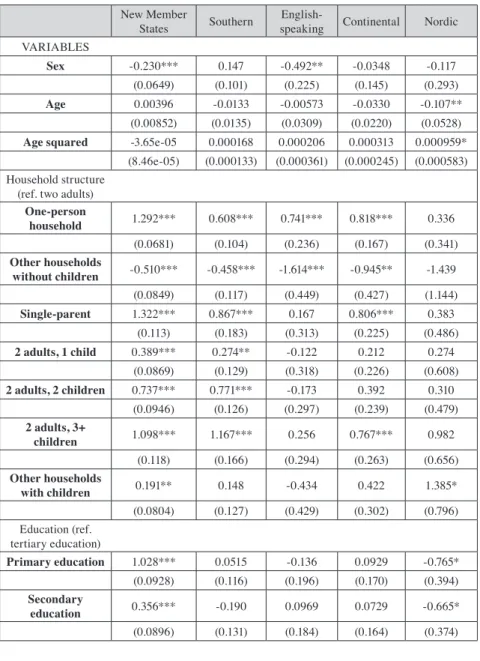
In Model 2, we compare those at risk of consistent poverty to those who are severely materially deprived only. In general, the household-level characteristics correlated with the odds of living in consistent poverty, rather than being SMD only, are similar to those observed in Model 1. However, the estimated effects of country-group dummies differ slightly from what was observed in Model 1. Compared to the Nordic countries, living in a New Member State does not significantly increase the probability of being at risk of consistent poverty vs.
being severely materially deprived only. This may be explained by the fact that in the New Member States the proportion of the latter group is considerably higher than that of the former. The estimated coefficients for the Southern and the Continental countries have a similar sign to previous models, but the magnitude of the coefficients is much smaller.
In Model 3, we find that the age of the household head is no longer significant in explaining the differences, and nor is living in a middle-urbanized area or in a rural area. All other variables have the expected signs, similar to those in previous models. The magnitude of the estimated coefficients is the smallest of the three models, indicating that those living in consistent poverty are more similar (in terms of their socio-economic characteristics) to those living in income poverty only than to those who are severely materially deprived only.
The odds of living in consistent poverty vs. in income poverty only are higher for those living in any of the identified country groups than in the Nordic countries, ceteris paribus. These odds are highest, as expected, in the Central and Eastern European countries.
Inability to make ends meet is indeed significant and is associated with a higher probability of being at risk of consistent poverty in all models. Importantly, the introduction of the IMEM variable (compared to an alternative specification without) results in a considerable decrease in the estimated coefficients in the
Southern and English-speaking countries, as well as in the New Member States, but not in the Continental countries. This indicates that the estimated coefficients of the country-group dummies include an effect that is strongly correlated with how households subjectively assess their own objective financial circumstances, but that effect is not present in the Continental countries.
Table 1. Results from logit regressions comparing consistent poverty to those not at risk (Model 1), to those only at risk of SMD (Model 2) and to those only at risk of poverty (Model 3)
Model 1 2 3
Living in consistent poverty vs. not at risk of poverty
at all
Living in consistent poverty vs. SMD only
Living in consistent poverty vs. at risk of rel. income
pov. only
Sex 0.0225 -0.160*** -0.00629
(0.0423) (0.0484) (0.0445)
Age -0.0387*** -0.00950 -0.00439
(0.00612) (0.00626) (0.00597)
Age squared 0.000298*** 9.87e-05 -2.72e-05
(6.19e-05) (6.32e-05) (6.15e-05)
Household structure (ref. two adults)
One-person hh 1.706*** 1.076*** 0.498***
(0.0464) (0.0508) (0.0453)
Other hhs without children -0.691*** -0.530*** -0.0382
(0.0582) (0.0646) (0.0665)
Single-parent hhs 1.597*** 0.976*** 0.344***
(0.0728) (0.0804) (0.0717)
2 adults, 1 child 0.266*** 0.290*** -0.182***
(0.0590) (0.0655) (0.0632)
2 adults, 2 ch 0.470*** 0.650*** -0.186***
(0.0594) (0.0679) (0.0626)
2 adults, 3+ ch 1.064*** 1.052*** 0.0547
(0.0723) (0.0843) (0.0699)
Other hhs with ch 0.224*** 0.174*** 0.0312
(0.0603) (0.0636) (0.0649)
Education (ref. tertiary education)
Primary education 1.429*** 0.531*** 0.537***
(0.0511) (0.0608) (0.0549)
Secondary education 0.567*** 0.0664 0.142**
(0.0487) (0.0603) (0.0556)
Work intensity (ref: WI>0.85)
WI<0.2 3.133*** 2.164*** 0.767***
(0.0422) (0.0513) (0.0493)
WI=0.2–0.45 2.571*** 1.593*** 0.538***
(0.0592) (0.0674) (0.0663)
WI=0.45–0.55 1.411*** 0.920*** 0.219***
(0.0523) (0.0624) (0.0642)
WI=0.55–0.85 0.587*** 0.190*** 0.0831
(0.0617) (0.0703) (0.0738)
Elderly households 0.195*** 0.190*** -0.00901
(0.0306) (0.0375) (0.0373)
Settlement (ref: densely populated area)
Intermediate area 0.126*** 0.0875* 0.0478
(0.0413) (0.0454) (0.0450)
Thinly pop. area 0.491*** 0.612*** -0.0372
(0.0351) (0.0400) (0.0382)
IMEM 2.628*** 0.464*** 1.863***
(0.0323) (0.0352) (0.0341)
Welfare state typology (ref: Scandinavian)
New MSs 2.044*** 0.120 1.902***
(0.100) (0.145) (0.0962)
Southern 1.159*** 0.309** 0.834***
(0.103) (0.148) (0.0998)
Continental 0.791*** 0.431*** 0.610***
(0.107) (0.156) (0.103)
English-speaking 0.685*** -0.507*** 0.770***
(0.124) (0.166) (0.116)
Constant -6.627*** -2.219*** -3.253***
(0.188) (0.216) (0.175)
Observations 463,629 59,550 84,610
Source: own calculations based on EU-SILC 2012.
Note: robust standard errors in parentheses. *** p<0.01, ** p<0.05, * p<0.1.
According to our estimates for the EU as a whole (presented above), the correlation of the main socio-economic characteristics to the risk of living in consistent poverty (compared to being at risk of income poverty only or of living in severe material deprivation only, as well as to not being at risk of poverty at all) create clear patterns which are more or less similar across these models. It is less obvious, though, how these relationships vary by country group. This is what we try to shed light on in the following. Country group-specific results based on Models 1, 2 and 3 are presented in Tables A1–3 of the Appendix.
As Table 2 shows, many factors have an independent effect on the probability of living in consistent poverty, compared to not being at risk of poverty at all.
Among these, household structure, level of education of the household head, and work intensity of the household are most strongly correlated with consistent poverty status. Although the estimated effect of these factors can be seen as general across the whole of Europe, some cross-country group variation exists.
Most notably, one can observe that in the Southern countries, the New Member States and the Continental countries, all (or almost all) estimates are significant at the 95% level. In the Nordic countries, however, the estimates for education and for a few household type categories do not prove statistically significant. We also find that consistent poverty is associated with living in urban areas in the Continental and English-speaking countries, but with living in rural areas in the New Member States and the Southern countries.
Further findings provide a few clear messages about the main factors and their relative importance across country groups of living in consistent poverty, compared to living in a unidimensional poverty status. These can be summarized as follows.
– The number of household-level characteristics associated with living in consistent poverty rather than in severe material deprivation or income poverty only is much smaller than the number of characteristics explaining why someone lives in consistent poverty rather than not being at risk of poverty at all. The overwhelming majority of these significant effects are positive, indicating that those living in consistent poverty have less-beneficial household characteristics (bigger families, lower levels of education and weak or non-existent links to the labor market). In addition, they evaluate their financial circumstances as being worse, ceteris paribus.
– Only the work intensity of the household emerges as an important factor across (almost) all country groups. Living in a work-poor household is associated with living in consistent poverty (instead of in either of the other two poverty statuses) in all country groups.
– Other factors that showed strong correlation with being at risk of consistent poverty rather than not being at risk at all are no longer relevant across the whole of Europe when the risk of living in consistent poverty is assessed against living in either severe material deprivation or income poverty only. This is the case with education of the household head, settlement type and, to some extent, household type. There are, however, differences in the importance of these factors depending on the reference status, and we can detect notable cross-country differences too.
– Being at risk of consistent poverty rather than at risk of severe material deprivation only (Table 3) is explained (in addition to the above-described general correlations) by many factors that are not significant in the case of income
poverty as a reference status, and vice versa. While household type and work intensity seem to differentiate between consistent poverty and severe material deprivation, education of the household head and settlement type better explain the differences against income poverty.
– Living in a ‘one-person household’ or a ‘single-parent household’ is associated with a significant risk of living in consistent poverty, rather than just in severe material deprivation or income poverty; while living in a family with children (apart from single-parent families) is positively associated with a higher risk of consistent poverty only in the Southern countries and the New Member States (and in the Continental countries in the case of families with at least three children).
– In the case of work intensity status of the household, not only is low and very low household work intensity associated with a higher risk of consistent poverty than of only severe material deprivation in the English-speaking, Southern and Central and Eastern European countries, but so is even medium work intensity (0.45–0.55), relative to very high work intensity households. In addition, moderately high (0.55–0.85) work intensity is also positively associated with consistent poverty in the New Member States (Table 4).
– In contrast to what we observed for household type and work intensity status, the highest level of education attained by the household head and the settlement type play a role in differentiating between consistent poverty and just income poverty status. The estimates for education are significant and positive in all country groups, except for the Nordic countries for primary education and the Continental, Southern, and Central and Eastern European countries for secondary education.
– In the New Member States, those living in households located in either intermediate or thinly populated areas are more likely to be at risk of consistent poverty than those in densely populated areas, whichever of the other two poverty statuses is used in comparison.
– In all country groups except for the Southern Member States if a household faces severe material deprivation, the chances that it will also be at risk of income poverty increase significantly when the household consists of older people (60+) only (relative to high work intensity households). The same effect cannot be observed, however, in the reverse case: living in an elderly household does not increase the probability of being in consistent poverty rather than at risk of income poverty only.
– Finally, while inability to make ends meet (as reported by the household reference person) accounts for the differences between the risk of living in consistent poverty and the risk of living in income poverty only in all five country groups, the same holds for only the Southern countries and the New Member States if consistent poverty status is assessed against income poverty status.
SUMMARY AND CONCLUSIONS
We have focused on examining the relationship between the income and the material deprivation concepts of poverty by identifying the main factors that affect the risk of consistent poverty, compared to exclusive forms of poverty—
i.e. living in income poverty only or living in severe material deprivation only.
We applied the method proposed by Nolan and Whelan (2011a,b) to measure consistent poverty in the European Union. Accordingly, people facing both the risk of income poverty and the risk of severe material deprivation were considered to be living in consistent poverty. We analyzed patterns of consistent poverty across EU member state by distinguishing between four possible combinations of income poverty and severe material deprivation status: not at all at risk; at risk of income poverty only; severely materially deprived only; and living in consistent poverty. Further, multivariate regression analyses were performed to identify the main individual and household-level factors that predict consistent poverty status. When performing the later step, our analysis introduced a new feature: we explored factors that differentiate between those living in consistent poverty and those being part of three different reference groups: not at risk at all, at risk of income poverty only and materially deprived only.
The share of those living in consistent poverty is highest in the New Member States and the Southern countries, and a higher at-risk rate is associated with higher rates of consistent poverty. Our analysis showed that consistent poverty is present in all European Union Member States, even in the most affluent societies.
The incidence of consistent poverty, however, varies greatly across countries, with higher-than-EU-average figures in the New Member States (the Czech Republic, Slovenia and Slovakia being exceptions) and in some of the Southern countries (Cyprus, Italy and Greece). The risk of living in consistent poverty correlates strongly with household characteristics related to social status, independently of the reference group used in the analysis. This reinforces the claim that all EU countries should strengthen their efforts to decrease the risk of poverty by focusing on those most in need: low-skilled workers, work-poor households, large families, etc. Furthermore, our results highlight that there are important differences in terms of which factors shape the comparison of living in consistent poverty compared to living in income poverty only or in material deprivation only. This finding suggests that those living in poverty or social exclusion are far from consisting of a homogeneous group, so the most vulnerable can be better identified and monitored.
In addition, our analysis provides evidence both about the conceptual differences in the two indicators in our analysis (relative income poverty and material deprivation) and the correlation which exists between them (especially in the Nordic countries, but to a lesser extent in other affluent member states as well).
While our analysis lacks country-level detail and as such is not suitable for use in making national-level policy conclusions, some country group-level policy conclusions still can be drawn. That there is a need for a strong focus on families with children in the Southern countries and in the New Member states is a clear message. In addition, the accentuated role of education in the New Member States indicates that there is a significant mismatch between skills and available jobs on the labor market which should be tackled by the education system.
REFERENCES
Ayllón, S. and A. Gábos (2015), The interrelationships between the Europe 2020 social inclusion indicators. ImPRovE Discussion Paper 15/01, Herman Deleeck Centre for Social Policy, University of Antwerp, Antwerp.
Boarini, R. and M.M. d’Ercole (2006), Measures of material deprivation in OECD countries. OECD Social, Employment and Migration Working Paper No. 37. Paris, OECD.
Copeland, P. and M. Daly (2012), Varieties of poverty reduction: inserting the poverty and social exclusion target into Europe 2020. Journal of European Social Policy, 22(3), 273–287.
Council Decision 75/458/EEC of 22nd (1975), Concerning a programme of pilot schemes and studies to combat poverty (OLJ 99/3430.7.75.)
Crettaz, E. and C. Sutter (2013), The impact of adaptive preferences on subjective indicators: an analysis of poverty indicators. Social Indicators Research, 114, 139–152.
Decancq, K., T. Goedemé, K. Van den Bosch and J. Vanhille (2013), The evolution of poverty in the Europe Union: concepts, measurement and data.
In: B. Cantillon and F. Vandenbroucke (eds) Reconciling Work and Poverty Reduction: How successful are European welfare states? Oxford, Oxford University Press.
Esping-Andersen, G. (1993), The Three Worlds of Welfare Capitalism. Princeton, Princeton University Press.
European Commission (1985), On specific community action to combat poverty (Council Decision of 19 December 1984). 85/8/EEC, Official Journal of the EEC 2/24.
European Commission (2010), Europe 2020: A European strategy for smart, sustainable and inclusive growth. Communication from the Commission COM(2010) 2020, Brussels.
Ferrera, M. (1996), The ‘Southern Model’ of welfare in social Europe. Journal of European Social Policy, 6(1), 17–37.
Förster, M., G. Tarcali and M. Till (2004), Income and non-income poverty in Europe: What is the minimum acceptable standard in an enlarged European Union? European Centre for Social Welfare Policy and Research, Vienna.
Guio, A.-C. (2009), What can be learned from deprivation indicators in Europe?
Eurostat Methodologies and Working Papers, Luxembourg.
Guio, A.-C. and E. Marlier (2013), Alternative vs. current indicators of material deprivation at EU level: What differences does it make? ImPRovE Discussion Paper 13/07, Herman Deleeck Centre for Social Policy, University of Antwerp, Antwerp.
Guio, A.-C., D. Gordon and E. Marlier (2012), Measuring material deprivation in the EU. Indicators for the whole population and child-specific indicators. Paper presented during the Working Group meeting ‘Statistics on Living Conditions’, Eurostat, Luxembourg, 29–31 May.
Hick, R. (2012), The capability approach: Insights for a new poverty focus.
Journal of Social Policy, 41(2), 295–323.
Israel S. and D. Spannagel (2013), Material deprivation: an analysis of cross- country differences and European convergence, Combating Poverty in Europe (COPE) project, European Commission.
Maître, B., B. Nolan and C.T. Whelan (2013): A critical evaluation of the EU 2020 poverty and social exclusion target: an analysis of EU-SILC 2009. GINI Discussion Paper No. 79, AIAS, Amsterdam.
McKnight, A. (2013): Measuring material deprivation over the economic crisis:
does a re-evaluation of ‘need’ affect measures of material deprivation? GINI Policy Paper No. 4, AIAS, Amsterdam.
Nolan, B. and C.T. Whelan (1996): Resources, Deprivation and Poverty. Oxford:
Clarendon Press.
Nolan, B. and C.T. Whelan (2011a): Poverty and Deprivation in Europe. Oxford:
Oxford University Press.
Nolan, B. and C.T. Whelan (2011b): The EU 2020 poverty target. GINI Discussion Paper No. 19, AIAS, Amsterdam.
Notten, G. (2015): How Poverty Indicators Confound Poverty Reduction Evaluations: The Targeting Performance of Income Transfers in Europe. In:
Social Indicators Research: 1-18.
Ravallion, M. (2011): On Multidimensional indices of poverty. World Bank Policy Research Working Paper 5580.
Sen, A. (1989): Development as Capability Expansion. Journal of Development Planning, 19: 41–58.
Townsend, P. (1979): Poverty in the United Kingdom. Harmondsworth: Penguin.
Ward, T. and E. Özdemir (2013): Measuring low work intensity – an analysis of the indicator. ImPRovE Discussion Paper 13/09, Herman Deleeck Centre for Social Policy, University of Antwerp, Antwerp.
Whelan, C.T. and B. Maître (2010): Comparing poverty indicators in an enlarged EU, European Sociological Review, 26: 713–730.
Whelan, C.T., B. Maître and B. Nolan (2007): Multiple deprivation and multiple disadvantage in Ireland: an analysis of EU-SILC, Policy Research Series No.
61, Economic and Social Research Institute, Dublin.
Whelan, C.T., B. Nolan and B. Maître (2008): Measuring material deprivation in the enlarged EU, Working Paper No. 249, Economic and Social Research Institute, Dublin.
APPENDIX
Table A1. Results from logit regressions: living in consistent poverty vs. not at risk of poverty at all, by country cluster, 2012
New Member
States Southern English-
speaking Continental Nordic VARIABLES
Sex -0.0525 0.159** -0.569*** 0.289*** 0.0643
(0.0625) (0.0802) (0.193) (0.106) (0.264)
Age 0.0103 -0.0821*** -0.0434* -0.0485*** -0.121***
(0.00881) (0.0113) (0.0256) (0.0180) (0.0440) Age squared -0.000170* 0.000759*** 0.000283 0.000263 0.000923*
(8.81e-05) (0.000113) (0.000274) (0.000191) (0.000504) Household structure
(ref. two adults) One-person
household 1.728*** 1.313*** 1.970*** 1.896*** 2.175***
(0.0681) (0.0883) (0.195) (0.133) (0.273)
Other households
without children -0.650*** -0.675*** -1.172*** -0.941*** -1.206
(0.0790) (0.0960) (0.382) (0.341) (0.803)
Single-parent 1.787*** 1.319*** 1.452*** 1.733*** 1.315***
(0.114) (0.142) (0.278) (0.181) (0.435)
2 adults, 1 child 0.303*** 0.253** 0.299 0.533*** 0.208
(0.0848) (0.104) (0.274) (0.186) (0.429)
2 adults, 2 children 0.356*** 0.698*** 0.438* 0.506** 0.943**
(0.0889) (0.0990) (0.261) (0.206) (0.395)
2 adults, 3+ children 0.977*** 1.192*** 0.755*** 1.388*** 1.769***
(0.105) (0.135) (0.260) (0.205) (0.505)
Other households
with children 0.0414 0.300*** 0.0370 1.170*** 1.415***
(0.0793) (0.108) (0.390) (0.233) (0.543)
Education (ref. tertiary education)
Primary education 2.052*** 0.980*** 0.445** 1.208*** 0.480
(0.0813) (0.0879) (0.186) (0.130) (0.296)
Secondary education 0.825*** 0.347*** 0.501*** 0.684*** 0.0375
(0.0751) (0.0963) (0.153) (0.124) (0.264)
Work intensity (ref: WI>0.85)
WI<0.2 3.053*** 2.902*** 3.298*** 3.613*** 4.056***
(0.0618) (0.0781) (0.170) (0.106) (0.302)
WI=0.2–0.45 2.620*** 2.415*** 2.486*** 2.684*** 2.589***
(0.0880) (0.106) (0.248) (0.164) (0.403)
WI=0.45–0.55 1.407*** 1.343*** 1.375*** 1.500*** 0.955**
(0.0743) (0.0926) (0.248) (0.166) (0.419)
WI=0.55–0.85 0.761*** 0.305** 0.661** 0.166 0.919**
(0.0867) (0.122) (0.265) (0.171) (0.381)
Elderly households 0.205*** 0.122** 0.222 0.571*** 0.822***
(0.0410) (0.0541) (0.207) (0.118) (0.296)
Settlement (ref: densely populated
area)
Intermediate area 0.404*** 0.105 -0.289** -0.389*** 0.0160
(0.0636) (0.0693) (0.144) (0.112) (0.377)
Thinly populated
area 0.903*** 0.264*** -0.798*** -0.393*** 0.457*
(0.0501) (0.0664) (0.185) (0.125) (0.267)
IMEM 2.685*** 2.602*** 2.102*** 2.664*** 3.057***
(0.0448) (0.0581) (0.141) (0.117) (0.263)
Constant -6.280*** -4.110*** -3.910*** -5.723*** -4.657***
(0.242) (0.300) (0.640) (0.443) (0.971)
Observations 164,164 109,870 28,926 110,711 49,958
Source: authors’ own calculations based on EU-SILC 2012.
Note: robust standard errors in parentheses. *** p<0.01, ** p<0.05, * p<0.1.
Table A2. Results from logit regressions: living in consistent poverty vs. at risk of severe material deprivation only, by country cluster, 2012
New Member
States Southern English-
speaking Continental Nordic VARIABLES
Sex -0.230*** 0.147 -0.492** -0.0348 -0.117
(0.0649) (0.101) (0.225) (0.145) (0.293)
Age 0.00396 -0.0133 -0.00573 -0.0330 -0.107**
(0.00852) (0.0135) (0.0309) (0.0220) (0.0528) Age squared -3.65e-05 0.000168 0.000206 0.000313 0.000959*
(8.46e-05) (0.000133) (0.000361) (0.000245) (0.000583) Household structure
(ref. two adults) One-person
household 1.292*** 0.608*** 0.741*** 0.818*** 0.336
(0.0681) (0.104) (0.236) (0.167) (0.341)
Other households
without children -0.510*** -0.458*** -1.614*** -0.945** -1.439
(0.0849) (0.117) (0.449) (0.427) (1.144)
Single-parent 1.322*** 0.867*** 0.167 0.806*** 0.383
(0.113) (0.183) (0.313) (0.225) (0.486)
2 adults, 1 child 0.389*** 0.274** -0.122 0.212 0.274
(0.0869) (0.129) (0.318) (0.226) (0.608)
2 adults, 2 children 0.737*** 0.771*** -0.173 0.392 0.310
(0.0946) (0.126) (0.297) (0.239) (0.479)
2 adults, 3+
children 1.098*** 1.167*** 0.256 0.767*** 0.982
(0.118) (0.166) (0.294) (0.263) (0.656)
Other households
with children 0.191** 0.148 -0.434 0.422 1.385*
(0.0804) (0.127) (0.429) (0.302) (0.796)
Education (ref.
tertiary education)
Primary education 1.028*** 0.0515 -0.136 0.0929 -0.765*
(0.0928) (0.116) (0.196) (0.170) (0.394)
Secondary
education 0.356*** -0.190 0.0969 0.0729 -0.665*
(0.0896) (0.131) (0.184) (0.164) (0.374)
Work intensity (ref: WI>0.85)
WI<0.2 2.311*** 2.100*** 1.599*** 2.007*** 2.251***
(0.0683) (0.109) (0.233) (0.167) (0.469)
WI=0.2–0.45 1.804*** 1.359*** 1.138*** 1.388*** 0.850
(0.0922) (0.129) (0.308) (0.224) (0.547)
WI=0.45–0.55 0.994*** 0.790*** 0.681** 0.954*** 0.975*
(0.0825) (0.121) (0.316) (0.244) (0.591)
WI=0.55–0.85 0.359*** -0.232 0.460 0.0778 0.767
(0.0918) (0.143) (0.328) (0.221) (0.571)
Elderly households 0.115** 0.248*** 0.190 0.766*** 1.027**
(0.0459) (0.0771) (0.278) (0.210) (0.476)
Settlement (ref: densely populated area)
Intermediate area 0.289*** -0.117 -0.205 -0.133 -0.0209
(0.0642) (0.0827) (0.160) (0.141) (0.399)
Thinly populated
area 0.859*** 0.272*** -0.297 -0.117 0.591*
(0.0518) (0.0828) (0.207) (0.159) (0.329)
IMEM 0.551*** 0.445*** 0.119 0.119 0.365
(0.0464) (0.0711) (0.146) (0.124) (0.290)
Constant -3.034*** -1.570*** -0.931 -0.719 1.187
(0.239) (0.360) (0.760) (0.525) (1.098)
Observations 36,900 14,409 3,082 4,307 852
Source: authors’ own calculations based on EU-SILC 2012.
Note: robust standard errors in parentheses. *** p<0.01, ** p<0.05, * p<0.1.
Table A3. Results from logit regressions: living in consistent poverty vs. at risk of rela- tive income poverty only, by country cluster, 2012
New Member
States Southern English-
speaking Continental Nordic
VARIABLES CP CP CP CP CP
Sex -0.00741 -0.0511 -0.153 0.0964 -0.310
(0.0734) (0.0790) (0.180) (0.101) (0.225)
Age 0.00469 -0.00663 -0.00279 -0.000330 0.0405
(0.00918) (0.0113) (0.0256) (0.0165) (0.0372) Age squared -9.38e-05 1.25e-06 -0.000260 -4.66e-05 -0.000558
(9.38e-05) (0.000114) (0.000289) (0.000182) (0.000422) Household
structure (ref. two adults)
One-person
household 0.272*** 0.443*** 1.063*** 0.766*** 0.455*
(0.0729) (0.0820) (0.186) (0.122) (0.241)
Other households
without children -0.0411 0.0405 -0.613 -0.470 -0.332
(0.0994) (0.105) (0.390) (0.347) (0.778)
Single-parent 0.107 0.318** 0.778*** 0.567*** 0.396
(0.120) (0.134) (0.259) (0.167) (0.364)
2 adults, 1 child -0.182* -0.234** 0.460* -0.0673 -0.420
(0.0932) (0.111) (0.271) (0.193) (0.456)
2 adults, 2
children -0.291*** -0.165 0.169 -0.0549 0.168
(0.0944) (0.106) (0.266) (0.195) (0.380)
2 adults, 3+
children 0.0198 0.0466 0.373 0.201 -0.361
(0.104) (0.135) (0.258) (0.193) (0.440)
Other households
with children -0.0620 0.0722 -0.208 0.290 0.438
(0.0887) (0.113) (0.417) (0.238) (0.505)