Cite this article as: Vincze, A., Dargó, G., Balogh, Gy. T. "Cornea-PAMPA as an Orthogonal in Vitro Physicochemical Model of Corneal Permeability", Periodica Polytechnica Chemical Engineering, 64(3), pp. 384–390, 2020. https://doi.org/10.3311/PPch.15601
Cornea-PAMPA as an Orthogonal in Vitro Physicochemical Model of Corneal Permeability
Anna Vincze1, Gergő Dargó1, György Tibor Balogh1,2*
1 Department of Chemical and Environmental Process Engineering, Faculty of Chemical Technology and Biotechnology, Budapest University of Technology and Economics, H-1111 Budapest, Műegyetem rakpart 3., Hungary
2 Institute of Pharmacodynamics and Biopharmacy, Faculty of Pharmacy, University of Szeged, H-6720 Szeged, Zrínyi u. 9., Hungary
* Corresponding author, e-mail: gytbalogh@mail.bme.hu
Received: 21 January 2020, Accepted: 17 March 2020, Published online: 25 May 2020
Abstract
The present study was aimed to investigate the relationships between permeability and membrane retention values (logPe and MR) of the in vitro non-cellular permeability assay, corneal-PAMPA in comparison with experimental Caco-2 permeability data and calculated physicochemical properties (MW, clogP, clogD7.4 , TPSA). For the investigation, 50 structurally and physicochemically diverse drugs were selected and measured in PAMPA model optimized for corneal permeability. The results showed corneal-PAMPA model's orthogonality in terms of passive diffusion to the FDA approved Caco-2 as a gastrointestinal absorption model, while the comparison with physicochemical properties revealed trends between logPe , MR and the lipophilicity descriptors and TPSA.
Keywords
corneal-PAMPA, permeability, membrane retention, physicochemical descriptors, clogP/D7.4 , TPSA
1 Introduction
The effective treatment of diseases affecting the human eye is of utmost importance as they might cause par- tial visual impairment or even complete blindness [1].
For the treatment of the anterior segment of the eye, top- ical drug administration is the preferred way of therapy.
To this avail, eye drops, ophthalmic solutions, eye oint- ments and gels, microemulsions, drug-eluting contact lenses, ocular inserts, liposomes, nano- and microparti- cles etc. can be used [2–4]. However, ocular bioavailabil- ity of these topically administered drugs is limited by sev- eral factors: lacrimal fluid rapidly elutes a large portion of the applied drugs within a few minutes upon adminis- tration [5]; the drug fraction absorbed through non-cor- neal routes is mostly transferred into the systematic cir- culation [6]. These result in a decreased bioavailability (usually < 5–10 %) [7, 8], while the therapeutic effect can mainly be attributed to the drug fraction absorbed via the corneal route [6]. The human cornea is a unique and com- plex biological barrier which consists of five distinct layers:
the epithelium, Bowman's layer, the stroma, Descemet's membrane, and the endothelium [6, 9, 10]. For the absorp- tion of the drug into the aqueous humor it has to penetrate
through these layers of hydrophilic and lipophilic charac- ter, however, it has been reported that in the case of most drugs the epithelial layer is the rate-limiting barrier [11, 12]
which is responsible for about 99 % of the resistance to the diffusion of APIs through the cornea [13].
To predict the corneal permeability of APIs, several methods exist: ex vivo models using the eyes or excised cornea of vertebrate animals (most often rabbit, pig or bovine eyes) [10], while to minimize the number of lab- oratory animals sacrificed and to limit the cost of ex vivo studies, in vitro cellular models using primary cell cul- tures, immortalized cell lines, or reconstructed tissue cultures of rabbit or human origin [10, 14] are used and recently an in vitro non-cellular method, corneal-PAMPA has also been developed by our group to this avail [15].
The corneal-PAMPA method has been developed based on ex vivo rabbit corneal permeability data [7, 12]
using the parallel artificial membrane permeability assay (PAMPA) [16]. Based on previous experience with the PAMPA model [17, 18], we investigated the effects of the composition of the artificial lipid membrane, the DMSO cosolvent content of the donor phase as well as different
buffer solutions in the model. We found that the best cor- relation (R2 = 0.880) with the ex vivo data could be achieved using the following optimized conditions: iso-pH conditions using phosphate buffer saline (PBS, pH 7.4) without cosol- vent, phosphatidylcholine (PC = 10.7 % (w/v); without cho- lesterol) dissolved in a solvent mixture of hexane:dodeca- ne:chloroform = 70:25:5 (v/v) as an artificial membrane and a 4 hour long incubation of the PAMPA plates at 35 °C.
In this study, we have investigated the orthogonality between corneal-PAMPA and the FDA approved industrial cellular permeability standard, Caco-2 based on experi- mental data. We also aimed to investigate the extent of correlation between the experimentally determined cor- neal-PAMPA data (permeability ( logPe ) and membrane retention (MR)) and basic physicochemical proper- ties (MW and in silico predicted clogP, clogD7.4 , TPSA) to determine if it is possible to predict corneal permeabil- ity values based on these basic descriptors.
2 Experimental 2.1 Materials
Analytical grade solvents such as acetonitrile (MeCN), chloroform, dodecane, hexane and formic acid were purchased from Merck KGaA (Darmstadt, Germany).
Phosphate buffered saline (PBS) powder, L-α- phosphatidylcholine (PC) and the reference materials (aldosterone, amitriptyline hydrochloride, antipyrine, atenolol, atropine sulfate, bupropion hydrochloride, car- bamazepine, chloramphenicol, chlorpromazine hydro- chloride, cimetidine hydrochloride, ciprofloxacin, clon- idine, desipramine hydrochloride, diazepam, diclofenac sodium, diflunisal, diltiazem hydrochloride, ephedrine hydrochloride, etoposide, famotidine, furosemide, hal- operidol, hydrocortisone, ibuprofen, imipramine hydro- chloride, irbesartan, ketoprofen, labetalol hydrochloride, lidocaine, loperamide hydrochloride, meloxicam sodium, metoprolol, nadolol, naproxen, ofloxacin, phenytoin, pin- dolol, pirenzepine 2 hydrochloride, piroxicam, prazosin hydrochloride, prednisolone, propranolol hydrochloride, quinine, sparfloxacin, theophylline, trimethoprim, ver- apamil hydrochloride, warfarin) were purchased from Sigma Aldrich Co. Ltd. (Budapest, Hungary). Further ref- erence materials (betaxolol hydrochloride, flurbiprofen) were purchased from Toronto Research Chemicals Inc.
(North York, Toronto, Canada). In all experiments, dis- tilled water was purified by the Millipore Milli-Q® 140 Gradient Water Purification System.
2.2 Corneal-PAMPA measurements
For in vitro transcorneal permeability measurement the pre- viously reported cornea-PAMPA method was used [15].
Briefly the drugs were dissolved in PBS buffer (pH 7.4) to make solutions of 100 μM nominal concentration.
Before each assay the PBS solutions were homogenized by using an Eppendorf MixMate vortex mixer for 10–12 s and by an ultrasonic bath (Bandelin Sonorex Digiplus) for 10 min. For creation of the lipid membrane phosphati- dylcholine (PC, 16 mg) was dissolved in a solvent mixture (70 % (v/v) hexane, 25 % (v/v) dodecane, 5 % (v/v) chloro- form) and then each well of donor plate (MultiscreenTM-IP, MAIPN4510, pore size 0.45 mm; Millipore) was coated with the lipid solution (5 μL each). Then the hexane and chloroform were evaporated to form a PC lipid membrane with the concentration of 10.67 w/v% in each well. Then the donor plate was fit into the acceptor plate (Multiscreen Acceptor Plate, MSSACCEPTOR; Millipore) containing 300 μL of PBS solution (pH 7.4), and 150–150 μL of the PBS solutions were put on the membrane of the donor plate.
The donor plate was covered with a sheet of wet tissue paper and a plate lid to avoid evaporation. The plates were incu- bated for 4 h at 35 °C (Heidolph Titramax 1000) followed by separation of PAMPA sandwich plates and determina- tion of concentrations of the APIs in the donor and acceptor solutions by HPLC-DAD. The concentration of donor solu- tions at time point zero was also determined using the same HPLC system. Test solutions from PAMPA experiments were prepared in 96-well plates and sealed before injection.
For each assay 3 replicates per compounds were measured.
The effective permeability and membrane retention of drugs were calculated using Eq. (1) [16]:
P A t r r r C t
e C
ss v v v D
= −
× −
( )
× + × − + −+ ×2 303 1 ( ) 1
1 1
. lg
τ MR DD( )0
, (1) where Pe is the effective permeability coefficient (cm/s), A is the filter area ( 0.3 cm2 ), t is the incubation time (s), τss is the time to reach steady-state (s), rv is the volume ratio of aqueous compartments ( VD / VA ), VD and VA are the volumes in the donor ( 0.15 cm3 ) and acceptor phase ( 0.3 cm3 ), cD (t) is the concentration of the compound in the donor phase at time point t ( mol/cm3 ), cD (0) is the concen- tration of the compound in the donor phase at time point zero ( mol/cm3 ) and MR is the membrane retention factor, defined as [16]:
MR= − ( )
( )− ( )
( )
× 1 ×
0 C t C
V C t V C t
D D
A A
D D
, (2)
where cA (t) is the concentration of the compound in the acceptor phase at time point t ( mol/cm3 ).
2.3 HPLC-methods
Quantitative chromatographic analyses were performed using an Agilent 1260 liquid chromatography system equipped with a vacuum degasser, a quaternary pump, a thermostatted autosampler, a column temperature con- troller and a diode array detector (Agilent Technologies, Palo Alto, CA, USA) at 45 °C on a Kinetex® 2.6 µm C18 100 Å LC column (30 × 3 mm) with a mobile phase flow rate of 1.1 mL / min. Composition of mobile phase A was 0.1 % (v/v) formic acid in water, B was MeCN/water 95/5 (v/v) with 0.1 % (v/v) of formic acid. A 3.91 min long, linear gradient program was applied: 0 % B in the first 0.3 min, 0–100 % B between 0.3 and 1.8 min, then 100 % B was kept for another 0.6 min, and finally at 2.41 min the percentage of B was dropped to 0 %. This was fol- lowed by an equilibration period of 1.5 min prior to the next injection. Chromatograms were recorded at the wavelength of 200–500 nm, integration was carried out at the UVmax of each compound. The applied injection vol- ume was 6 μL. ChemStation B.04.03 was used for data acquisition and analysis.
3 Results and discussion
For our experiments, we have selected fifty APIs of com- mercially available drugs (Table 1) with diverse molecular structure and physicochemical parameters covering a broad range of molecular weight (MW = 165 – 589), lipophilicity descriptors (clogP = –2.0 – 5.4, clogD7.4 = –2.7 – 4.2) and topological polar surface area (TPSA = 3 – 176 Å2). Table 1 also contains the in vitro corneal permeability and mem- brane retention values measured by the corneal-PAMPA method [15], as well as previously reported experimental Caco-2 permeability data [19–21].
As we can see in Fig. 1 only a weak correlation could be observed between the in vitro experimental corne- al-PAMPA and Caco-2 permeability values (Pearson cor- relation coefficient, r = 0.354), which indicates that our model is independent of this generally accepted gastro- intestinal permeability model and supports its adequacy for cornea-specific in vitro measurements.
To investigate the correlation of corneal permeabil- ity values and basic physicochemical parameters clogP, clogD7.4 and TPSA values have been predicted using the Marvin calculator plugin [22] (Table 1). Determination of correlation coefficients and model fitting was carried out using GraphPad Prism v.7.03. [23].
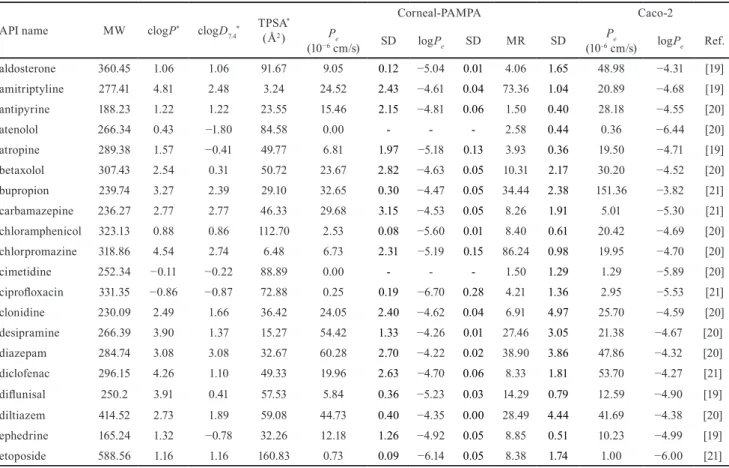
Table 1 In silico predicted physicochemical parameters and experimental corneal-PAMPA and Caco-2 permeability values of investigated APIs API name MW clogP* clogD7.4* TPSA*
( Å2 )
Corneal-PAMPA Caco-2
Pe
(10−6 cm/s) SD logPe SD MR SD Pe
(10-6 cm/s) logPe Ref.
aldosterone 360.45 1.06 1.06 91.67 9.05 0.12 −5.04 0.01 4.06 1.65 48.98 −4.31 [19]
amitriptyline 277.41 4.81 2.48 3.24 24.52 2.43 −4.61 0.04 73.36 1.04 20.89 −4.68 [19]
antipyrine 188.23 1.22 1.22 23.55 15.46 2.15 −4.81 0.06 1.50 0.40 28.18 −4.55 [20]
atenolol 266.34 0.43 −1.80 84.58 0.00 - - - 2.58 0.44 0.36 −6.44 [20]
atropine 289.38 1.57 −0.41 49.77 6.81 1.97 −5.18 0.13 3.93 0.36 19.50 −4.71 [19]
betaxolol 307.43 2.54 0.31 50.72 23.67 2.82 −4.63 0.05 10.31 2.17 30.20 −4.52 [20]
bupropion 239.74 3.27 2.39 29.10 32.65 0.30 −4.47 0.05 34.44 2.38 151.36 −3.82 [21]
carbamazepine 236.27 2.77 2.77 46.33 29.68 3.15 −4.53 0.05 8.26 1.91 5.01 −5.30 [21]
chloramphenicol 323.13 0.88 0.86 112.70 2.53 0.08 −5.60 0.01 8.40 0.61 20.42 −4.69 [20]
chlorpromazine 318.86 4.54 2.74 6.48 6.73 2.31 −5.19 0.15 86.24 0.98 19.95 −4.70 [20]
cimetidine 252.34 −0.11 −0.22 88.89 0.00 - - - 1.50 1.29 1.29 −5.89 [20]
ciprofloxacin 331.35 −0.86 −0.87 72.88 0.25 0.19 −6.70 0.28 4.21 1.36 2.95 −5.53 [21]
clonidine 230.09 2.49 1.66 36.42 24.05 2.40 −4.62 0.04 6.91 4.97 25.70 −4.59 [20]
desipramine 266.39 3.90 1.37 15.27 54.42 1.33 −4.26 0.01 27.46 3.05 21.38 −4.67 [20]
diazepam 284.74 3.08 3.08 32.67 60.28 2.70 −4.22 0.02 38.90 3.86 47.86 −4.32 [20]
diclofenac 296.15 4.26 1.10 49.33 19.96 2.63 −4.70 0.06 8.33 1.81 53.70 −4.27 [21]
diflunisal 250.2 3.91 0.41 57.53 5.84 0.36 −5.23 0.03 14.29 0.79 12.59 −4.90 [19]
diltiazem 414.52 2.73 1.89 59.08 44.73 0.40 −4.35 0.00 28.49 4.44 41.69 −4.38 [20]
ephedrine 165.24 1.32 −0.78 32.26 12.18 1.26 −4.92 0.05 8.85 0.51 10.23 −4.99 [19]
etoposide 588.56 1.16 1.16 160.83 0.73 0.09 −6.14 0.05 8.38 1.74 1.00 −6.00 [21]
Fig. 2 shows the relationship between the in sil- ico parameters and permeability and membrane reten- tion values of corneal-PAMPA. In the case of logPe val- ues, only a weak correlation could be observed with MW (Fig. 2 (A)), while the comparison revealed a moderate cor- relation with clogD7.4 (Fig. 2 (E)), a strong positive correla- tion in the case of clogP (Fig. 2 (C)) and a strong negative correlation with TPSA (Fig. 2 (G)). These are in agreement with the fact that the more lipophilic a drug is, the eas- ier it can partition into the membrane (PC, in our model).
On the other hand, a large polar surface area will hinder that process, therefore a negative trend can be expected.
However, the goodness of fit ( R2 ) values of the straight
Fig. 1 Correlation between experimental corneal-PAMPA and Caco-2 permeability values, r is the Pearson correlation coefficient [23].
API name MW clogP* clogD7.4* TPSA* ( Å2 )
Corneal-PAMPA Caco-2
Pe
(10−6 cm/s) SD logPe SD MR SD Pe
(10-6 cm/s) logPe Ref.
famotidine 337.44 −1.95 −2.67 175.83 0.38 0.31 −6.55 0.42 1.11 0.68 0.89 −6.05 [19]
flurbiprofen 244.27 3.94 1.07 37.30 16.47 1.77 −4.79 0.05 1.94 2.34 33.88 −4.47 [21]
furosemide 330.74 1.75 −1.25 122.63 1.07 0.80 −6.10 0.45 0.56 2.07 0.31 −6.51 [20]
haloperidol 375.87 3.66 2.93 40.54 40.66 6.60 −4.40 0.07 41.16 9.67 15.85 −4.80 [21]
hydrocortisone 362.47 1.28 1.28 94.83 5.58 1.96 −5.28 0.17 10.80 3.08 21.88 −4.66 [20]
ibuprofen 206.29 3.84 1.34 37.30 21.90 2.75 −4.66 0.06 1.26 2.20 52.48 −4.28 [20]
imipramine 280.42 4.28 2.48 6.48 15.59 0.30 −4.61 0.26 50.34 4.51 14.13 −4.85 [20]
irbesartan 428.54 5.39 4.23 87.13 2.23 0.51 −5.66 0.10 8.55 1.36 11.75 −4.93 [19]
ketoprofen 254.29 3.61 0.39 54.37 8.36 0.57 −5.08 0.03 0.00 1.06 46.77 −4.33 [21]
labetalol 328.41 1.89 1.26 95.58 3.78 0.72 −5.43 0.09 18.73 2.55 9.33 −5.03 [20]
lidocaine 234.34 2.84 2.33 32.34 61.68 1.07 −4.21 0.01 7.07 1.25 61.66 −4.21 [20]
loperamide 477.05 4.77 2.77 43.78 37.76 3.77 −4.42 0.04 37.23 1.59 20.89 −4.68 [19]
meloxicam 351.4 1.60 −1.10 99.60 6.99 0.57 −5.16 0.03 4.22 2.24 19.50 −4.71 [20]
metoprolol 267.37 1.76 −0.47 50.72 14.19 1.22 −4.85 0.04 2.95 1.75 25.70 −4.59 [20]
nadolol 309.41 0.87 −1.44 81.95 0.00 - - - 4.12 0.87 3.89 −5.41 [20]
naproxen 230.26 2.99 −0.05 46.53 11.51 1.04 −4.94 0.04 0.00 0.31 14.79 −4.83 [20]
ofloxacin 361.37 0.09 −0.51 73.32 1.56 0.54 −5.83 0.14 3.77 1.13 21.38 −4.67 [19]
phenytoin 252.27 2.15 2.11 58.20 19.05 1.21 −4.72 0.03 20.14 2.25 26.92 −4.57 [20]
pindolol 248.33 1.69 −0.53 57.28 9.05 1.51 −5.05 0.08 2.90 1.64 16.60 −4.78 [20]
pirenzepine 351.41 0.97 0.76 68.78 0.34 0.27 −6.55 0.33 9.62 1.72 0.44 −6.36 [20]
piroxicam 331.35 0.60 −1.52 99.60 14.11 1.70 −4.85 0.05 3.95 1.57 35.48 −4.45 [20]
prazosin 383.41 1.65 1.43 106.95 7.85 3.20 −5.13 0.18 40.35 6.19 43.65 −4.36 [20]
prednisolone 360.45 1.27 1.27 94.83 3.50 0.66 −5.46 0.08 11.57 2.46 20.42 −4.69 [19]
propranolol 259.35 2.58 0.36 41.49 37.05 2.57 −4.43 0.03 21.50 1.36 26.30 −4.58 [20]
quinine 324.42 2.51 0.86 45.59 20.61 0.26 −4.69 0.01 20.42 1.67 112.20 −3.95 [19]
sparfloxacin 392.41 −0.08 −0.08 98.90 4.86 1.57 −5.33 0.16 6.95 1.70 32.36 −4.49 [19]
theophylline 180.17 −0.77 −0.89 69.30 4.36 1.31 −5.38 0.15 1.78 0.34 44.67 −4.35 [20]
trimethoprim 290.32 1.28 1.10 105.51 6.14 1.78 −5.22 0.12 6.83 2.05 87.10 −4.06 [21]
verapamil 454.61 5.04 2.79 63.95 29.00 4.19 −4.80 0.15 11.56 21.08 26.30 −4.58 [20]
warfarin 308.33 2.74 0.94 63.60 12.66 1.83 −4.73 0.23 23.19 25.42 13.80 −4.86 [20]
* clogP, clogD7.4 and TPSA values were predicted by the Chemaxon/Marvin Calculator plugin [22].
Fig. 2 Correlation between experimental corneal permeability ( logPe ), membrane retention (MR) and in silico predicted physicochemical parameters (clogP: the logarithm of the partition coefficient, clogD7.4 : the logarithm of the distribution coefficient at pH 7.4, TPSA: topological polar surface
area). Physicochemical parameters were predicted by the Chemaxon/Marvin Sketch 19.19.0 plugin [22]. r is the Pearson correlation coefficient, R2 is the goodness of fit of the fitted model calculated using GraphPad Prism v. 7.03 [23].
lines fitted onto the datapoint using linear regression anal- ysis were low, only poor fits could be achieved in all cases.
Similar observations could be made in the case of MR values: it showed a very weak correlation with MW (Fig. 2 (B)), moderately strong correlation with the lipo- philicity descriptors (clogD7.4 and clogP (Figs. 2 (D) and (F)) and TPSA (Fig. 2 (H)). The relationship between MR and
the lipophilicity descriptors seemed to be non-linear, instead a sigmoidal model could be fitted over the datapoints, although it showed only a poor fit. In the case of TPSA and MR a fair fit could be observed using an exponential model.
The observed relationships between logPe , MR and the predicted physicochemical descriptors show that using only one basic parameter separately would not result
References
[1] Bruce, A. S., Loughnan, M. S. "Anterior Eye Disease and Therapeutics A-Z", Churchill Livingstone, London, UK, 2011.
[2] Baranowski, P., Karolewicz, B., Gajda, M., Pluta, J. "Ophthalmic Drug Dosage Forms: Characterisation and Research Methods", The Scientific World Journal, 2014, Article ID: 861904, 2014.
https://doi.org/10.1155/2014/861904
[3] Achouri, D., Alhanout, K., Piccerelle, P., Andrieu, V. "Recent advances in ocular drug delivery", Drug Development and Industrial Pharmacy, 39(11), pp. 1599–1617, 2013.
https://doi.org/10.3109/03639045.2012.736515
[4] Mitra, A. K. (ed.) "Ophthalmic Drug Delivery Systems", CRC Press, Boca Raton, FL, USA, 2003.
https://doi.org/10.1201/9780203912072
[5] Ahmed, I. "The Noncorneal Route in Ocular Drug Delivery", In: Mitra, A. K. (ed.) Ophthalmic Drug Delivery Systems, Marcel Dekker, New York, NY, USA, 2003, pp. 356–385.
https://doi.org/10.1201/9780203912072.ch11
[6] Barar, J., Javadzadeh, A. R., Omidi, Y. "Ocular novel drug deliv- ery: impacts of membranes and barriers", Expert Opinion on Drug Delivery, 5(5), pp. 567–581, 2008.
https://doi.org/10.1517/17425247.5.5.567
[7] Kidron, H., Vellonen, K. S., del Amo, E. M., Tissari, A., Urtti, A.
"Prediction of the Corneal Permeability of Drug-Like Compounds", Pharmaceutical Research, 27(7), pp. 1398–1407, 2010.
https://doi.org/10.1007/s11095-010-0132-8
[8] Koevary, S. B. "Pharmacokinetics of Topical Ocular Drug Delivery: Potential Uses for the Treatment of Diseases of the Posterior Segment and Beyond", Current Drug Metabolism, 4(3), pp. 213–222, 2003.
https://doi.org/10.2174/1389200033489488
[9] Fox, S. I. "Sensory Physiology", In: Human Physiology, McGraw- Hill Education, Singapore, Singapore, 2016, pp. 266–315.
[10] Agarwal, P., Rupenthal, I. D. "In vitro and ex vivo corneal pene- tration and absorption models", Drug Delivery and Translational Research, 6(6), pp. 634–647, 2016.
https://doi.org/10.1007/s13346-015-0275-6
[11] Lach, J. L., Huang, H. S., Schoenwald, R. D. "Corneal Penetration Behavior of β-Blocking Agents II: Assessment of Barrier Contributions", Journal of Pharmaceutical Sciences, 72(11), pp. 1272–1279, 1983.
https://doi.org/10.1002/jps.2600721109
[12] Prausnitz, M. R., Noonan, J. S. "Permeability of cornea, sclera, and conjunctiva: A literature analysis for drug delivery to the eye", Journal of Pharmaceutical Sciences, 87(12), pp. 1479–1488, 1998.
https://doi.org/10.1021/js9802594
[13] Sunkara, G., Kompella, U. "Membrane Transport Processes in the Eye", In: Mitra, A. K. (ed.) Ophthalmic Drug Delivery Systems, Marcel Dekker, New York, NY, USA, 2003, pp. 13–58.
https://doi.org/10.1201/9780203912072.ch2
[14] Dey, S. "Corneal cell culture models: a tool to study corneal drug absorption", Expert Opinion on Drug Metabolism & Toxicology, 7(5), pp. 529–532, 2011.
https://doi.org/10.1517/17425255.2011.570334
[15] Dargó, G., Vincze, A., Müller, J., Kiss, H. J., Nagy, Z. Z., Balogh, G. T. "Corneal-PAMPA: A novel, non-cell-based assay for prediction of corneal drug permeability", European Journal of Pharmaceutical Sciences, 128, pp. 232–239, 2019.
https://doi.org/10.1016/j.ejps.2018.12.012
[16] Avdeef, A. "Permeability-PAMPA", In: Absorption and Drug Development: Solubility, Permeability, and Charge State, John Wiley & Sons, Inc., Hoboken, NJ, USA, 2012, pp. 319–498.
https://doi.org/10.1002/9781118286067.ch7
[17] Müller, J., Esső, K., Dargó, G., Könczöl, Á., Balogh, G. T. "Tuning the predictive capacity of the PAMPA-BBB model", European Journal of Pharmaceutical Sciences, 79, pp. 53–60, 2015.
https://doi.org/10.1016/j.ejps.2015.08.019
[18] Sinkó, B., Garrigues, T. M., Balogh, G. T., Nagy, Z. K., Tsinman, O., Avdeef, A., Takács-Novák, K. "Skin–PAMPA:
A new method for fast prediction of skin penetration", European Journal of Pharmaceutical Sciences, 45(5), pp. 698–707, 2012.
https://doi.org/10.1016/j.ejps.2012.01.011
in precise prediction of corneal permeability. To improve the goodness of in silico prediction, a larger dataset of mea- sured permeability values would be needed to carry out a QSPR analysis that uses further physicochemical descriptors.
4 Conclusions
Due to the particularly low bioavailability of ophthal- mic formulations, the prediction of corneal permeability is essential from the early stage of drug discovery. To this avail a high throughput, non-cellular in vitro permeability assay, corneal-PAMPA has been developed. In the current study, we compared corneal-PAMPA permeability data of fifty APIs with experimental Caco-2 permeability values, which showed that the two models are independent of each other. We also investigated the relationship between logPe
and MR values and four basic physicochemical descriptors, MW, clogP, clogD7.4 and TPSA. Based on the results, we can conclude that although noticeable and obvious trends could be observed between the experimental corneal-PAMPA val- ues (logPe , MR) and the lipophilicity and TPSA descriptors, the correlations with separate parameters alone were not strong enough for precise prediction of corneal permeabil- ity. To this avail, in the future in the possession of a larger experimental dataset of corneal-PAMPA values a thorough QSPR analysis may be carried out.
Acknowledgement
This research was funded by the New National Excellence Program of the Ministry of Human Capacities (grant num- ber ÚNKP-19-2-I-BME-370).
[19] Lanevskij, K., Didziapetris, R. "Physicochemical QSAR Analysis of Passive Permeability Across Caco-2 Monolayers", Journal of Pharmaceutical Sciences, 108(1), pp. 78–86, 2019.
https://doi.org/10.1016/j.xphs.2018.10.006
[20] Hou, T. J., Zhang, W., Xia, K., Qiao, X. B., Xu, X. J. "ADME Evaluation in Drug Discovery. 5. Correlation of Caco-2 Permeation with Simple Molecular Properties", Journal of Chemical Information and Computer Sciences, 44(5), pp. 1585–1600, 2004.
https://doi.org/10.1021/ci049884m
[21] Gozalbes, R., Jacewicz, M., Annand, R., Tsaioun, K., Pineda-Lucena, A. "QSAR-based permeability model for drug- like compounds", Bioorganic & Medicinal Chemistry, 19(8), pp. 2615–2624, 2011.
https://doi.org/10.1016/j.bmc.2011.03.011
[22] ChemAxon Ltd. "Marvin Calculator Plugins were used for structure property prediction and calculation (v. 19.19.0)", [computer program]
ChemAxon Ltd., Available at: https://www.chemaxon.com/prod- ucts/calculators-and-predictors [Accessed: 29 December 2019]
[23] GraphPad Software "GraphPad Prism version 7.03 for Windows was used", La Jolla California, USA, [computer program] Available at:
https://www.graphpad.com/ [Accessed: 29 December 2019]
![Fig. 1 Correlation between experimental corneal-PAMPA and Caco-2 permeability values, r is the Pearson correlation coefficient [23].](https://thumb-eu.123doks.com/thumbv2/9dokorg/972082.58155/4.892.108.401.869.1086/correlation-experimental-corneal-pampa-permeability-pearson-correlation-coefficient.webp)
![],themicrobiotacomposition differentacrossskinareas,creatingadiverseenvironmentformicrobiota[ ].Inparallelwiththephysiologicalpropertiesandchemicalmilieu[ RegionalDifferencesinthePermeabilityBarrieroftheSkin—ImplicationsinAcantholyticSkinDiseases](data:image/gif;base64,R0lGODlhAQABAIAAAP///wAAACH5BAEAAAAALAAAAAABAAEAAAICRAEAOw==)