Abstract
Groundwater dynamics and recharge trends were evaluated for three years (2008 – 2011) to elucidate the daily, monthly and seasonal response to climate and irrigation. Observed water levels ranges between 120 – 1180 mm, below ground level (b.g.l.) in the identified soil profiles in the area; a good correlation of water level exist in the area despite differing soil profile types and non- uniform irrigation regime in the dry season. Analysis for trend, change and randomness reveals high diurnal variations in the cool dry season, hot dry season and wet season. Exponential smoothing model was found to adequately predict groundwater recharge and discharge in the area. A new cropping schedule was proposed to forestall low crop yields caused by the new groundwater regime.
Keywords
groundwater dynamics, recharge trends, water level changes, randomness test
1. Introduction
Shallow groundwater tables have been shown to provide a portion of crop water needs [1]; this suggests that irrigation water demand could be reduced under a conjunctive use of available water resources. According to [2], water scarcity is a major occurrence in arid and semi-arid regions of the world; the vagaries of the weather and climate change realities have placed all resources, agricultural activities and ecosystem services under severe stress.
The food security implication of this development is quite enormous especially in developing countries like Nigeria where the agricultural production system is predominantly rain-fed [3].
Utilization of shallow groundwater for crop cultivation experienced a boom in Nigeria following the initiation of the National Fadama Development Project in 1991; this led to the national mapping of shallow groundwater zones in the country and a radical development of valley bottoms for dry season farming to boost food security [4][5]. These efforts were meant to compliment the initial efforts of establishing large scale irrigation schemes following the Sahelian drought of 1970s; many of the schemes so establish were bedevilled with serious problems such as huge maintenance cost, salinization, poor irrigation water management, weak cost recovery and reduction of river flows
(climate change). While the successes recorded at that time were unprecedented, they were however, short lived and continuity was a huge challenge leading to many of the schemes becoming dilapidated and/or abandoned in subsequent years [6]. The climate change problem has tremendous effect on water availability on all the irrigation schemes located in semi-arid northern Nigeria leading to the need to develop and apply water- saving practices, e.g., improving the canal system, using water saving irrigation technology and adjusting cropping patterns in order to achieve sustainable agricultural development and river basin environmental equilibrium [7, 8]. The most efficient and adaptable water saving measure to the region is the development of conjunctive use of both surface water and groundwater in the irrigation schemes; irrigation return flows could be reused where there are adequate drainage structures and a monitoring programme for groundwater. Over the years, groundwater irrigation has made substantial contribution to agriculture and food security, and has lifted many millions of households out of poverty [9]. The FAO estimated that more than one-third of the world’s 303 million ha irrigated area is served by groundwater;
over 70 % of this is in Asia [10].
An understanding of groundwater dynamics and recharge trends in irrigated lands is therefore imperative for implementing a conjunctive water use system in semi-arid regions; literature suggests that diurnal fluctuations of groundwater on irrigated lands are principally induced by three main factors: evaporation, barometric pressure and tidal actions; other factors include topography, soil type, land use, water management practices and anthropogenic impacts [11-13]; all these are made possible by the hydrodynamic balance caused by the interactions between atmospheric, surface and subsurface water systems represented by the hydrological cycle. The study of groundwater dynamics in agricultural lands is a vital requirement for an efficient management of water resources; several approaches have been highlighted in literatures [14]. The flow of water within confined and unconfined aquifers is complex and may require extensive data and detailed modelling to understand. However, relatively simple data, such as water levels in a carefully designed network of monitoring wells, can be combined with estimates of rainfall input to provide key indications of groundwater dynamics and recharge.
The objectives of this research was to evaluate the dynamics of groundwater and to elucidate recharge trends in the largest irrigation scheme in the semi-arid region of Nigeria with a view to providing inputs for the development of a conjunctive water HUNGARIAN AGRICULTURAL ENGINEERING
N° 33/2018 48-54
Published online: http://hae-journals.org/
HU ISSN 0864-7410 (Print) / HU ISSN 2415-9751(Online) DOI: 10.17676/HAE.2018.33.48
GROUNDWATER DYNAMICS AND RECHARGE TRENDS IN SEMI-ARID IRRIGATED LANDS OF NIGERIA
Author(s):
A. Sobowale1– A. A. Ramalan2– O. J. Mudiare2– M. A. Oyebode2 Affiliation:
1Department of Agricultural and Bioresources Engineering, Federal University of Agriculture, P.M.B. 2240 Abeokuta 110001, Nigeria.
2Department of Agricultural Engineering, Ahmadu Bello University, Zaria, Nigeria Email address:
sobowalea@funaab.edu.ng, ramalanaa@aol.com, ojmudiare@yahoo.com, muyideenoyebode2004@yahoo.com PERIODICAL OF THE COMITTEE OF
AGRICULTURAL AND BIOSYSTEM ENGINEERING OF
THE HUNGARIAN ACADEMY OF SCIENCES and
SZENT ISTVÁN UNIVERSITY Faculty of Mechanical Engineering Received: 2018.03.26.; Accepted: 2018.07.16.
management system as an adaptation to climate change realities in Sub Saharan Africa (SSA).
2. Materials and Methods
The study was conducted at the Irrigation Research station (IRS), Kadawa, within the West Branch of the Kano River Irrigation Project located between Longitude 8o2514711and 8o2611211 and
Latitude 11o3813011and 11o3815111; Table 1 shows the hydraulic characteristics of soils at the study site. The experimental farmland belong to Sudan savannah agro-ecological zone of Nigeria characterized by a uni-modal rainfall regime, with mean annual rainfall between 700 mm – 800 mm that is always erratic, poorly distributed and falls between June and October of each year, evaporation is also high with diurnal variations as reported by [15].
Figure 1. Locations of the Study site
Table 1. Hydraulic characteristics of soils at sampling points [17]
Data collection and Analysis
Groundwater level monitoring was carried out daily for three years (2008/2009, 2009/2010, and 2010/2011) at 15 locations using randomly installed piezometers in three replicates in each identified soil profile types shown in Figure 1; in order to minimize sampling errors, double measurements of groundwater levels was implemented using a combination of an automatic water level dipper and an improvised float gauge. The data obtained were subjected to statistical analysis using TREND® v1.0.2 software to detect trend, change and randomness in the time series; the tests include: Mann-Kendall test and Spearman’s Rho test (non-parametric test for trend), Linear Regression test (parametric test for trend); Distribution-Free CUSUM test (non- parametric test for step jump in mean), Cumulative Deviation test
and Worsley Likelihood Ratio test (parametric test for step jump in mean); Rank-Sum test (non-parametric test for difference in median from two data periods) and Student’s t test (parametric test for difference in mean from two data periods); Median Crossing test, Turning Points test, Rank Difference test (non- parametric test for randomness) and Autocorrelation test (parametric test for randomness). Groundwater recharge and discharge on the farmland were computed on a spread sheet (Microsoft Excel®) using water level fluctuation (WLF) method [16]; the resulting groundwater recharge and discharge hydrographs were analysed for trends and subjected to goodness of fit to evaluate possible prediction of groundwater recharge and discharge in the area using moving average and exponential smoothing methods.
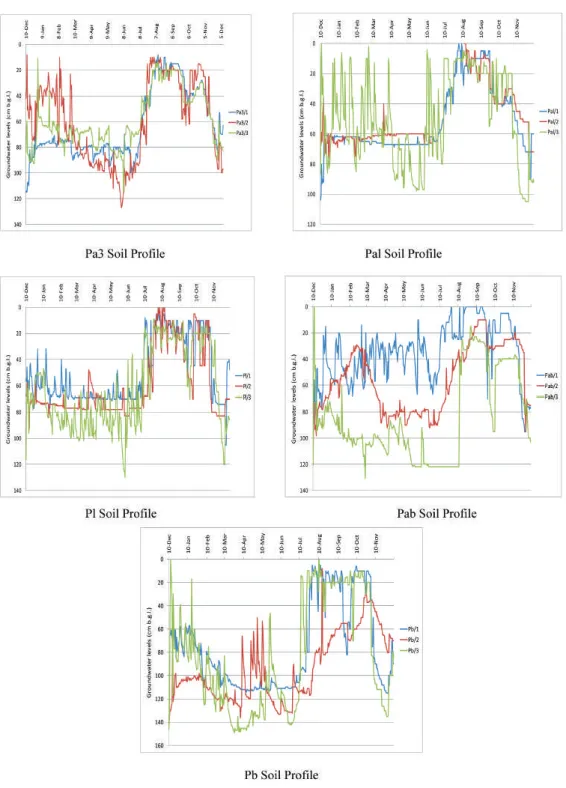
Figure 2. Groundwater trend in all soil profile types in the study area
3. Results and Discussion Trend of Groundwater level
The groundwater regime at the IRS farmland reveals high diurnal variations that were found to be dependent on season.
Groundwater level changes rapidly in response to events of irrigation in the dry season and rainfall in the wet season. This observed behaviour was due to the continuous cropping practiced on the farmland throughout the year; it was observed that water levels were generally high (near ground surface) in the wet months, worthy of note was the observation that most parts of the farmland is completely waterlogged in the month of July, August, September and some parts of October making the field suitable for lowland rice production at those periods. Slight variations in groundwater levels were observed in all the soil profile types found at the site; observed water levels ranges between 120 – 840 mm, 90 – 740 mm, 80 – 880 mm, 170 – 940 mm and 190 – 1180 mm below ground level (b.g.l.) in the Pa3, Pal, Pl, Pab and Pb soil profiles respectively. Figure 2 present the observed groundwater level trends at the study locations.
It was generally observed that the water table was lowest (deep) in Pb soil profile within the period of study; this part of the land also gave the least diurnal variation. This might be due to the land use in that part of the farm as it remained fallow in the period of study; some of the local farmers interviewed explained that the area was abandoned due to suspected salt build up leading to low crop yield from that part of the field. An examination of the soil characteristics revealed that this portion of the farmland lies towards the direction of groundwater flow hence was always waterlogged for most parts of the year. Contrary to farmers’
opinion, [15] reported that there was no salt build up in this part of the farmland.
Correlation analysis reveals that there was a good correlation in observed groundwater levels among the 15 piezometers regardless of differing soil profile types and non-uniform irrigation regime in the dry season. Strong correlation was observed among the piezometers replicated in the same soil profile types, this shows that groundwater levels in all the soil profile types on the farmland can be predicted by simple linear regression regardless of the season; this information is very pertinent for the development of a regional groundwater model for the area. Some cases of poor correlations were also observed;
this is however of no significant consequences. When the data was analysed on annual basis, no observable trend was identified;
however, exploratory data analysis (EDA) show that the groundwater levels reveal both periodic and linear trend as shown in Figure 2; these can be easily understood by seasonal analysis.
Seasonal decomposition of the data was carried out based on the identified seasons in the area namely; cool dry season (108 days), hot dry season (73 days) and wet season (183 days).
Cool dry season
The mean water level in the cool dry season was 720 mm, 750 mm, 700 mm, 760 mm and 870 mm b.g.l. in Pa3, Pal, Pl, Pab and Pb soil profiles respectively. The tests for trend (Mann-Kendall, Spearman rho, and Linear Regression) reveal that there was a statistically significant trend at α < 0.01 level in Pl, Pab, and Pb soil profiles, respectively. The Pa3 profile however displayed a significant trend at α < 0.05 level while there was no significant trend of groundwater level observed in Pal soil profile. The implication of these observations of increasing groundwater level trend is that it can lead to the twin menace of waterlogging and soil salinization. Waterlogging brings about changes in cropping schedules and reduces the agricultural potentials of irrigated lands. Soil salinity on the other hand influences agricultural
productivity due to reduced crop yield which has direct consequences on food security. The results compares favourably with that reported by [18], where over 8.4 million hectares of irrigated lands in semi-arid regions of India has been affected by soil salinity and alkalinity, out of which about 5.5 million hectares are waterlogged.
Hot dry season
The hot dry season has a mean water level of 770 mm, 620 mm, 740 mm, 800 mm and 1080 mm b.g.l. in Pa3, Pal, Pl, Pab and Pb soil profiles, respectively. There was a statistically significant trend at α < 0.01 level in Pa3 and Pab soil profiles, respectively;
no significant trend was observed in Pal, Pl and Pb soil profiles in the hot dry season. The tests for step jump in mean (Distribution Free CUSUM, Cumulative Deviation and Worsley Likelihood Ratio) show a statistically significant step jump in all the soil profiles, it was observed generally that water levels had higher values at the beginning of the season than latter part of the season implying that the water levels are subject to change throughout the season in all the soil profiles. The tests for randomness (Median Crossing, Turning Points, Ranked Difference and Autocorrelation) revealed that the water level data do not come from a random process at α < 0.01 level. The tests for step jump in mean (Distribution Free CUSUM, Cumulative Deviation and Worsley Likelihood Ratio) show a generally statistically significant step jump in all the soil profiles at α <
0.01, it was observed that water levels had higher values at the beginning of the season than latter part of the season in Pa3 profile implying that the water levels are subject to change; it was equally observed that the mean water level was lower at the beginning of the season than towards the end in Pab, Pal, Pb and Pl soils. The tests for randomness (Median Crossing, Turning Points, Ranked Difference and Autocorrelation) revealed that variations in the water level in this season do not come from a random process at α<0.01 level.
Wet Season
The mean water level in the 172 days of the wet season was 420 mm, 360 mm, 400 mm, 490 mm and 600 mm in Pa3, Pal, Pl, Pab and Pb soil profiles respectively. The tests for trend (Mann- Kendall, Spearman rho, and Linear Regression) reveal that there was a statistically significant trend at α < 0.01 level in all the soil profiles. The tests also revealed that all the profiles reveal a decreasing trend of groundwater levels. The tests for step jump in mean (Distribution Free CUSUM, Cumulative Deviation and Worsley Likelihood Ratio) show a statistically significant step jump in all the soil profiles at α < 0.01; it was also observed generally that water levels had higher values at the beginning of the season than latter part of the season implying that the water levels has a rising profile as the rains (which is solely responsible for the rise at this time) increase in amount and intensity. This suggests that groundwater levels in the wet season could be fairly predicted from rainfall amounts in the wet season using a linear model. The tests for randomness (Median Crossing, Turning Points, Ranked Difference and Autocorrelation) revealed that the water level data do not come from a random process at α < 0.01 level.
Implications for crop planning
A salient outcome of the water level studies in the area is the need for change in the cropping schedule on the farmland. Some crops planned for the area is no longer feasible because of the new groundwater regime; farmers who are still adhering to the old
cropping schedule are experiencing low crop yield. Adequate root zone depth is essential for good crop productivity and access to soil air; the pore spaces in the soil have now been filled with water indicating very poor land drainage caused by deteriorating drainage system on the farmland. The use of tile drains is suggested for the area.
The following crops are suggested for cropping on the farmland: Wet season (Rice); Cool dry season (Wheat, Potatoes,
Onions, Pepper, Tomatoes, Vegetables and Maize); Hot dry season (Maize, Onions, Cowpea, Tomatoes and Vegetables).
These are crops that could be supported by the groundwater regime observed on the farmland; however, further studies need to be carried out to confirm these suggestions.
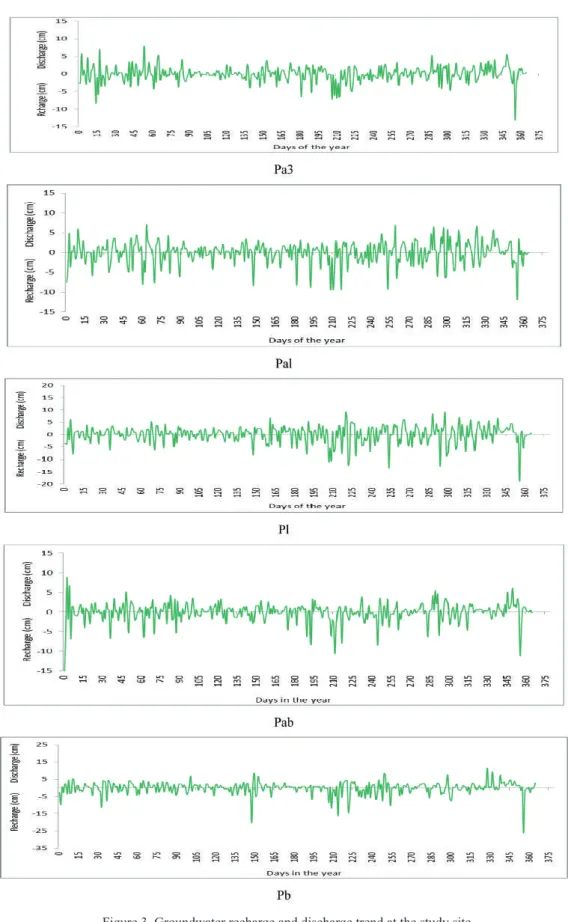
Figure 3. Groundwater recharge and discharge trend at the study site
Groundwater recharge and discharge prediction
The W.L.F analysis was based on the premise that groundwater rises as a result of recharge water arriving at the water table while groundwater discharge takes place when water flows away from storage which is evident by the reduction of water level. Figures 3 presents the hydrological time series of mean daily groundwater recharge and discharge from the five soil profile types on the farmland. The pattern displayed is very similar to that observed in the groundwater levels presented earlier. Groundwater recharge ranges between 10 mm – 60 mm as the case may be on a daily basis, this variation in recharge and discharge was found to oscillate about zero in all the soil profile types. Stemming from visual inspection of these time series plots, no visible trend can be seen in the 1095 days of data in all the soil profiles. However, all of them exhibit cyclical variation which is an indication that the series has only a periodic component; the implication is that days of recharge are immediately followed by days of discharge.
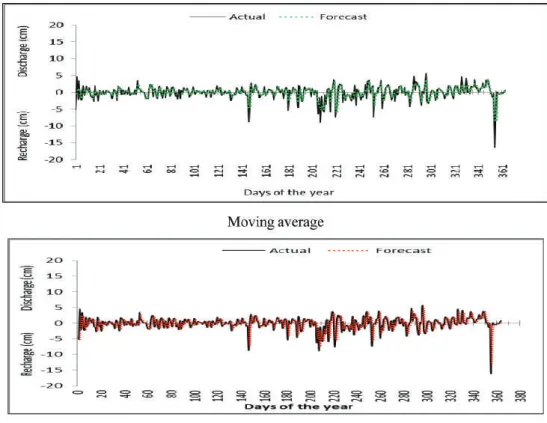
Predicting recharge and discharge in this scenario was no doubt a daunting task. Attempts were made to fit the data series without any good success, simply because the values in the daily series were very small and make analysis very problematic. The data series showed an evidence of a partial fit when moving average was considered; this method of forecasting did not account for some data points in the series, hence was not accepted as having a good fit. When exponential smoothing was considered, a better fit for the data with insignificant residuals was obtained as shown in figure 4. This better fit is indicative of the fact that values of groundwater recharge and discharge can easily be predicted when previous values are known and α = 0.2. The equation of fit was:
Where Re is predicted recharge or discharge at time t or t+1 in cm, Ra is the actual value of recharge or discharge at time t in cm
and α is a constant (0.01 < α < 0.3).
4. Conclusion
Groundwater dynamics and recharge trends at the Irrigation Research Station, Kadawa within the Kano River Irrigation Project had been evaluated for three years. The results revealed a very high diurnal variation of groundwater level trend in the period of study; statistical tools for trend indicate significant trend at α < 0.01 level in Pl, Pab, and Pb soil profiles, respectively in the cool dry season while groundwater level changes rapidly in response to irrigation in the dry season and rainfall in the wet season as a result of intensive cropping on the farmland. Water levels ranges between 120 – 840 mm, 90 – 740 mm, 80 – 880 mm, 170 – 940 mm and 190 – 1180 mm below ground level (b.g.l.) in the Pa3, Pal, Pl, Pab and Pb soil profiles respectively.
There was a good correlation of groundwater levels at the monitoring locations regardless of differing soil profile types and non-uniform irrigation regime in the dry season indicating that groundwater levels can be predicted by simple linear regression.
There is also the need to change the cropping schedule as crops planned for the farmland are no longer feasible because of the new groundwater regime; the old cropping schedule should be discontinued because of low crop yield. The following crops are suggested for cultivation on the farmland: Wet season (Rice);
Cool dry season (Wheat, Potatoes, Onions, Pepper, Tomatoes, Vegetables and Maize); Hot dry season (Maize, Onions, Cowpea, Tomatoes and Vegetables). These are crops that could be supported by the groundwater regime observed on the farmland;
however, further studies need to be carried out to confirm these suggestions. Prediction of groundwater recharge in the area was found to be possible using exponential smoothing method which gave minimal prediction errors. A very good fit was obtained between actual and predicted groundwater recharge in the area.
(1)
Figure 4. Actual and forecasted recharge and discharge at the study site
Acknowledgement
The researchers are grateful to the management of Irrigation Research Station, Kadawa, for the use of their facilities. All the technicians and field staff that contributed in data gathering are gratefully acknowledged. Special thanks to Mr. Jeremiah Wuya, Mr. Eddy Emmanuel and Late Malam Tijani for their invaluable contributions.
References
[1] Babajimopoulos C., Panoras A., Georgoussis H., Arampatzis G., Hatzigiannakis E., Papamichail D.: 2007.
Contribution to irrigation from shallow water table under field conditions. Agricultural Water Management, Vol. 92. No. 3. pp.
205-210.
https://doi.org/10.1016/j.agwat.2007.05.009
[2] Han, D., Song X., Curell M. J., Cao G., Zhang Y., Kang Y.:2011. A survey of groundwater levels and hydrogeochemistry in irrigated fields in the Karamay AgriculturalDevelopment Area, northwest China: Implications for soil and groundwater salinity resulting from surface water transfer for irrigation. Journal of Hydrology, Vol. 404. No. 3-4. pp. 217-234.
https://doi.org/10.1016/j.jhydrol.2011.03.052
[3] Sobowale, A., Sajo S. O., Ayodele O.E.:2016. Analysis of Onset and Cessation of Rainfall in Southwest Nigeria: Food Security Impact of Variability in the Length of Growing Season.
Hungarian Agricultural Engineering, Vol. 30. pp. 23-30.
http://dx.doi.org/10.17676/HAE.2016.30.23
[4] Aboyeji O. S.: 2016. Hydro-period dynamics of some inland valley agroecosystems in southwest Nigeria. African Geographical Review, Vol. 35. No. 3. pp. 294-305.
https://doi.org/10.1080/19376812.2016.1168308
[5] Tijani M. N., Obayelu A. E., Sobowale A., Olatunji A.S.:
2014. Welfare Analysis of Smallholder Farmers by Irrigation Systems and Factors Affecting their Production Outputs in Nigeria, Sustainability of Water Quality and Ecology, Vol. 3-4.
pp. 90-100. https://doi.org/10.1016/j.swaqe.2014.12.002 [6] Sangari D. U.: 2006 An Evaluation of Water and Land Uses in the Kano River Project, Phase I, Kano State. J. Appl. Sci.
Environ. Mgt, Vol. 11. No. 2. pp. 105-111.
http://dx.doi.org/10.4314/jasem.v11i2.55002
[7] Xu X., Huang G., Qu Z., Pereira L. S.:2010. Assessing the groundwater dynamics and impacts of water saving in the Hetao Irrigation District, Yellow River basin. Agricultural Water Management, Vol. 98. pp- 301–313.
https://doi.org/10.1016/j.agwat.2010.08.025
[8] Akande O. K., Olagunju R. E., Aremu S. C., Ogundepo E.
A.: 2018. Exploring Factors Influencing of Project Management
Success in Public Building Projects in Nigeria. YBL Journal of Built Environment, Vol. 6. No. 1. pp. 47-62.
http://dx.doi.org/10.2478/jbe-2018-0004
[9] Siebert S., Burke J., Faures J. M., Frenken K., Hoogeveen J., Doll P., Portmann F. T.: 2010. Groundwater use for irrigation – a global inventory. Hydrol. Earth Syst. Sci, Vol. 14. pp. 1863–
1880. http://dx.doi.org/10.5194/hess-14-1863-2010
[10] Shah T.: 2014. Groundwater Governance and Irrigated Agriculture. TEC Background Paper No. 19, Global Water Partnership, Stockholm, Sweden.
[11] Petheram C., Dawes W., Grayson R., Bradford A., Walker G.:2003. A sub-grid representation of groundwater discharge using a one-dimensional groundwater model. Hydrol.
Process, Vol. 17. pp. 2279–2295.
https://doi.org/10.1002/hyp.1332
[12] Wang S., Song X., Wang Q., Xiao G., Liu C., Liu J.:2009.
Shallow groundwater dynamics in North China Plain. J. Geogr.
Sci. Vol. 19. pp. 175-188.
https://doi.org/10.1007/s11442-009-0175-0
[13] Vircavs V., Jansons V., Veinbergs A., Abramenko K., Dimanta Z., Anisimova I., Lauva D., Liepa A.:2011. Modeling of groundwater level fluctuations in agricultural monitoring sites.
In: Lambrakis N., Stournaras G., Katsanou K. (eds) Advances in the Research of Aquatic Environment. Environmental Earth Sciences. Springer, Berlin, Heidelberg.
https://doi.org/10.1007/978-3-642-19902-8_25
[14] Jiménez-Martínez J., Candela L., Molinero J., Tamoh K.:
2010. Groundwater recharge in irrigated semi-arid areas:
quantitative hydrological modelling and sensitivity analysis.
Hydrogeology Journal, Vol. 18. pp. 1811–1824.
https://doi.org/10.1007/s10040-010-0658-1
[15] Sobowale, A., Ramalan A. A., Mudiare O. J., Oyebode M. A.: 2015. Evaluation of chloride mass balance and recharge in agricultural lands in Nigeria. Agric. Eng. Int.: CIGR Journal, Vol. 17. No. 2. pp. 11-22.
[16] Healy R. W., Cook P. G.:2002. Using groundwater levels to estimate recharge. Hydrogeology Journal, Vol. 10. 91–109.
https://doi.org/10.1007/s10040-001-0178-0
[17] Sobowale, A., Ramalan A. A., Mudiare O. J., Oyebode M. A.: 2014. Groundwater recharge studies in irrigated lands in Nigeria: Implications for basin sustainability. Sustainability of Water Quality and Ecology (SWAQE), Vol. 3–4. 124–132.
https://doi.org/10.1016/j.swaqe.2014.12.004
[18] Singh A, Panda S. N.: 2012. Effect of saline irrigation water on mustard (Brassica Juncea) crop yield and soil salinity in a semi-arid area of North India. Experimental Agriculture, Vol. 48.
pp. 99–110.
https://doi.org/10.1017/S0014479711000780
![Table 1. Hydraulic characteristics of soils at sampling points [17]](https://thumb-eu.123doks.com/thumbv2/9dokorg/1423742.120631/2.892.142.750.288.1120/table-hydraulic-characteristics-soils-sampling-points.webp)