Recycling of Mixed Poly(Ethylene-terephthalate) and Poly(Lactic Acid)
Daniel GERE1 and Tibor CZIGANY1, 2, a
1Department of Polymer Engineering, Faculty of Mechanical Engineering, Budapest University of Technology and Economics, H-1111 Budapest, Muegyetem rkp. 3, Hungary
2MTA-BME Research Group for Composite Science and Technology, H-1111 Budapest, Muegyetem rkp. 3., Hungary
Abstract. Nowadays, PLA is increasingly used as a packaging material, therefore it may appear in the petrol-based polymer waste stream. However, with the today’s mechanical recycling technologies PLA and PET bottles cannot be easily or cheaply separated. Therefore, our goal was to investigate the mechanical, morphological and thermal properties of different PET and PLA compounds in a wide range of compositions. We made different compounds from poly(ethylene-terephthalate) (PET) and poly(lactic acid) (PLA) by extrusion, and injection molded specimens from the compounds. We investigated the mechanical properties and the phase morphology of the samples and the thermal stability of the regranulates. PET and PLA are thermodynamically immiscible, therefore we observed a typical island-sea type morphology in SEM micrographs. When PLA was added, the mechanical properties (tensile strength, modulus, elongation at break and impact strength) changed significantly. The Young’s modulus increased, while elongation at break and impact strength decreased with the increase of the weight fraction of PLA. The TGA results indicated that the incorporation of PLA decreased the thermal stability of the PET/PLA blends.
1 Introduction
More and more polymers are produced and processed annually but biopolymers still only amount to slightly less than 1.5 wt% of all polymers produced [1, 2]. Biron [3] predicted that by 2040 the same amount of biopolymers will be produced as petroleum-based polymers and then more biopolymers will be produced than petroleum-based polymers. Most petroleum-based polymers and biopolymers are used to produce packaging materials, which become waste in a very short time [1, 2, 4]. There are several ways to recycle polymers—mechanical and chemical recycling, and in the case of biopolymers, also biological recycling [5]. The population and selective waste collection are not prepared to sort these polymers, therefore they can mix during recycling. The question is what happens when they are processed together. How do their mechanical, morphological and rheological properties change?
There are publications about blends of petroleum-based and biopolymers but some of these [6-8]
aimed to improve the unfavourable properties of PLA (e.g. rigidity, low tolerance of heat) [9, 10], usually with the addition of polyethylene. The blends created this way are immiscible, therefore other
a Corresponding author: czigany@eik.bme.hu
© The Authors, published by EDP Sciences. This is an open access article distributed under the terms of the Creative Commons
additives are necessary. Only a few authors examined the effect PLA as a „contaminant” [11-13], and only in a very narrow range.
For example, PLA and PET bottles cannot be easily or cheaply sorted, because both are transparent and very similar, therefore manual sorting based on visual appearance is not possible. The density of PET and PLA are similar, higher than water, therefore in the float-sink separation process, the PLA particles will follow the PET flakes to the bottom of the flotation tank. Therefore, the PLA fragments and the PET waste stream will be recycled together [14, 15]. The most widely used technique for the automated sorting of plastics [16] is Fourier Transform near-infrared (FT-NIR) spectroscopy. However the reports [14] estimate that the efficiency of the separation of PLA bottles from PET bottles is 86–99.6 % for this method.
The presence of biopolymers can significantly modify the properties of PET [11, 17]. The processing temperature of PET is around 100 °C higher than that of PLA therefore PLA starts to degrade, which leads to a yellowing of the product. Additionally, PLA has a different glass transition temperature, which results in opaqueness or haziness when PET and PLA are processed together. PLA and PET are thermodynamically immiscible, therefore holes, peaks or clusters will probably occur in the products [14].
The analysis of statistical data [1, 2] indicates that nowadays it is reasonable to examine the effect of low biopolymer “contamination” (<5 wt%). We, however, are of the opinion that as biopolymers are more and more widely used, the 20 wt%–80 wt% range should also be examined for the future, as should the effect of a small amount of petroleum-based polymer contamination of biopolymers.
Therefore, our goal was to investigate the mechanical, morphological and thermal properties of different PET and PLA compounds in a wide composition range.
2 Experimental
2.1 Materials
We used virgin PET type NeoPET 80 (intrinsic viscosity (IV): 0.80 dl/g, density: 1.34 g/cm3) supplied by NeoGroup (Lithuania) as a petroleum-based component, and virgin PLA type Ingeo 3100HP (MFR (210°C, 2.16 kg): 24 g/10 min, density: 1.24 g/cm3), supplied by NatureWorks LLC. (USA), as a biobased component.
2.2 Material preparation and processing
Before processing (extrusion and injection molding), the materials were dried at 140°C in a Faithful WGLL-125 BE hot air drying oven for 6 hours. Thirteen different PET/PLA compounds (regranulates) (100/0, 99/1, 97/3, 95/5 85/15, 75/25, 50/50, 25/75, 15/85, 5/95, 3/97, 1/99, 0/100 wt/wt%) were produced with a Labtech Scientific LTE 26-44 co-rotating twin-screw extruder. The screw diameter of the extruder was 26 mm and the length/diameter (L/D) ratio was 44. The temperature profile of the extruder (from intake zone to die) was 235-240-245-250-255-260-265-270-275-270-265°C. The rotating speed of the extruder screws was 50 rpm and the melt pressure was 30-50 bar.
The injection molded samples were made with an Arburg Allrounder 370 S 700-290 injection molding machine. The injection rate was 50 cm3/s, holding pressure was 800 bar, holding time was 20 s, residual cooling time was 40 s, and melt and mold temperature were 280°C and 30°C, respectively.
The mechanical tests were carried out on ISO standard dumbbell-shaped tensile specimens.
2.3 Methods
Tensile tests were carried out on a Zwick Z005 universal testing machine. We calculated the tensile modulus between 0.05% and 0.25% strain with a crosshead speed of 1 mm/min, and determined tensile strength, breaking strength, elongation at the maximum force and elongation at break with a
crosshead speed of 10 mm/min. The measurements were performed on ISO 527-2/1A dumbbell- shaped specimens with an overall length of 170 mm and a cross-section of 4 mm × 10 mm. In every measurement, we tested 5 specimens, and calculated the average value and standard deviation.
Impact strength was determined with the Charpy impact test on a Ceast Resil Impactor Junior impact tester, with a pendulum of 2 J. The measurements were performed on 2 mm notched ISO 179- 1/1eA specimens with a length of 80 mm and a cross-section of 4 mm × 10 mm. The tests were performed at room temperature and at a relative humidity of 50%. In every measurement, we tested 10 specimens, and calculated the average and standard deviation.
The morphology of the blends was studied with a scanning electron microscope (Jeol JSM 6380LA). The SEM micrographs were taken from cryo-fractured surfaces.
Thermogravimetric analysis (TGA) was performed on samples of about 10 mg with a TA Instruments Q500 instrument over 40-600°C in an industrial grade air (78% N2, 21% O2, 1% other) atmosphere (60 ml/min) with a 10 °C/min heating speed.
3 Results and discussion
3.1 Mechanical properties of the PET/PLA blends
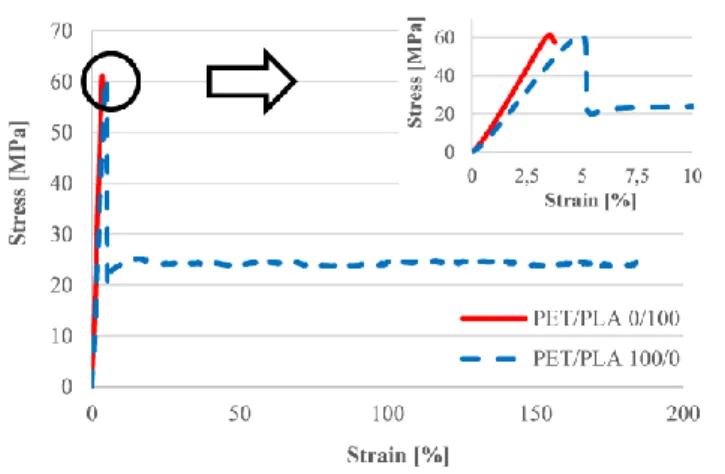
Figure 1 shows the tensile stress-strain curves of the PET and the PLA. The curves show that the PLA was rigid and PET was flexible after the neck formation.
Figure 1. Tensile stress-strain curves of 100/0 and 0/100 PET/PLA samples
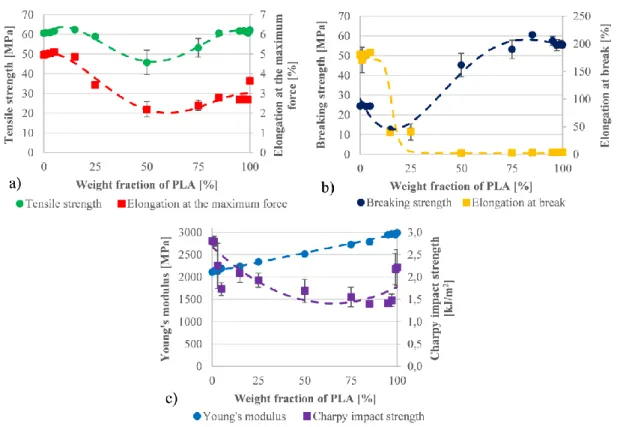
Figure 2 shows the mechanical properties of the injection molded samples of the different PET/PLA blends. The tensile strength values were similar in the case of small (≤25 wt%) and large (≥85 wt%) PLA content. However, it showed a lower value in 50/50 PET/PLA composition. When the weight fraction of PLA was increased, the elongation at the maximum force did not change initially, but then gradually decreased and was finally close to a constant value. Breaking strength in the case of low PLA content (≤25 wt%) was lower than in the other cases. It can be explained by the fact that the specimens were broken after the neck formation when the PLA content was small, while in all other cases, they were broken rigidly. In the case of low PLA content (≤5 wt%), elongation at break did not change, compared to pure PET, but when the weight fraction of PLA was further increased, it decreased sharply and stayed low. In addition to the presence of a rigid component (PLA), the degradation of PLA or both PLA and PET, and the increased droplet size (see Figure 3a–d) may also have led to a decrease in elongation at break when the weight fraction of PLA was increased. We observed that the Young’s modulus increased linearly, according to the linear rule of mixtures, with the increase of the weight fraction of PLA. On the other hand, as the weight fraction of PLA was increased, Charpy impact strength seemed to change along a parabola. 1 wt% PET or PLA
contamination did not affect Charpy impact strength, but in all other cases, it decrease significantly compared to the pure raw materials. This is due to the poor adhesion between the PET and the PLA, and to the fact that dispersed droplets are present in the blends as failures. La Mantia et al. [11] had similar results when they investigated the 99.5/0.5, 99/1, 98/2 and 95/5 PET/PLA blends.
Figure 2. Tensile strength and elongation at the maximum force (a), breaking strength and elongation at break (b), Young’s modulus and Charpy impact strength (c) in PET/PLA blends depending on the weight fraction of PLA
3.2 Morphological structure of the blends/Phase morphology of the blends
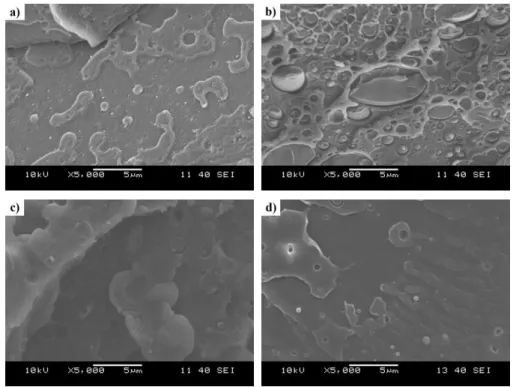
We also studied the structure of the blends by SEM (Figure 3). The micrographs were taken from cryo-fractured surfaces. The SEM micrographs indicated that a dispersed phase structure (island-sea type morphology) was formed for each composition, only the droplet size and the matrix were different. The SEM micrographs showed a typical morphology of immiscible polymer blends if one of the components had a well-defined spherical shape, very broad size distribution and a smooth fracture surface. As PLA content was increased, up to 25 wt% of PLA, the diameter of the dispersed PLA particles in the PET matrix increased from a few tenths of a micron to a few microns. In the case of a symmetrical composition (50 wt% of PET and PLA), it is not possible to determine which phase constitutes the matrix and which is the dispersed phase. However, according to the literature [18], in this case the polymer with lower viscosity forms the matrix, in our case the PLA. When the weight fraction of the PLA was further increased, it formed the matrix and PET was the dispersed phase.
Torres-Huerta et al. [12] also observed a typical island-sea type morphology in PET/PLA (95/5, 90/10 and 85/15) blends.
Figure 3. Changes in the morphology of PET/PLA blends a) 1 wt% PLA, b) 25 wt% PLA, c) 50 wt% PLA, d) 95 wt% PLA
3.3 Thermal stability of the blends
The TGA and the corresponding first derivative TGA (DTG) curves of PET/PLA blends are shown in Figure 4. The degradation onset temperature (the temperature at which 5 wt% degradation occurred) of the 100/0, 99/1, 97/3, 95/5 85/15, 75/25, 50/50, 25/75, 15/85, 5/95, 3/97, 1/99 and 0/100 PET/PLA blends were 371 °C, 369 °C, 364 °C, 358 °C, 347 °C, 342 °C, 324 °C, 324 °C, 315 °C, 318 °C, 310 °C, 315 °C and 318 °C, respectively. The maximum degradation temperature (the peak temperature of the DTG curve) of the 100/0, 99/1, 97/3, 95/5 85/15, 75/25, 50/50, 25/75, 15/85, 5/95, 3/97, 1/99 and 0/100 PET/PLA blends were 426 °C, 416 °C, 424 °C, 425 °C, 424 °C, 424 °C, 354 °C, 358 °C, 355 °C, 359 °C, 353 °C, 351 °C and 360 °C, respectively. The results indicated that the thermal degradation of the PET/PLA blends has two maximum degradation temperatures, about 355 °C and 424 °C, corresponding to PLA and PET, respectively. These results show that adding PLA to PET decreased the thermal stability of the blends. McLauchlin and Ghita [19] had similar results in a nitrogen atmosphere when they investigated PET/PLA blends which contained 0.5, 1, 2, 5, 10 and 20 wt% of PLA.
Figure 4. TGA (a) and DTG (b) curves of the different PET/PLA blends
4 Conclusions
We investigated the mechanical and morphological properties, and the thermal stability of different PET/PLA blends. The stress-strain curves showed that PET was elastic and PLA was rigid. As the weight fraction of PLA was increased from 0% to 100%, the Young’s modulus increased from 2109 MPa to 2990 MPa, while elongation at break decreased from 180 % to 4 %. The tensile strength values were similar in the case of low (≤25 wt%) and high (≥85 wt%) PLA content. In SEM micrographs, we observed a typical island-sea type morphology in all the PET/PLA blends. Therefore, the two components are thermodynamically incompatible, at least in the concentrations investigated.
The thermal stability of the blends was decreased when PLA was added to the blends. The result indicate that blends with more than 3 wt% PLA contamination or more than 1 wt% PET contamination would probably result in a lot of faulty products, due to the immiscibility of the components.
Acknowledgements
This paper was supported by the National Research, Development and Innovation Office (grant number: NVKP_16-1-2016-0012) and by the Higher Education Excellence Program of the Ministry of Human Capacities in the frame of Nanotechnology research area of Budapest University of Technology and Economics (BME FIKP-NANO).
References
1. PlasticsEurope, Plastics – the Facts 2016 (PlasticsEurope AISBL, Brussels, 2017)
2. European Bioplastics, Bioplastics packaging – combining performance with sustainability (European Bioplastics e.V., Berlin, 2017)
3. M. Biron, Industrial applications of renewable plastics: environmental, technological, and economic advances (William Andrew, Oxford, 2017)
4. R. Geyer, J. R. Jambeck, K. L. Law, Sci. Adv., 3, e1700782 (2017) 5. A. Soroudi, I. Jakubowicz, Eur. Polym. J., 49, 2839-2858 (2013)
6. X. Lu, L. Tang, L. Wang, J. Zhao, D. Li, Z. Wu, P. Xiao, Polym. Test., 54, 90-97 (2016) 7. N. Yarahmadi, I. Jakubowicz, J. Enebro, J. Appl. Polym. Sci., 133, 43916 (2016)
8. Y. F. Kim, C. N. Choi, Y. D. Kim, K. Y. Lee, M. S. Lee, Fiber. Polym., 5, 270-274 (2004) 9. C. Vasile, M. Râpă, M. Ștefan, M. Stan, S. Macavei, R. N. Darie-Nită, L. Barbu-Tudoran, D. C.
Vodnar, E.E. Popa, R. Ștefan, G. Borodi, M. Brebu, Express Polym. Lett., 11, 531-544 (2017) 10. W. S. Chow, Y. Y. Leu, Z. A. M. Ishak, Period. Polytech. Mech. Eng., 60, 15-20 (2016) 11. F. P. La Mantia, L. Botta, M. Morreale, R. Scaffaro, Polym. Degrad. Stabil., 97, 21-24 (2012) 12. A. M. Torres-Huerta, D. Palma-Ramírez, M. A. Domínguez-Crespo, D. Del Angel-López, D. de
la Fuente, Eur. Polym. J., 61, 285-299 (2014)
13. D. Gere, T. Czigany, Waste Manage., 76, 190-198 (2018)
14. L. Alaerts, M. Augustinus, K. Van Acker, Sustainability, 10, 1487 (2018)
15. M. R. Gent, M. Menendez, J. Torano, I. Diego, Waste Manage. Res., 27, 175-187 (2009) 16. J. Hopewell, R. Dvorak, E. Kosior, Philos. Trans. R. Soc. B-Biol. Sci., 364, 2115-2126 (2009) 17. D. D. Cornell, J. Polym. Environ., 15, 295-299 (2007)
18. J. K. Lee, C. D. Han, Polymer, 41, 1799-1815 (2000)
19. A. R. McLauchlin, O. R. Ghita, J. Appl. Polym. Sci., 133, 44147 (2016)