i
LARGE SCALE ANNOTATION OF BIOMOLECULAR DATA USING INTEGRATED DATABASE MANAGEMENT TOOLS
Ph.D. dissertation
Pázmány Péter Catholic University
Faculty of Information Technology and Bionics
Roberto Vera Alvarez
Supervisor: Prof. Sándor Pongor
2014
ii
i
Abstract
Bioinformatics experiments usually require efficient computational systems that streamline the data processing. Recent advances in high-throughput technologies have been expanding the experimental scenario. This fact is producing an avalanche of unmanageable data converting the biological sciences from a poor data discipline to a rich one. Furthermore, next-generation sequencing (NGS) technologies created to sequence very long DNA pieces at low cost, are widely used to generate biological data. Unfortunately, the bioinformatics‘ tools haven‘t changed their algorithms and computational techniques to deal with this data explosion. Therefore, the integration of biological data, as a product of those technological advances, is far from being a solved task although it is one of the most important and basic element inside the bioinformatics research and/or System Biology projects.
Hence, in this thesis, we developed a biological data integration framework (JBioWH) that has a modular design for the integration of the most important biological databases. The framework is comprised of a Java API for external use, a desktop client and a webservices application. This system has been supplying integrative data for many bioinformatics projects. Also, a program (Taxoner) was developed to identify taxonomies by mapping NGS reads to a comprehensive sequence database. As a result of alterations to the indexing used, this pipeline is fast enough to run evaluations on a single PC, and is highly sensitive; as a result, it can be adapted to the analysis problems such as detecting pathogens in human samples. Finally, a workflow for DNA sequence comparison is presented. This workflow is applied either to create a marker database for taxonomy binning or just to obtain unique DNA segments among a group of targets sequences. It is based on a set of in-house developed programs that includes the JBioWH and Taxoner. All the programs developed are freely available through the Google Code Platform.
ii
iii
List of Publications
1. Pongor L S, Vera R, Ligeti B, Fast and sensitive alignment of microbial whole genome sequencing reads to large sequence datasets on a desktop PC: application to metagenomic datasets and pathogen identification. PloS one 2014; 9(7):e103441.
2. Dogsa I, Choudhary KS, Marsetic Z, Hudaiberdiev S, Vera R, Pongor S, Mandic-Mulec I: ComQXPA Quorum Sensing Systems May Not Be Unique to Bacillus subtilis: A Census in Prokaryotic Genomes.
PloS one 2014, 9(5):e96122.
3. Vera R, Perez-Riverol Y, Perez S, Ligeti B, Kertész-Farkas A, Pongor S: JBioWH: an open-source Java framework for bioinformatics data integration. Database: the journal of biological databases and curation 2013, 2013:bat051.
4. Kertész-Farkas A, Reiz B, Vera R, Myers MP, Pongor S: PTMTreeSearch: a novel two-stage tree- search algorithm with pruning rules for the identification of post-translational modification of proteins in MS/MS spectra. Bioinformatics (Oxford, England) 2013, 30:234-241.
5. Ligeti B, Vera R, Lukacs G, Gyorffy B, Pongor S: Predicting effective drug combinations via network propagation. In: 2013 IEEE Biomedical Circuits and Systems Conference (BioCAS). IEEE; 2013: 378-381.
6. Perez-Riverol Y, Vera R, Mazola Y, Musacchio A: A parallel systematic-Monte Carlo algorithm for exploring conformational space. Current topics in medicinal chemistry 2012, 12:1790-1796.
7. Perez-Riverol Y, Sánchez A, Ramos Y, Schmidt A, Müller M, Betancourt L, González LJ, Vera R, Padron G, Besada V: In silico analysis of accurate proteomics, complemented by selective isolation of peptides. Journal of proteomics 2011, 74:2071-2082.
8. Sanchez A , Perez-Riverol Y , González LJ , Noda J, Betancourt L, Ramos Y, Gil J, Vera R, Padrón G , Besada V: Evaluation of Phenylthiocarbamoyl-Derivatized Peptides by Electrospray Ionization Mass Spectrometry: Selective Isolation and Analysis of Modified Multiply Charged Peptides for Liquid Chromatography-Tandem Mass Spectrometry Experiments. Analytical chemistry 2010, xxx:552-559.
9. Mazola Reyes Y, Chinea Santiago G, Guirola Cruz O, Vera Alvarez R, Huerta Galindo V, Fleitas Salazar N, Musacchio Lasa A: Chemical compounds having antiviral activity against dengue virus and other flaviviruses. In.: WO/2009/106019; 2009.
10. Rodriguez Fernandez RE, Vera Alvarez R, de la Nuez Veulens A, Mazola Reyes Y, Perea Rodriguez SE, Acevedo Castro BE, Musacchio Lasa A, Ubieta Gomez R: Antineoplastic compounds and pharmaceutical compositions thereof. In.: WO/2006/119713; 2006.
iv
v
List of Abbreviations
Bp Base pair
BWT Burrows-Wheeler transforms DBG Bruijn Graph
LC Liquid chromatography mRNA messenger RNA
MS Mass Spectrometry
NGS Next-generation sequencing OLC Overlap/Layout/Consensus PCR polymerase chain reaction RAM Random-access memory rRNA ribosomal RNA
tRNA transfer RNA
WGS Whole-genome shotgun XML eXtensible Markup Language
vi
vii
List of Figures
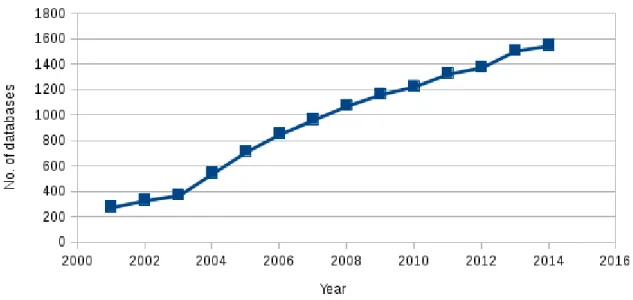
Figure 1: Biological database growth during the last decade ... 12
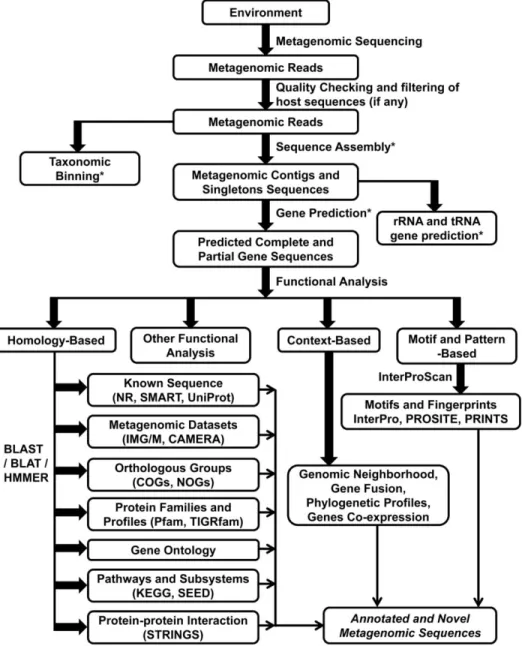
Figure 2: Flow chart for the analysis of a metagenome from sequencing to functional annotation. Only the basic flow of data is shown up to the gene prediction step. For the context-based annotation approach, only the gene neighborhood method has been implemented thus far on metagenomic data sets; although in principal, other approaches which have been used for whole genome analysis can also be implemented and tested [84]. ... 17
Figure 3: Overlap between protein databases. Figure from ProgMap [1] server. ... 28
Figure 4: The JBioWH architecture and the relationship between the components ... 39
Figure 5: Loading times against the number of elements inserted. The outliners are the Draft Genomes (48 084 s), KEGG (50 416) and UniProt TREMBL (253 304 s). ... 40
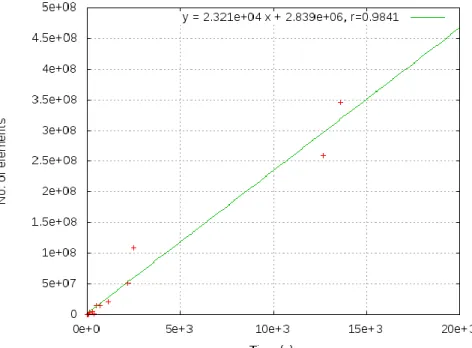
Figure 6: Linear correlation between the loading times and the number of elements inserted. The outliers are left out ... 41
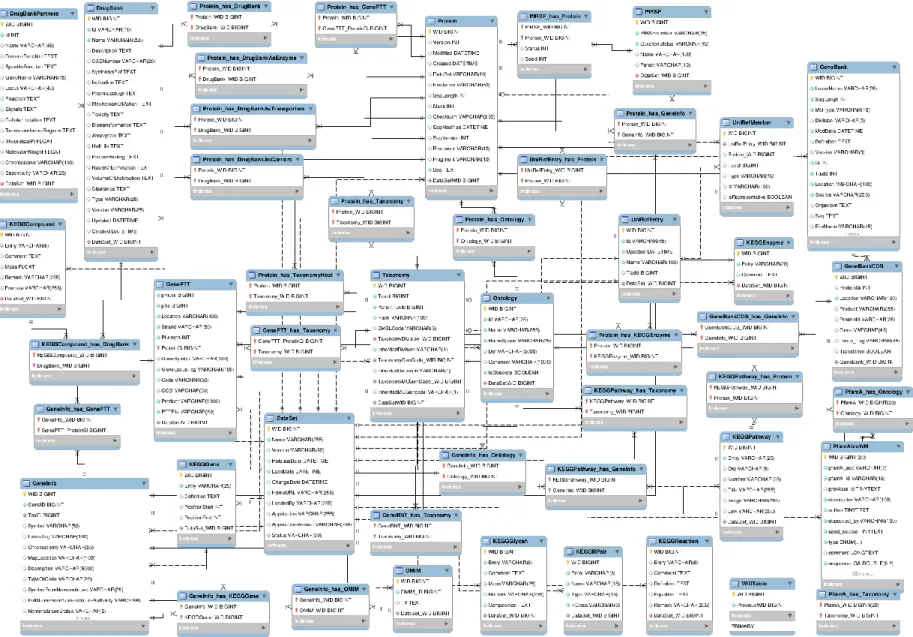
Figure 7: JBioWH relational schema with the main tables and their relationship. ... 44
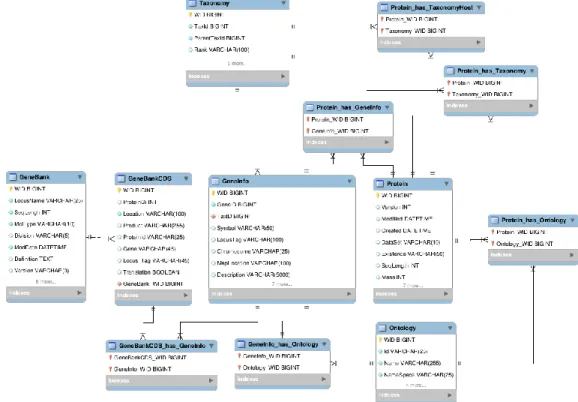
Figure 8: The relations between the Basement and first group of modules ... 47
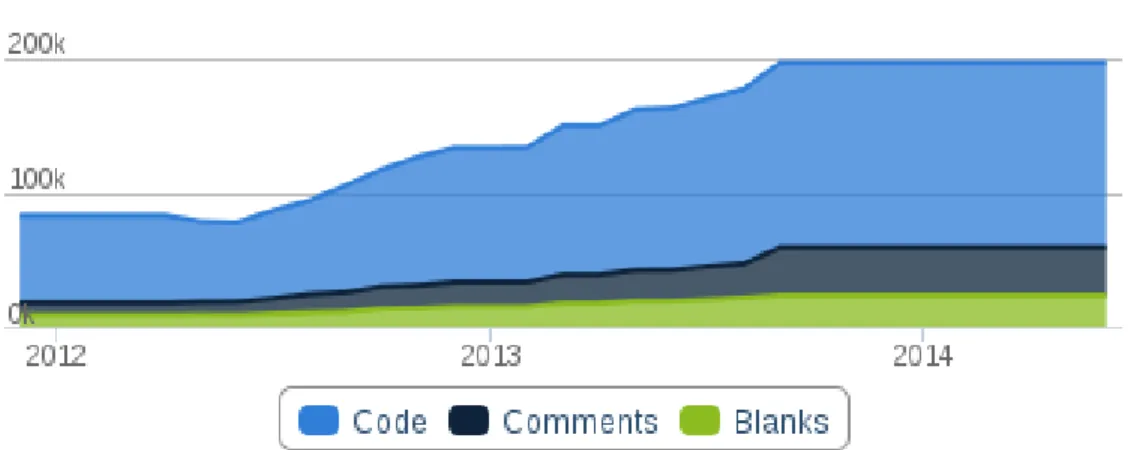
Figure 9: The number of code lines included into the JBioWH framework. Statistics taken from http://www.ohloh.net/p/jbiowh/ ... 52
Figure 10: Number of code lines in the JBioWH framework. Statistics taken from http://www.ohloh.net/p/jbiowh/ 52 Figure 11: The functionality to manage the DBMS. ... 53
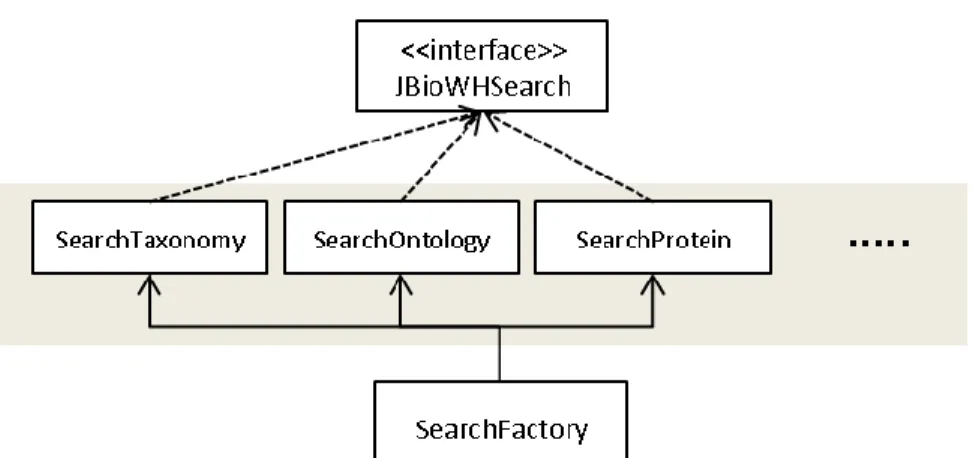
Figure 12: The structure of the Search functionality. The interface JBioWHSearch is implemented by the modules search classes that extends the SearchFactory abstract class. ... 54
Figure 13: The JBioWH parser structure. ... 54
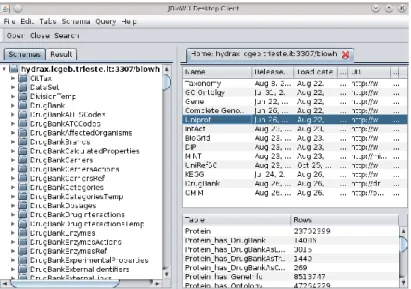
Figure 14: A screenshot of JBioWH Desktop Client. The left panel shows the relational schemes opened. The top right panel shows the list of the database inserted in the relational scheme, while on the bottom left panel one can see the tables in the selected database. ... 55
Figure 15: The search interface with constrains. ... 56
Figure 16: The SQL query interface with the result list. ... 57
Figure 17: The result interface showing the gene linked to the protein. ... 57
Figure 18: The webservices associated web site showing the available Datasets... 58
Figure 19: The available webservices methods for the Protein module. ... 59
Figure 20: Mapping of reads to bacterial strains using artificial chromosomes. A strain is a segment of the artificial chromosome that is named by a label in the taxonomical hierarchy. ... 68
Figure 21: Mapping of reads to gene functions within an annotated genome. A gene is a segment of the genome that is named by a label in the functional hierarchy, such as the COG/EggNOG system or the GO databases. .. 69
Figure 22: COG Functional classification made by the Gene Assignment tool for the genes identified by Taxoner.. 74
viii
Figure 23: Reads, unique segments and markers (left), cumulative coverage values (right). Note that reads can overlap with each other but unique (―diagnostic‖) segments ad markers are disjunct. Also note that markers must fully overlap with the unique segments. ... 81 Figure 24: Logical scheme of identifying a query sequence as a marker using a nearest neighbor paradigm. ... 87 Figure 25: The outline of the GSMer procedure. A unique region of 100 nt is indicated shown in pink. Imagine
sliding a window of 50nt along the sequence. The first and last windows passing the < 85% threshold are indicated by black lines. ... 88 Figure 26: The outline of a sparse tiling procedure for marker identification. Note that the unique region (pink) can
overlap with a minimum of one, or a maximum of two tiling windows. ... 89 Figure 27: Two types of marker datasets, illustrated on a hypothetical species of 3 strains. Left: A set union type
definition, k-mers appearing in any of the 3 strains of the species. This is a non-redundant set, i.e. k-mers appearing in more than one strain appear only once. Right: A set-intersection type definition, k-mers appearing in all 3 strains of the species. Note that this is a much smaller set. ... 91 Figure 28: Workflow for unique segments identification ... 92 Figure 29: The figure shows the percent of bp assigned against the Taxoner score for the Burkholderia genus. After
the score of 0.30 the Taxoner returns the same result. ... 94 Figure 30: Percent of bp assigned per Taxoner score for the Complete Genomes using the nt file as Taxoner
database. ... 98 Figure 31: Distribution of the assigned bp against the Taxonomic ranks using different Taxoner scores... 99
ix
List of Tables
Table 1: Types of NGS technologies ... 4
Table 2: Goals of next generation sequencing ... 5
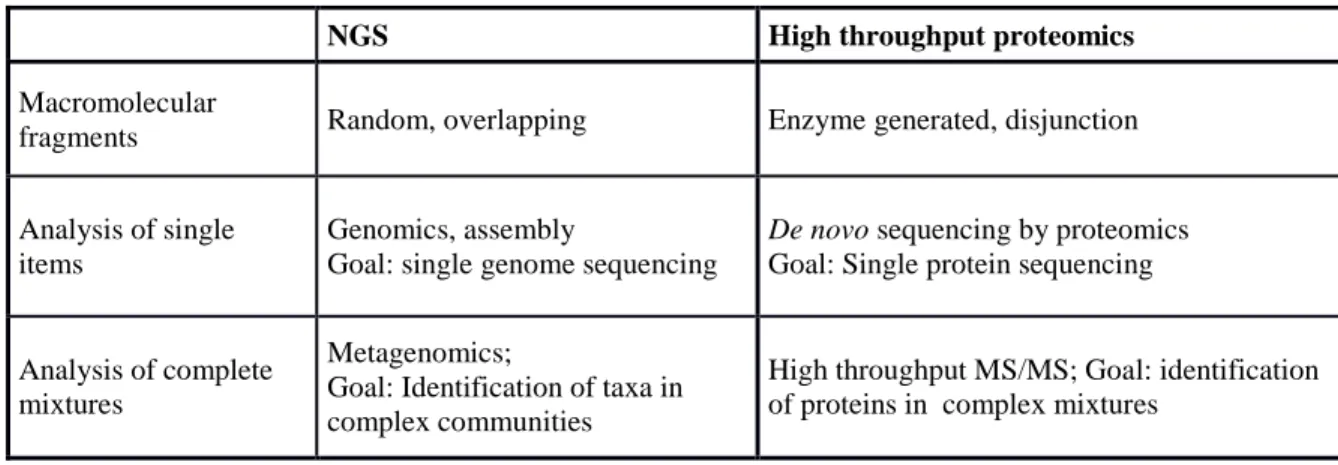
Table 3: The parallelism between NGS and high throughput proteomics ... 5
Table 4: Object oriented design for the C structures. ... 34
Table 5: Tools available in the BioC Project. ... 35
Table 6: List of Google Code Projects developed. ... 35
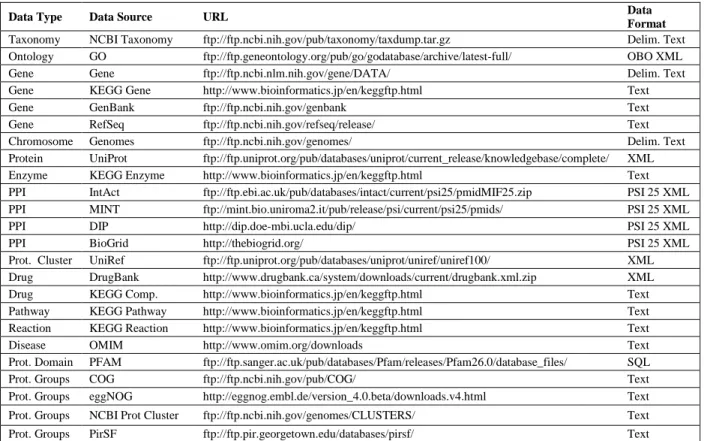
Table 7: Data sources included in JBioWH ... 40
Table 8: Loading times, final data sizes and number of elements inserted. This example was executed in a computer with two Intel Core CPU Q6850 (3.00 GHz and 4.0 MB of cache) and 8.0 GB of RAM running OpenSuSE 13.1 (Linux version 3.11.10-11-desktop. ... 41
Table 9: Two simple examples and their solutions using SQL language and the Java API code ... 60
Table 10: This table shows the use of the TaxonomyGraph class to create the hierarchical structure of a Taxonomy family. ... 62
Table 11: This table shows the genes encoding for drug‘s target protein that are in the same chromosome at a distance less than a specific number of pair bases. ... 63
Table 12: Current size of a few databases subsets and the number of artificial chromosomes necessary for the analysis. ... 69
Table 13: Typical running times for the alignments. ... 77
Table 14: Detection of species in a metagenomic datasets ... 78
Table 15: Analysis of known and unknown B. anthracis strains. ... 79
Table 16: Summary pros and cons for the marker database design, ... 84
Table 17: The table shows the percent of bp assigned to the taxonomic levels for the Burkholderia genus using a Taxoner score of 0.50. Note that the table continues in the next page. They should be seen in parallel. ... 96
Table 18: Complete genomes data downloaded from the NCBI FTP site 03/24/2014. ... 98
Table 19: Run times for the creation of the Marker database for different set of input data ... 100
x
xi
Acknowledgements
This work is the result of an exceptionally fruitful collaboration between institutions from Cuba, Italy and Hungary. The project started during my first visit to the ICGEB in 2008, when I was invited by Prof. Sándor Pongor. His support, kindness and, especially, his scientific vision has made possible all these results. Special thanks are due to my friends and close collaborators, Yasset Perez-Riverol (European Bioinformatics Institute), Sonal K. Choudhary and Sanjar Hudaiberdiev (ICGEB, Trieste), Lőrinc S. Pongor (Semmelweis University, Budapest) and Balázs Ligeti (Pázmány University, Budapest). Much of this work is the result of our common efforts so a large part of the credit goes to them.
I wish to express my gratitude to ICGEB-Trieste, Italy, to LNCIB, Trieste, Italy, and to Pázmány Péter Catholic University, Budapest, Hungary for the fellowships and the financial support. In particular, I wish to thank the help and assistance of Profs. Francisco E. Baralle (ICGEB) and Claudio Schneider (LNCIB)
I want to thank my labmates at ICGEB, Sonal and Sanjar for being family and for the many English corrections to my thesis and my presentations. I also want thank my colleagues at LNCIB, Vanessa Florit and Raffaella Florit for their trust and support.
My special hanks are due to all my friends in Trieste, especially to Piero, Roberta, Giacomo, Elena, Giorgia, Giampaolo, Simona, Sorrentino, Roberto and Daniela for their friendship and support.
And to my catholic community at the San Giusto Cathedral of Trieste: Grazie mille per la preghiera e per ricordarci che non dobbiamo avere paura: Dio ci ama e sempre provvede.
I would like to thank my wife and children for being there for me always and letting me work despite of their needs. And to my parents and my sister for their sacrifices which made me the man that I am: Gracias mis amores por todo. Este también es un logro de todos ustedes. Los amo infinitamente.
xii
xiii
Contents
ABSTRACT ... I LIST OF PUBLICATIONS ... III LIST OF ABBREVIATIONS ... V LIST OF FIGURES ... VII LIST OF TABLES ... IX ACKNOWLEDGEMENTS ... XI CONTENTS ... XIII
1 INTRODUCTION ... 1
1.1 NEXT-GENERATION SEQUENCING ... 3
1.1.1 Sequence alignment algorithms ... 6
1.1.2 Hash table based approaches ... 6
1.1.3 Improved seeding techniques ... 6
1.1.4 Improved seed extension ... 8
1.1.5 Fast aligners based on suffix/prefix try... 8
1.1.6 Sequence assembly ... 9
1.2 OMICS DISCIPLINES AND BIOLOGICAL DATABASES ... 11
1.2.1 Genomics ... 13
1.2.2 Transcriptomics ... 15
1.2.3 Metagenomics and Metatranscriptomics ... 16
1.2.4 Proteomics ... 21
1.2.5 Metabolomics/metabonomics ... 23
1.2.6 General databases ... 24
1.3 INTEGRATION OF BIOLOGICAL DATA ... 25
1.3.1 Heterogeneity and redundancy in biological data ... 27
1.3.2 The format of biological data ... 29
1.4 SCOPE ... 30
2 MATERIALS AND METHODS ... 31
2.1 DATABASE DESIGNS ... 31
2.2 PROGRAMMING LANGUAGES AND LIBRARIES ... 31
2.2.1 Java ... 31
2.2.2 C ... 32
2.2.3 Bash shell scripting ... 35
2.3 GOOGLE CODE PROJECTS ... 35
2.4 CLOUD PLATFORMS ... 36
3 RESULTS AND SUMMARY ... 37
xiv
3.1 BIOLOGICAL DATABASE INTEGRATION ... 37
3.1.1 General approach ... 37
3.1.2 Data sources ... 38
3.1.3 Relational schema ... 42
3.1.4 Java API ... 51
3.1.5 Web services ... 58
3.1.6 Examples ... 60
3.1.7 Applications ... 64
3.1.8 Summary ... 65
3.2 PREDICTION OF BACTERIAL TAXA AND GENE FUNCTION FROM NGS RESULTS ... 67
3.2.1 The Taxoner principle ... 67
3.2.2 The Taxoner algorithm ... 71
3.2.3 Desktop and server versions ... 75
3.2.4 Run times and examples ... 76
3.2.5 Analyzing metagenomic datasets ... 77
3.2.6 Analyzing known and unknown strains ... 78
3.2.7 Summary ... 80
3.3 THE GENOME SPECIFIC MARKER DATABASE ... 81
3.3.1 The marker database approach ... 85
3.3.2 Production of markers for higher level taxa or other sequence groups... 90
3.3.3 Overview of the database production workflow... 91
3.3.4 Sequence comparison for the Burkholderia genus... 93
3.3.5 Marker database for the Complete Genomes ... 98
3.3.6 Run times and space complexity ... 100
3.3.7 Summary ... 100
4 CONCLUSION ... 102
5 REFERENCES ... 106
1
1 Introduction
The introduction of information technology to manage the biological data has been changing the biological research. Also, a technological revolution on labs, like low-cost genomic DNA sequencing technologies and biological assays made by robots, have been contributing to this new era of the biological sciences.
The field of Bioinformatics is a product of this new era. The National Center for Biotechnology Information (NCBI) defines bioinformatics in 2001 as:
―Bioinformatics is the field of science in which biology, computer science, and information technology merges into a single discipline. There are three important sub-disciplines within bioinformatics: the development of new algorithms and statistics with which to assess relationships among members of large data sets; the analysis and interpretation of various types of data including nucleotide and amino acid sequences, protein domains, and protein structures; and the development and implementation of tools that enable efficient access and management of different types of information.‖
This discipline have been used for decades as a basic support for biological research projects, its use provides a better understanding of complex biological process.
Additionally, the Systems Biology, known as the next big intellectual challenge in biology, has been integrating the Bioinformatics tools in its research projects producing high quality results. This synergy is not a method but a paradigm, a general approach of thinking [2].
They form an inter-discipline that makes use of principles, knowledge and tools coming from biology, computer sciences, medicine, physics, chemistry and engineering, bridging the gaps between them [3].
This paradigm is helping to develop new research archetypes that shifts focus from traditional studies of single gene or protein to unified systems view on biological processes.
It combines data-mining from large-scale, technology-driven projects, such as human
2
genome or structural genomics projects, with traditional hypothesis-driven experimental work.
The aforementioned way of thinking tend to improve the understanding of the biology and its mechanisms, particularly, the interactions between its key elements (DNA, RNA, proteins, chemical compounds, cells, etc.). The bottom up approach builds on its key elements, which are strictly related to the OMICS data sets, and the proposed models of biological systems.
This integration through novel methodologies is not limited to the description of the existing knowledge using a new syntax. It combines old and new models to develop new approaches for the characterization of the biological systems.
Based on an integrationist approach, this paradigm fills the empty spaces left by the reductionist approaches where the complex system is nothing more than the sum of its parts. These reductionist approaches have played an important role in the development of the biology sciences until now. They allowed the identification of the majority of the biological elements independently. Unfortunately, they offer no convincing concepts and methods to comprehend how system properties emerge [4].
The technical challenges of the Systems Biology [5] are mainly along four lines: (i) system- wide component identification and quantification (―OMICS‖ data sets); (ii) experimental identification of physical component interactions, primarily for information processing networks; (iii) computational inference of structure, type, and quantity of component interactions from data; and (iv) rigorous integration of heterogeneous data [41]. Being this last step significantly behind, such that many more data are generated than possibly can be analyzed or interpreted [6].
3
1.1 Next-generation sequencing
Knowing the DNA sequence is essential for all kind of projects in biological research.
Scientists extracting the genetic information from the biological systems produced a limitless insight to the ―OMICS‖ disciplines, especially to the Genomics and Transcriptomics. The DNA sequencing techniques have been evolving continuously, and consequently, they have been incorporating new challenges to the Bioinformatics.
On the other hand, major developments of bioinformatics usually result from parallel development in data processing. ―Traditional bioinformatics‖ provides data processing and storage technologies that served protein and DNA sequencing technologies developed from the 70‘s and 80‘s. However, next generation sequencing (NGS), that is an umbrella name for DNA sequencing technologies that followed after 2000, is a complete new approach that cannot be afforded using the traditional bioinformatics tools. The goal of this chapter is to give an overview of the data processing of NGS, I briefly review this field based on Homer and Li [7].
These new sequencing technologies often aims at sequencing very long DNA pieces, such as whole chromosomes, although, large-scale sequencing can also be used to generate very large numbers of short sequences. Also, they are designed for low-cost sequencing producing high-throughput DNA sequences data of the order of giga base-pairs (Gbp) per machine day [8].
There are two groups of DNA sequencing technologies that fall into the NGS umbrella. The first group (second generation) follows chemical synthesis techniques, similar in part to conventional Sanger sequencing, another group (third generation) uses single molecular techniques that, on one hand, do not require amplification, but on the other hand, report single molecule variants, see Table 1.
From the perspective of bioinformatics, the length and the accuracy of the reads is the most important (two right columns), as this will determine the probability of chance identities, i.e. the background noise of sequence alignment.
4
NGS applications fall into a few characteristic categories, listed in Table 2. It is interesting to realize the parallelism between the data processing perspectives of high throughput proteomics and NGS. Nevertheless, the two fields were developed in vastly different ways, see Table 3.
Table 1: Types of NGS technologies
―Generation‖ Type of sequencing Instrument Max read
length
Accuracy
Second generation sequencers
sequencing-by- synthesis
Roche/454 700 99.9%
Illumina 150 98%
sequencing-by-ligation ABI/ SOLiD 75-100 99.9%
sequencing-by- synthesis
Ion Torrent/Life Technologies
200 98%
Third generation sequencers (single molecule sequencing)
single-molecule
sequencing Helicos 50 99.5%
single-molecule
sequencing Pacific Biosciences 1500 87-99
nanospore single-
molecule sequencing Oxford Nanospore n/a n/a
The Bioinformatics approaches used by the NGS applications to process the data can be described by two main groups. The first group includes the approaches to manipulate, store and share the experimental results, namely reads or segments of DNA sequences, including the experimental description. The second group includes computational applications to process the experimental results. These computational tools can be generally classified in tools to align the DNA reads and tools to assemble the final DNA sequence.
5
Table 2: Goals of next generation sequencing
Category Application example
De novo sequencing of complete
genomes Description of new species, identification of unique genes.
Complete genome resequencing Identification of mutations and polymorphisms; structural variants Paired-end sequencings Inherited and acquired structural variations (e.g. CNV)
Metagenomic sequencing Study of microbial communities, detection of pathogens Transcriptome sequencing Quantifying/comparing gene expression
MicroRNA sequencing Gene regulation studies
Exome sequencing Concomitant study of all exons in all genes
Molecular barcode sequencing Parallel identification of several species
Table 3: The parallelism between NGS and high throughput proteomics
NGS High throughput proteomics
Macromolecular
fragments Random, overlapping Enzyme generated, disjunction
Analysis of single items
Genomics, assembly
Goal: single genome sequencing
De novo sequencing by proteomics Goal: Single protein sequencing
Analysis of complete mixtures
Metagenomics;
Goal: Identification of taxa in complex communities
High throughput MS/MS; Goal: identification of proteins in complex mixtures
6
1.1.1 Sequence alignment algorithms
The crucial part of NGS data processing is the alignment of the DNA reads. Most current alignment algorithms index structures either for the read sequences or for the reference database sequence, or sometimes both. Based on the index properties, alignment algorithms can be largely grouped into two large categories: a) algorithms based on hash tables, b) algorithms based on suffix trees and algorithms based on merge sorting. (An additional group consists of Slider [9] and its descendant SliderII [10], we concentrate on the first two categories).
1.1.2 Hash table based approaches
All hash table based algorithms essentially follow the idea of BLAST of Steve Altschul and associates [11, 12] which can be called a seed-and-extend paradigm. The philosophy was based on protein sequencing, but the main corollaries keep also for DNA sequencing. The fundamental supposition is that homologous sequences contain conserved segments that can be located by the position of k-mer words shared by two sequences. BLAST keeps the position of each k-mer (k = 11 by default) subsequence of the query in a hash table with the k-mer sequence being the key, and scans the database sequences for k-mer exact matches, by looking up the hash table. A sufficient (user selected) number of k-mers is called a seed.
BLAST extends and joins the seeds first without gaps and then refines them by a Smith- Waterman alignment [13, 14]. It outputs statistically significant local alignments as the final results. This basic approach has been improved and adapted to alignments of different types, but here we focus on mapping a set of short query sequences against a long reference genome of the same species.
1.1.3 Improved seeding techniques
Ma and associates realized that seeds of k non-consecutive identities are more sensitive than seeds of k consecutive identities, used in the original BLAST algorithm [15, 16]. A seed allowing internal mismatches is called a spaced seed; the number of matches in the
7
seed is its weight. The time complexity of spaced seed alignment is approximately proportional to mnL/4q where q is the weight, m the number of templates, n the number of reads and L the genome size. The memory required by hashing genome is usually log2 L max(4q, L/s) bytes where s is the sampling frequency [17]. It is memory demanding to hold in RAM a hash table with q larger than 15. Homer and associates proposed a two-level indexing scheme for any large q [18]. They build a hash table for j-long (j < q, typically 14) bases. To find a q-long key, they look up the hash table from the first j bases and then perform a binary search among elements stored in the resulting bucket. Looking up a q- long (q > log4 L) key takes O(max(1, log4 L – j)) time, only slightly worse than the optimal speed O(1). And, as a consequence, the peak memory becomes independent of q.
The idea can be implemented in several ways, sometimes linked to the peculiarities of individual sequencing technologies; we only cite a few here. The program Eland builds k- mer templates for the reads. For an Illumina read it builds 6 templates and allows for two mismatches during the alignment. SOAP [19] adopts almost the same strategy except that it indexes the genome rather than reads. SeqMap [20] and MAQ [21] allow k mismatches, this requires an exponentially high number of templates for the same sensitivity which is inefficient for larger k values. To improve the speed, MAQ only takes advantage of the fact that the first half of the reads is more reliable so it accepts only 2 mismatches in the first 28bp i.e. the most reliable part of an Illumina read. MAQ will extend the partial match when a seed match is found. There are several other programs that capitalize on the same or similar ideas, for a further review see [7].
A potential problem with consecutive seed and spaced seed is they disallow gaps within the seed. Gaps are usually found afterwards in the extension step by dynamic programming, or by attempting small gaps at each read positions [19, 20]. The q-gram filter [22-24] is based on the observation that at the occurrence of a w-long query string with at most k differences (mismatches and gaps), the query and the w-long database substring share at least (w+1)−(k+1)q common substrings of length q [25-27]. Methods based on spaced seeds and the q-gram filters are similar in that they both rely on fast lookup in a hash table. They are mainly different in that the former category initiates seed extension from one long seed
8
match, while the latter initiates extension usually with multiple relatively short seed matches. In fact, the idea of requiring multiple seed matches is more frequently seen in capillary read aligners such as SSAHA2 and BLAT; it is a major technique to accelerate long-read alignment.
1.1.4 Improved seed extension
Due to the use of long spaced seeds, many aligners do not need to perform seed extension or only extend a seed match without gaps, which is much faster than dynamic programming. Nonetheless, several improvements over BLAST have been made regarding seed extension. A major improvement comes from accelerating the standard Smith- Waterman with vectorization. The basic idea is to parallelize alignment with the CPU SIMD instructions such that multiple parts of a query sequence can be processed in one CPU cycle. Using the SSE2 CPU instructions implemented in most latest x86 CPUs, [28]results in a revised Smith-Waterman algorithm that is over 10 times faster than the standard algorithm. Novoalign (http://novocraft.com), CLC Genomics Workbench (http://clcbio.com) and SHRiMP are known to make use of vectorization.
Another improvement is achieved by constraining dynamic programming around seeds already found in the seeding step [18, 29, 30]. Thus, unnecessary visits to cells far away from seed hits in iteration are greatly reduced. In addition, [31] found that a query can be aligned in full length to an L-long target sequence with up to k mismatches and gaps in O(kL) time, independent of the length of the query. These techniques also help to accelerate the alignment when dynamic programming is the bottleneck.
1.1.5 Fast aligners based on suffix/prefix try
The use of hash tables is getting impractical for larger input data sizes. As a consequence, current aligners seek to the inexact matching problem to the exact matching problem and involve two steps: 1) identifying exact matches and 2) building inexact alignments supported by exact matches. To find exact matches, these algorithms rely on a certain data
9
representations, such as suffix tree, enhanced suffix array [32] and FM-index [33]. The advantage of using a try as the basic data structure is that alignment to multiple identical copies of a substring in the reference is only needed to be done once because these identical copies collapse on a single path in the try, whereas with a typical hash table index, an alignment must be performed for each copy. It should be noted that the choice of these data structures is independent of methods of step 2 for finding inexact matches i.e. an algorithm built upon FM-index, for example, would also work with suffix tree index in principle.
Algorithms in this class make use of key methods, such as the Burrows-Wheeler transform (BWT) [34], the Ferragina-Manzini index (FM) [33] and the Huffman coding (HC) [35].
Briefly, BWT is a lossless compression algorithm used among others in bzip2, it allows one to compress and decompress data without loss of information. The compression of biological data, such as a genome becomes practical if one combines BWT with HC or other coding technique. A BWT encoded dataset is not suitable for searching in itself, but Ferragina and Manzini discovered in 2005 that a new index, now called the FM index, which can search a BWT dataset without decompression. With this combination we have a new index structure that can replace the hash table with a concomitant gain in speed.
Further, speedup is possible by avoiding dynamic programming, even though some of the current programs allow dynamic programming as a more sensitive option.
There are two current programs that are widely used today in the bioinformatics community. BWA [36] is the program of the Durbin group that was the first in time, it is relatively sensitive but somewhat less fast than Bowtie [37] and Bowtie2, developed at the Salzberg group which is considered somewhat faster but less sensitive.
1.1.6 Sequence assembly
The assembly process is out of the scope of this thesis, however, we would like to introduce briefly some concepts and algorithms used to assemble DNA segments up to chromosome length.
10
An assembly is a hierarchical data structure that maps the sequence data to a putative reconstruction of the target. It groups reads into contigs and contigs into scaffolds. Contigs provide a multiple sequence alignment of reads plus the consensus sequence. The scaffolds, sometimes called supercontigs or metacontigs, define the contig order and orientation and the sizes of the gaps between contigs. Scaffold topology may be a simple path or a network [38].
Sequence assembly is the reconstruction of sequence up to chromosome length. The assembly task is relegated to computer software [39]. Assembly is possible when the target is over-sampled by the shotgun reads, such that reads overlap. De novo Whole-genome shotgun (WGS) assembly refers to reconstruction in its pure form, without consultation to previously resolved sequence including from genomes, transcripts, and proteins [38]. DNA sequencing technologies share the fundamental limitation that read lengths are much shorter than even the smallest genomes. WGS overcomes this limitation by over-sampling the target genome with short reads from random positions. Assembly software reconstructs the target sequence.
The NGS assemblers can be group into three categories, all based on graphs. The Overlap/Layout/Consensus (OLC) methods rely on an overlap graph. The de Bruijn Graph (DBG) methods use some form of K-mer graph. The greedy graph algorithms may use OLC or DBG.
The OLC approach was typical of the Sanger-data assemblers. It was optimized for large genomes in software including Celera Assembler [40], Arachne [41, 42], and CAP and PCAP [43]. The OLC approach has been reviewed elsewhere [44]. The most representatives assembler programs using this approach are Newbler [45], the Celera Assembler [40] and Edena [46]
The DBG approach is most widely applied to the short reads from the Solexa and SOLiD platforms. It relies on K-mer graphs, whose attributes make it attractive for vast quantities of short reads, see [47] for review. The most representatives assembler programs using this
11
approach are Euler developed for Sanger reads [48-50], Velvet [51, 52], ABySS [53], AllPaths [54] and SOAPdenovo [55].
1.2 OMICS disciplines and biological databases
The OMICS suffix has been added to the names of many kinds of biological studies undertaken on a large or genome-wide scale. Today, there are numerous derivatives of the basic concept of large-scale biological analysis, with the common denominator of aiming to study the complete repertoire of particular biological entities [56]. It includes several disciplines that are growing within this new biological era. They are mainly represented by Genomics, Transcriptomics, Metagenomics and Metatranscriptomics, Proteomics, Metabolomics/metabonomics, Localizomics, etc.
The advent of whole-genome sequencing and other high-throughput experimental technologies transform the biological research from a relatively data poor discipline into one that is data rich [5]. This exponential increment of the data produced by the OMICS disciplines is associated to the number of available biological databases. A synergy between the OMICS and the Bioinformatics tools is used to produce, store, process and validate the biological data. They use high-throughput screening experiments for identification and validation of biological entities; computational tool and databases to manage the data generated in the previous stage; and algorithms for computational predictions of biological properties and interactions [57-59].
One of the biggest problems of this synergy is that the high-throughput experimental technologies used for querying the biological system have an inherent high rate of false positive results and they are able to produce an unmanageable volume of data [60, 61].
Although, each experiment result obtained is not useful by itself. They have a limited utility unless efficient computational systems are used to manage, integrate and process them.
Indeed, a biological database as any kind of database is a collection of data that is organized so that its contents can easily be accessed, managed, and updated [59, 62]. A
12
simple database might be a single file containing many records, each of which includes the same set of information.
The Nucleic Acids Research (NAR) journal online Molecular Biology Database Collection [63] published a collection of 1552 databases that are sorted into 14 categories and 41 subcategories. This updated collection includes only active databases at the beginning of 2014, see Figure 1.
Figure 1: Biological database growth during the last decade
These set of categories and subcategories are not the only way to classify the biological databases. Some authors grouped them in three general groups for better understanding [4].
The first group includes the primary databases. These databases contain information of the sequence or structure alone. It includes nucleotide, RNA, protein sequences and structures databases. A second group includes databases which are generated by a computational processing of the primary databases and they are named secondary databases. This group includes databases of genes, genomes, protein domains and families, etc. Finally, the last group, named composite databases or metabases [64], includes databases generated from
13
the integration of the primary and secondary databases. This group has been growing according with the level of acceptance of the Systems Biology and its use to solve problems in research projects. Also, it is closely related to one of the most important problems faced today which is the integration of biological data.
We accept and respect these classifications; however, we will present and discuss the biological databases in more detail through the organization of the OMICS disciplines. This structure follows the Systems Biology point of view and offers a better overview of all its elements and their integration. Despite of that, the databases will be located in one of these three groups once they are presented and analyzed. Furthermore, there are 1552 active databases, so only the most important and useful databases will be presented and discussed here.
1.2.1 Genomics
This OMICS discipline is defined as the study of the whole genome sequence and the information contained therein, is clearly the most mature of all OMICS [5]. Since 1995, when the first bacterial genome was sequenced [65], a huge explosion on genomic data has occurred. More than thousand organisms have been sequenced producing more than 169 million of sequences available according to the NCBI statistics [66].
In the last years, this discipline has received a fresh support with the arrival of new technologies for sequencing at low costs. These high-throughput sequencing (or next- generation sequencing) technologies are able to produce thousands or millions of sequences concurrently [67].
Additionally, the genomics databases represent the most widely used databases and they are the best established. With terabytes of data, these databases cover the three main groups aforementioned.
The primary databases related to Genomics are: GenBank [68], DDBJ [69] and ENA [70].
These databases provide public repositories for the nucleotide sequences data. They daily
14
exchange data between them to ensure worldwide coverage. These databases contain sequences for almost 260 000 formally described species [68]. They offer to the user web portals and desktop tools to submit and update entries creating a direct channel between the database administrators and the data suppliers.
The secondary databases are mainly represented by Entrez Gene [71], Entrez Genome [72], KEGG Genes and KEGG Genome [73], GOLD [74] and Ensembl [75].
The Entrez Gene database is a gene-specific database which establishes a gene-to-sequence relationship used by other NCBI resources. It provides tracked, unique identifiers for genes and to report information associated with those identifiers for unrestricted public use [71].
The Entrez Genome database provides access to more than six thousand complete genomes.
The database offers a graphical overview of an entire genome to the level of a single gene.
At the level of a genome or a chromosome, a Coding Regions display gives the locations coding regions, and the lengths, names and GenBank identification numbers of the protein products [72].
The KEGG is an integrated database of 15 main databases. KEGG Genes and KEGG Genome are the KEGG resources related to the Genomics discipline. KEGG Genes is a collection of gene catalogs for all complete genomes generated from publicly available resources. The KEGG Genome is a collection of organisms with known complete genome sequences. Similar to NCBI databases, the KEGG database offers multiple tools for submitting the data to their resources. It also provides an avowed group of biocurators involved in the analysis, interpretation and integration of the biological information into the data repositories.
The GOLD database provides an online centralized portal for genomic and metagenomic projects. It includes the implementation of GOLD-specific controlled vocabularies for representation of the associated data, in coordination with the Genomics Standards Consortium (GSC) [74, 76].
15
Finally, the Ensembl project creates and distributes genome annotations and provides integrated views of other valuable genomic data for supported genomes. Ensembl provides unique tools, datasets and user support compared to similar projects such as the UCSC Genome Browser. It offers an open software infrastructure with diverse analysis pipelines supporting a variety of genome analysis methods [75].
1.2.2 Transcriptomics
Transcriptomics is defined as the study of Transcriptome and its interactions.
Transcriptome is set of all RNA molecules including the messenger RNA (mRNA), ribosomal RNA (rRNA) and transfer RNA (tRNA). All this important molecules perform multiple vital roles in coding, decoding, regulation, and expression of genes.
There are several databases related with this OMICS discipline. Both the primary and the secondary databases are included in this particular discipline.
The most important primary databases in this discipline are Ribosomal Database Project (RDP) [77] and miRBase database [78]. These databases provide a computational framework for management of Transcriptomics primary data.
The RDP database has expanded its resources to handle high-throughput data. Also, it provides a set of Open Source tools for custom analysis. Whereas, the miRBase has focused on micro RNA, which play an important role in cellular physiology, development and disease using a negatively regulating gene expression approach [79].
The secondary databases are led by the HMDD [80], DIANA-LncBase [81] and NCIR [82].
The HMDD database is a collection of experimentally supported human microRNA (miRNA) and disease associations. It provides a web interface for users to browse, search and download data sets. Also, user friendly tools are available for submission.
The DIANA-LncBase database provides experimentally verified and computationally predicted microRNA targets on long non-coding RNAs. The miRNA-lncRNA interactions supported by experimental data for both human and mouse species are also available.
16
The NCIR database provides a rapid access to all RNA structures with emphasis in those with base-base interactions reported. Moreover, the database offers a collection of important properties associated to RNA molecules and to their interactions [82].
1.2.3 Metagenomics and Metatranscriptomics
Metagenomics and Metatranscriptomics describe the functional and sequence-based analysis of the collective genomes contained in a sample [83], see Figure 2. They provide a unique opportunity to explore earth‘s limitless environments harboring scores of yet unknown and mostly unculturable microbes and other organisms [84]. Whereas WGS targets one genome, metagenomics usually targets several. They refer to culture- independent studies of the collective set of genomes of mixed microbial communities and apply to explorations of all microbial genomes in consortia that reside in environmental niches, in plants, or in animal hosts [85].
Metagenomics is a powerful approach for exploring the ecology of complex microbial communities. Its power will be realized when it is integrated with classical ecological approaches and efforts to culture previously unculturable microorganisms, which will likely be facilitated by clues about the physiology of the uncultured microorganisms derived from metagenomic analysis. Microscopy and stable isotope analysis are two approaches that will be particularly informative when linked to metagenomics [86].
Metagenomics and associated meta-strategies have arrived at the forefront of biology primarily because of 2 major developments, the deployment of next-generation sequencing technologies and the emerging appreciation for the importance of complex microbial communities in mammalian biology and in human health and disease.
However, each stage of the analysis suffers heavily due to inherent problems of the metagenomic data generated, including incomplete coverage, massive volumes of raw sequence data produced by the next-generation sequencers, generally short read-lengths, species abundance and diversity and so on [87, 88].
17
The metagenomics assembly problem is confounded by genomic diversity and variable abundance within populations. Assembly reconstructs the most abundant sequences [89].
Simulations indicate high rates of chimera, especially in short contigs assembled from complex mixtures [90]. Studies that rely on characterization of individual reads prefer long reads [91]. The role for de novo genomic assembly from NGS metagenomics data should grow as NGS read lengths and NGS paired-end options increase.
Figure 2: Flow chart for the analysis of a metagenome from sequencing to functional annotation. Only the basic flow of data is shown up to the gene prediction step. For the context-based annotation approach, only the gene neighborhood method has been implemented thus far on metagenomic data sets; although in principal, other approaches which have been used for whole genome analysis can also be implemented and tested [84].
18
1.2.3.1 Taxonomy identification in Metagenomics
One direct application of metagenomics using NGS technologies is the taxonomy identification in unknown samples [92]. This is crucial in various fields, such as detection of human or animal pathogens [93], detection of bacterial contamination in food samples [94] etc. Additionally, the majority of these organisms in environmental samples belong to hitherto unknown taxonomic groups, the challenges is not only just to catalog the known organisms, but also to identify and characterize new organisms belonging to known or unknown taxonomic groups. These organisms could belong to an entirely new species or genus or family or order or class or even a new phylum [95].
This process is known as ―Taxonomic binning‖ and corresponds to the process of assigning a taxonomic identifier to sequence fragments, based on information such as sequence similarity, sequence composition or read coverage [96].
Next generation sequencing is increasingly becoming the method of choice in many areas because of the richness of data it can provide. Moreover, metagenomics produces massive volumes of raw sequence data were NGS technologies are used, so, the processing of NGS data is problematic in many respects. Namely, current sequence alignment problems were developed with genome sequencing in mind; they are optimized for handling a single reference genome (the human genome) on which they work very efficiently.
Current computational approaches for taxonomic binning fall into two broad categories.
The first group, marker-based methods seek to bypass the bottleneck via search space reduction, using dedicated, small datasets. A typical example is 16S RNA analysis wherein, a dataset of short sequence items is searched with sensitive alignment techniques, such as BLAST [12]. While this is the traditional standard for taxonomic identification, it has well known limitations, including the need for PCR amplification that introduces extra overhead as well as experimental bias. Alternatively, word-based techniques combined with artificial intelligence can be used to construct a database of clade-specific recognizers that make it possible to use rapid string matching techniques for species identification [97].
19
The MetaPhlAn [98] program uses a small clade-specific sequence marker database using the genome sequences of the known taxa that can be searched with general purpose aligners. This search is extremely fast and accurate for determining taxa and their approximate proportions within large microbial communities. A potential common drawback of marker-based approaches is the frequent lack of lower (e.g. strain-level) taxon identification, as the markers are often identical to many strains. This may cause problems in identifying pathogenic strains of common commonly occurring bacteria such as E. coli.
A recently developed program uses a radically different approach, that of compressing sensing [99]. This methodology goes back to a ―mixing problem‖ used in various fields of signal processing and analytical chemistry. Briefly, if pure signals (pure chemical materials) can be described in terms of a vector, than the mixed signal can be described as a linear combination of these vectors, where the coefficients of each vector are proportional to the % of each signal/chemical material in the mixture. For n vectors of m components, we have (n-1) percentage values (coefficients). This problem defines a set of n linear equations, each of them containing m members (vector components).
In the technical life, there are many, sometimes over a hundred years old methods for such problems, least squares fitting is perhaps the best known. The problem requires that the number of measured vector components should be greater than the number of coefficients,.
Compressed sensing [100] simply relies to the relatively recent discovery that such equation systems can be solved for problems where the number of number of measured components are low, but the number of equations is also below a certain limit. Metagenome identification is such a problem: From all the possible species, only a few or a few hundred are present.
As vector description, WGSQUIKR uses 7-mer word composition vectors (16 000 components), calculated for entire genomes. The reads of a metagenomics experiments are directly translated into a 7 mer vector, which can be considered as a mixture of pure genomic vectors and the system of equations solved via the methods of compressed sensing.
20
In the second group of metagenome sequencing approaches, whole genome shotgun sequencing reads are directly aligned against a comprehensive sequence database. In this group of approaches database search is a critical step since aligning a large set of reads against a comprehensive database using high quality aligners such as BLAST is either too time consuming, or requires computational resources that that are not readily available for all research groups. A good alternative to BLAST style alignment are the dedicated aligners developed for next generation sequencing such as bowtie2 [101], BWA [102], mrFAST [103] (for a review sew see [7]). These aligners are extremely fast but often require an excessive amount of memory for storing the indexed database, especially when comprehensive sequence databases are used.
A crucial step in all approaches is taxon assignment [96] which is often carried out via various flavors of lowest common ancestor search within a taxonomic hierarchy. Briefly, alignment programs assign reads either to one taxon (say, an E. coli strain), or to several taxa (say 100% identity with an E. coli strain and an E. fergusoni strain), and in the latter case the lowest common taxonomic ancestor (the genus Escherichia) is reported. This principle is used in such popular programs as MEGAN [97, 104], Mothur [105] and SOrt- ITEMS [106].
The variety of computational approaches indicates that there is a need for further computational improvements. The need for dedicated tools is a crucial problem, since most of the current software tools are developed for general research purposes. In research settings, the qualitative and quantitative answers are not always clearly separated. For instance, the presence of E. coli reads in an output may be a safe indication for E. coli being present, but the number of the identified reads is not necessarily a quantitative measure of the abundance of the species. Currently, MetaPhlAn is considered a reliable quantitative indicator for species abundance in metagenome analysis [98]. Diagnostic settings pose a separate problem: here one has to precisely detect whether or not a pathogen is present above a certain threshold level, but the knowledge of the exact quantity is not necessarily important.
21
1.2.4 Proteomics
Proteomics is the discipline to study the large-scale set of proteins, particularly their structures and functions. It is based on the study of the Proteome which describe the cellular stage or the external conditions of the cell. The Proteome analysis is an essential tool in the understanding of regulated biological systems [107]. It can be used to compare cellular stages in order to determine the molecular mechanism that are involves in a specific cellular process. Additionally, there is a great interest in the Proteomics due to the fact that the majority of the pharmacological targets are proteins [108].
In current science, proteomics is almost exclusively used for a well defined field where mass spectrometry is used for the analysis of complex protein or peptide mixtures. Namely, mass spectrometry coupled with high performance liquid chromatography has become the de facto experimental standard for the proteomic analysis of complex biological materials such as tissue samples, biofluids, immunoprecipitates etc [109]. Each sample produces many thousand spectra, so the interpretation of LC-MS/MS relies entirely on computational tools [110]. The field of mass spectrometry is very complex, so, an overview of the topics closely related to bioinformatics analysis used in routine analysis of biological samples will be outlined.
Proteomics databases are widely spread on internet and include the most heterogeneous biological data. Moreover, they have more tools associated covering a huge range of applications than any other biological database.
The most important databases for this discipline are UniProt [111], RefSeq [112], RCSB PDB [113] and the protein DB from the Ensembl project, already described [75]. The first two databases are primary databases and include the protein sequences and its primary descriptions. The last one is a metabase that integrates several kinds of biological data and computational tools.
The UniProt database provides freely accessible resource of protein sequences and functional annotations. This database has two sections: a reviewed section containing manually annotated records with information extracted from literature and curator-
22
evaluated computational analysis (UniProtKB/Swiss-Prot), and an unreviewed section with automatically annotated records (UniProtKB/TrEMBL) [68]. The proportion of reviewed entries varies between proteomes, and is obviously greater for the proteomes of intensively curated model organisms.
The RefSeq database integrates an organism‘s genomic, transcript and protein sequence with descriptive feature annotation and bibliographic information. It is build from sequence data available in public archival sequence databases of the International Nucleotide Sequence Database Collaboration. Unique features of the RefSeq collection include its broad taxonomic scope, reduced redundancy, informative cross-links between nucleic acid and protein records [112].
The Research Collaboratory for Structural Bioinformatics Protein Data Bank (RCSB PDB) provides a structural view of biology for research and education. The online PDB archive is a repository for the coordinates and related information for more than 84 000 entries, including proteins, nucleic acids and large macromolecular complexes that have been determined using X-ray crystallography, NMR and electron microscopy techniques [113, 114]. This database includes cross-references with UniProt databases for a close relationship between the protein sequence and the structure.
The next group of databases is secondary databases which provide proteins properties, domains, families and motifs.
The first group of databases to be mentioned is the protein clusters. These databases provide data sets of proteins clustered or grouped by sequence similarity or any other feature. The most representative database of this group is UniRef [115]. It provides clustered sets of sequences from the UniProt database sequences. Currently covering 44 million source sequences, the UniRef100 combines identical sequences and subfragments from any source organism into a single UniRef entry. UniRef90 and UniRef50 are built by clustering UniRef100 sequences at the 90 or 50% sequence identity levels.
23
Alike, the protein families databases are led by the Pfam database [116]. This database includes a curated set of protein families, each of which is defined by two alignments and a profile hidden Markov. It contains 14 831 manually curated entries.
The next group of databases is protein orthologs. Orthology refers to a homologous relationship resulting from a speciation event, as opposed to paralogy, which is the result of a gene duplication event [117]. The first database in this group is the COG [118]. This database includes one-to-many and many-to-many orthologous relationships in form of clusters. Each COG consists of individual orthologous genes or orthologous groups of paralogs from three or more phylogenetic lineages. The COG database lacks phylogenetic resolution and is not regularly updated due to the manual labor required. However, its groups are still used by other databases to classify proteins. As an extension of COG, the eggNOG database was created [119]. It can be updated without the requirement for manual curation, covers more genes and genomes than COG, contains a hierarchy of orthologous groups to balance phylogenetic coverage and resolution and provides automatic function annotation of similar quality to that obtained through manual inspection [120].
1.2.5 Metabolomics/metabonomics
These two OMICS disciplines are one of the essential parts of the Systems Biology approach. They are used for the study of metabolism which makes life possible and is one of the most complex processes in nature [121].
The discipline of metabolomics seeks to identify the complete set of metabolites, or the Metabolome, of the cell. The related metabonomics field specifically studies the dynamic metabolic response of living systems to environmental stimuli or genetic perturbation [122]. The Metabolome represents the output that results from the cellular integration of the Transcriptome, Proteome and Interactome [5]. The Interactome is the whole set of molecular interaction. It includes the protein-DNA, protein-protein and protein-metabolites interactions dictating many cellular processes [123].
![, ].Virusesin , ],andthemycoviralinfectionsaremostlycryptic,astheirpresenceisusuallysymptomlessintheirhosts[ ].Avastmajorityofthedescribedmycoviruseshavelineardouble-strandedRNA(dsRNA)genomes[ (NationalCenterforBiotechnologyInformation)database,westillhav](data:image/gif;base64,R0lGODlhAQABAIAAAP///wAAACH5BAEAAAAALAAAAAABAAEAAAICRAEAOw==)