Identifying Tree Traits for Cooling Urban Heat Islands—A Cross-City Empirical Analysis
Carola Helletsgruber1,*, Sten Gillner2,Ágnes Gulyás3, Robert R. Junker4,5, Eszter Tanács6and Angela Hof1
1 Department of Geography and Geology, University of Salzburg, 5020 Salzburg, Austria; angela.hof@sbg.ac.at
2 Institute of Forest Botany and Forest Zoology, TU Dresden, 01069 Dresden, Germany;
gillner@forst.tu-dresden.de
3 Department of Climatology and Landscape Ecology, University of Szeged, 6722 Szeged, Hungary;
agulyas@geo.u-szeged.hu
4 Evolutionary Ecology of Plants, Department of Biology, Philipps-University Marburg, 35043 Marburg, Germany; robert.junker@uni-marburg.de
5 Department of Biosciences, University of Salzburg, 5020 Salzburg, Austria
6 Institute of Ecology and Botany, Centre for Ecological Research, 2163 Vácrátót, Hungary;
tanacs.eszter@okologia.mta.hu
* Correspondence: carola.helletsgruber@sbg.ac.at; Tel.:+43-662-8044-5234
Received: 3 September 2020; Accepted: 30 September 2020; Published: 30 September 2020
Abstract: Research Highlights: This paper presents a cross-city empirical study on micro-climatic thermal benefits of urban trees, using machine-learning analysis to identify the importance of several in situ measured tree physiognomy traits for cooling.Background and Objectives: Green infrastructure and trees in particular play a key role in mitigating the urban heat island (UHI) effect. A more detailed understanding of the cooling potential of urban trees and specific tree traits is necessary to support tree management decisions for cooling our progressively hot cities. The goal of this study was to identify the influence and importance of various tree traits and site conditions.Materials and Methods: Surface temperature, air temperature at 1.1 m and at tree crown height, as well as wet bulb globe-temperature of shaded and fully sun-exposed reference areas, were used to study the cooling effect of seven different urban tree species. For all 100 individuals, tree height, crown base, trunk circumference, crown volume, crown area, leaf area index (LAI) and leaf area density (LAD) were measured. Measurements were conducted in the cities of Dresden, Salzburg, Szeged, and Vienna as representatives for middle European cities in different climate zones.Results:Beside site conditions, tree species, height, height of crown base, as well as trunk circumference, have a great influence on the cooling effect for city dwellers. The trunk circumference is a very valuable indicator for estimating climate regulating ecosystem services and therefore a highly robust estimator for policy makers and tree management practitioners when planning and managing urban green areas for improving the availability and provision of ecosystem services.
Keywords: microclimate; tree physiognomy; random forest
1. Introduction
Cities are the most important living space of humans, at least as measured by the proportion of the global population living in them. By 2030, the global urban population is projected to increase to 70%. This growing urbanization causes huge changes in the urban environment [1]. One result of this transformation is the intensification of the Urban Heat Island (UHI) effect. The UHI effect is a systemic characteristic of urban climate and shows in higher air and surface temperatures compared to
Forests2020,11, 1064; doi:10.3390/f11101064 www.mdpi.com/journal/forests
the rural environment due to a combination of factors including urban materials and morphology, anthropogenic heating and a lack of moisture in urban areas e.g., [2]. With ongoing urbanization and at the same time, the effect of climate change, future scenarios predict an exacerbation of UHI in cities [3]. Climate projections for urban areas in Central Europe show increases in heat load for the coming decades. Mean values of the annual number of summer days (≥25◦C) are expected to increase by 20–50 days in the decades ahead compared to the period 1971–2000, depending on the climate scenario (RCP4.5 vs. 8.5) [4]. The severity of this change is shown by a health risk assessment study in the UK which found a 2.1% increase in mortality for every 1◦C rise in temperature [5].
The interdisciplinary project COIN (Cost of Inaction—assessing Costs of Climate Change for Austria) expects a 2.4 times increase in annual heat deaths in the period 2036–2065 in Austria compared to the base level of 385 heat deaths in 2010 [6]. Additionally, the urban climate will be affected by an increase in heat waves of higher intensity and longer duration [7]. Heaviside et al. [8] found that the UHI contributed 52% of the total heat-related mortality during the 2003 heatwave in the West Midlands (UK). Therefore, it is not surprising that a large number of studies deal with mitigating the UHI and cooling public spaces. Increased vegetation cover can help by intercepting solar radiation, and shading and cooling the surrounding air via evapotranspiration [9–12]. Trees in particular can help to cool surfaces, air temperature and improve human thermal comfort in overheated urban areas [12–14].
Many studies have investigated the effect of trees in urban areas and compared them with treeless sites [15–17]. The results of all these studies show considerably lower temperatures beneath the trees.
Numerous studies put the cooling effect in context with tree physiognomy traits like leaf area index (LAI), leaf area density (LAD) or tree height [15,18,19]. Furthermore, Rahman et al. [20] reviewed 13 studies concerning the cooling effect and the influence of tree traits. However, according to our current knowledge, hardly any cross-city empirical studies provide an integrated analysis on the influence of many different tree characteristics and site parameters on the cooling effect of urban trees.
We address this research gap following the argument of Roloff[21] that the current urban tree stock will for some time in the future constitute the urban forest. Analyses need to combine assessments of the current state with future prognoses about climate-adapted trees. Like grey infrastructure, green infrastructure is a rather static component of the urban climate system and we can think of its planting pattern and distribution in the urban infrastructure as creating a path-dependency of ecosystem service provision. Therefore, the management of urban trees to increase their provision of climate regulation is confronted with existing planting patterns, land use zoning, and tree species composition of the urban tree stock. Even though climate-adapted changes to the urban forest are important, for practitioners they are just one criterion amongst other planning objectives and legal regulations, e.g., road safety, vulnerability to pathogens and pests, allergenic potential, invasiveness, and acceptance by city dwellers [22]. In addition, cultural preferences and tried and tested management practices co-determine the selection and planting of urban trees; therefore, the tree stock in many cities world-wide has structural and floristic commonalities. In temperate climate zones, deciduous trees are preferred as they cast shadows in summer and let incoming radiation reach the ground in winter. In this context, a cross-city analysis makes a valuable contribution to the body of knowledge about regulatory ecosystems’ services and their correlation with site conditions, species and tree traits.
Therefore, the aims of the study are (1) to compare the cooling performance of climate-adapted tree species within the real urban tree stock in different cities in Central Europe, (2) to analyse the relative importance of different traits in terms of cooling effect, and (3) to give tree management advice in the context of urban heat island mitigation and improvement of urban microclimates.
The present cross-city analysis considers the comparability of findings and provides quantitative results for an intersection of urban trees that make up the tree stock in different European cities.
2. Materials and Methods
2.1. Study Sites and Species Selection
The study was conducted in the cities of Dresden (Germany), Salzburg (Austria), Szeged (Hungary) and Vienna (Austria) as representatives for middle European cities in different climate zones (Table1).
Table 1.Geographic location and climate of study sites.
City Dresden Salzburg Szeged Vienna
Coordinates 51◦20N,
13◦440E
47◦4800” N, 13◦0200” E
46.255◦N, 20.145◦E
48◦120N, 16◦220E
Elevation [a.s.l] 113 m 424 m 76 m 151 m
Köppen climate classification Dfb Cfb Cfa Cfa
Annual precipitation [23–25] 547 mm 1184 mm 509 mm 600 mm
Average temperature July [23–25] 19.0◦C 18.6◦C 21.7◦C 21.7◦C
Summer daytime–UHI [26] 1.1◦C 1.67◦C 1.38◦C 1.1◦C
Number of tree individuals 21 65 11 3
All climate data refer to the reference period 1981–2010.
For the preselection of tree species, the tree cadasters of Dresden, Salzburg and Vienna were analyzed for frequency of species and age structure. The selection criterion was to identify an intersecting set of trees aged around 20 to 40 years, as these urban trees are mature and make up the current and mid-range tree stock. As the digital tree cadaster for Szeged was only available for the inner-city area at the time of the empirical research, individuals of these species were selected in Szeged with the help of local experts. After identifying the most common species, this subset was evaluated according to the Citree database planning tool to ensure that these pre-selected tree species are suitable in cities. Citree is a supporting tool for choosing the optimal trees for urban areas by providing information about more than 390 tree and shrub species, including site characteristics, and other parameters [27]. The most important criteria for the tree species’ suitability are drought tolerance, hardiness, heat tolerance and late frost tolerance. The results of the Citree analyses of the seven selected tree species are shown in Table2. Altogether, seven species and 100 individuals were investigated to identify traits for cooling urban heat islands.
Table 2.Results of the Citree analyses of the seven selected tree species.
Species Drought Tolerance USDA-
Hardiness Heat Tolerance Late Frost Tolerance
Acer platanoidesL. tolerant 4 medium good
Aesculus x carneaHayne tolerant 6b medium good
Corylus colurnaL. tolerant 5b medium low
Tilia cordataMill. tolerant 4 medium good
Acer platanoides ‘Globosum’L. tolerant 4 good good
Aesculus hippocastanumL. low tolerance 4 low medium
Platanus x acerifoliaMünchh. very tolerant 6b good low
2.2. Tree Physiognomy
For all observation trees, the height, trunk circumference at breast height, and LAI were measured.
The trunk circumference, as the only non-canopy parameter, was selected because of its easy accessibility in tree cadaster data and its common usage in urban forestry analysis and ecosystem services assessment tools like iTree-Eco [28]. To determine the tree height and the trunk circumference, we used the Haglöf ultrasound instrument system (Vertex IV-GS, Grube, Bispingen, Germany) and a measuring tape, respectively. The LAI was measured with the LAI-2200C Plant Canopy Analyzer from LI-COR (Lincoln, NE, USA). Four LAI measurements at breast height were made per tree along the four cardinal
directions using a 90◦cap. Moreover, the crown shape was specified by using two photos (including a measuring rod for scale) intersecting in the middle at a right angle. Afterwards, a coordinate system centered below the tree at breast height (=measuring height) was added to each photo and the shape was extracted by drawing a sufficient number of points along the outlines, measuring x/y values and then converting the x/y values with the help of the scale. These results were used in the FV2200 software from LI-COR (version 2.1.1, Lincoln, NE, USA) to adapt the crown shape and to calculate the crown area and volume. After adaptation of the crown shape, the LAI was interpreted as foliage density for single tree measurements. By averaging the four LAI values per tree, differences in the crown density were balanced. All these steps were carried out following the methodology described in the device manual [29]. To calculate the LAD, the LAI was divided by the crown height. Table3gives an overview of descriptive statistics for all traits.
2.3. Microclimate Measurements
The climatic parameters used are surface and air temperature (in 1.1 m and at crown height) as well as the wet bulb globe-temperature (WBGT). WBGT is nowadays the most widely used index of heat stress [30]. The mitigation effect was calculated using the difference between temperatures measured at the crown-shaded and full sun-exposed reference areas [19]. The reference areas always had the same surface material and were placed as close as possible to the study tree.
The surface temperature measurements were carried out using an Infrared Radiometer, Model MI-220, from Apogee Instruments Inc. (Logan, UT, USA). The device was fixed on a tripod to make sure all measurements were carried out from the same height (0.55 m) and angle (45◦). Because of the changing sun position, it was important to measure the surface temperature of the tree crown-shaded area at as central a point as possible. To measure the air temperature and the WBGT at 1.1 m height, a black globe thermometer (PCE-WB 20SD, PCE Instruments, Meschede, Germany) was used. To calculate the WBGT, the globe thermometer measures four basic elements of the thermal environment: air temperature, mean radiant temperature, absolute humidity, and air movement [30].
The height of 1.1 m corresponds to the center of mass of a standing adult European, the most frequently applied standard subject in outdoor thermal comfort investigations [15,31]. For measuring the air temperature at tree crown height, iButtons (Hygrochron temp/humidity Logger DS1923-F5, Maxim Integrated, San Jose, CA, USA) or Beacons (temperature, humidity, dew point, Bluetooth sensor beacon and logger, Blue Maestro Limited, London, UK) were placed in radiation shields and hung within the tree crown of 68 individuals in all four cities. Reference iButtons/Beacons outside the tree crown were installed at the same height on lampposts and other suitable poles [19].
To minimize the variations of temperatures linked to the changing atmospheric conditions during a day and between different days, all measurements were run through on heat days between 13:30 and 15:30 CEST under cloudless conditions (Salzburg: 25 and 26 July 2019; Vienna: 12 August 2019;
Dresden: 16 August 2018; Szeged: 21 August 2019). Table3gives an overview of descriptive statistics for the measured cooling effects.
2.4. Statistical Analysis
In order to test for the importance of different tree physiognomy parameters, i.e., tree traits, as well as the influence of the species on cooling capacity, we performed a random forest regression analysis (ntree=10,000 bootstrap samples with mtry=2 traits randomly selected at each node) using the R package Random-Forest [32]. We used the variable importance, which is a measure for the impact of individual traits on a correct estimate of cooling capacity. For the analysis, we used Rstudio version 3.6.2 (R Core Team, Vienna, Austria). The correlations between the cooling effect and the numerical tree traits were assessed using Pearson’s product–moment correlation. The level of significance was set atα<0.05.
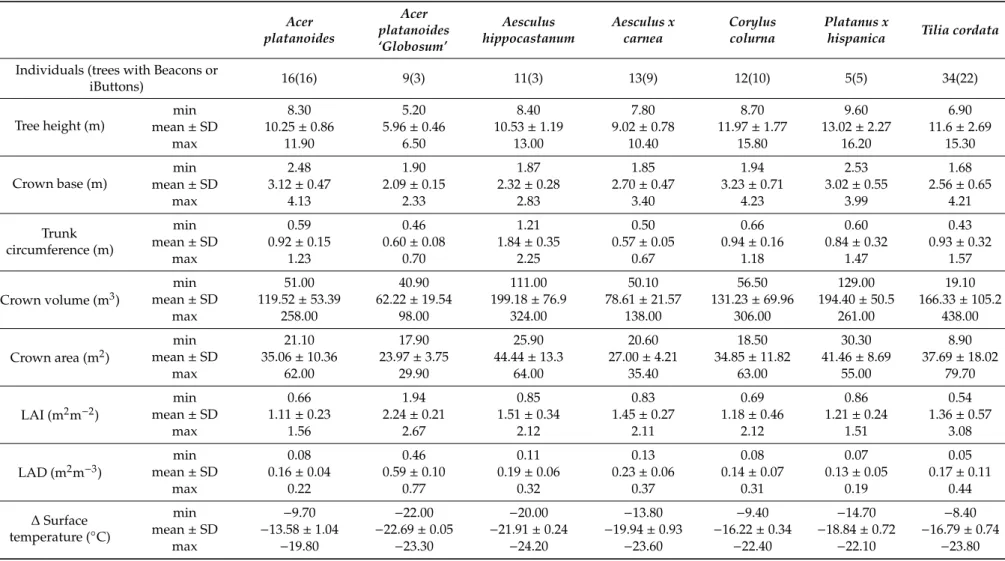
Table 3.Tree traits and measured cooling effect by species with minimum, mean±SD and maximum values.
Acer platanoides
Acer platanoides
‘Globosum’
Aesculus hippocastanum
Aesculus x carnea
Corylus colurna
Platanus x
hispanica Tilia cordata Individuals (trees with Beacons or
iButtons) 16(16) 9(3) 11(3) 13(9) 12(10) 5(5) 34(22)
Tree height (m)
min 8.30 5.20 8.40 7.80 8.70 9.60 6.90
mean±SD 10.25±0.86 5.96±0.46 10.53±1.19 9.02±0.78 11.97±1.77 13.02±2.27 11.6±2.69
max 11.90 6.50 13.00 10.40 15.80 16.20 15.30
Crown base (m)
min 2.48 1.90 1.87 1.85 1.94 2.53 1.68
mean±SD 3.12±0.47 2.09±0.15 2.32±0.28 2.70±0.47 3.23±0.71 3.02±0.55 2.56±0.65
max 4.13 2.33 2.83 3.40 4.23 3.99 4.21
Trunk circumference (m)
min 0.59 0.46 1.21 0.50 0.66 0.60 0.43
mean±SD 0.92±0.15 0.60±0.08 1.84±0.35 0.57±0.05 0.94±0.16 0.84±0.32 0.93±0.32
max 1.23 0.70 2.25 0.67 1.18 1.47 1.57
Crown volume (m3)
min 51.00 40.90 111.00 50.10 56.50 129.00 19.10
mean±SD 119.52±53.39 62.22±19.54 199.18±76.9 78.61±21.57 131.23±69.96 194.40±50.5 166.33±105.2
max 258.00 98.00 324.00 138.00 306.00 261.00 438.00
Crown area (m2)
min 21.10 17.90 25.90 20.60 18.50 30.30 8.90
mean±SD 35.06±10.36 23.97±3.75 44.44±13.3 27.00±4.21 34.85±11.82 41.46±8.69 37.69±18.02
max 62.00 29.90 64.00 35.40 63.00 55.00 79.70
LAI (m2m−2)
min 0.66 1.94 0.85 0.83 0.69 0.86 0.54
mean±SD 1.11±0.23 2.24±0.21 1.51±0.34 1.45±0.27 1.18±0.46 1.21±0.24 1.36±0.57
max 1.56 2.67 2.12 2.11 2.12 1.51 3.08
LAD (m2m−3)
min 0.08 0.46 0.11 0.13 0.08 0.07 0.05
mean±SD 0.16±0.04 0.59±0.10 0.19±0.06 0.23±0.06 0.14±0.07 0.13±0.05 0.17±0.11
max 0.22 0.77 0.32 0.37 0.31 0.19 0.44
∆Surface temperature (◦C)
min −9.70 −22.00 −20.00 −13.80 −9.40 −14.70 −8.40
mean±SD −13.58±1.04 −22.69±0.05 −21.91±0.24 −19.94±0.93 −16.22±0.34 −18.84±0.72 −16.79±0.74
max −19.80 −23.30 −24.20 −23.60 −22.40 −22.10 −23.80
Table 3.Cont.
Acer platanoides
Acer platanoides
‘Globosum’
Aesculus hippocastanum
Aesculus x carnea
Corylus colurna
Platanus x
hispanica Tilia cordata
∆WBGT (◦C)
min −2.80 −2.40 −4.40 −2.00 −1.80 −4.00 −2.20
mean±SD −3.67±0.62 −3.09±0.38 −4.68±0.15 −3.17±0.99 −3.81±1.60 −4.72±0.40 −4.08±1.09
max −4.50 −3.60 −5.00 −4.90 −5.70 −5.20 −8.00
∆Air temperature 1.1 m (◦C)
min −2.60 −2.20 −5.00 −0.60 −0.20 −3.70 −0.80
mean±SD −3.95±1.03 −3.09±0.69 −5.43±0.34 −2.70±1.59 −4.40±2.76 −5.70±1.03 −4.39±2.02
max −5.50 −4.00 −6.10 −5.80 −7.10 −6.70 −8.50
∆Air temperature at crown height (◦C)
min 1.50 −1.50 −1.00 0.40 0.30 0.50 0.85
mean±SD −0.38±2.81 −1.53±0.38 −1.33±1.38 −0.70±3.16 −0.35±4.59 −0.46±2.57 −0.53±3.93
max −1.75 −1.60 −1.50 −2.50 −0.75 −1.70 −1.90
3. Results
In the following subsections, the detailed results of our analyses are described. Moreover, the results concerning the explanatory power and the importance of different tree traits as well as the correlation coefficients between tree traits and cooling effect are summarized in Table4.
Table 4. Overview of explanatory power of tree traits and site characteristics on cooling effect, the importance (%IncMSE=mean decrease in accuracy of mean square error) of the different parameters in the correlation model, correlation coefficient and significance level.
(a) (b) (c) (d)
Surface Temperature WBGT Air Temperature 1.1 m Air Temperature at Crown Height
% Variability
explained: 52.36 56.45 64.04 15.45
%IncMSE Correlation
coefficient %IncMSE Correlation
coefficient %IncMSE Correlation
coefficient %IncMSE Correlation coefficient
Tree species 2.28 0.52 0.65 0.01
Tree height 2.19 r=−0.47 *** 0.18 r=−0.06 0.24 r=−0.10 0.52 r=−0.15 Crown base 1.32 r=−0.46 *** 0.11 r=−0.29 ** 0.18 r=−0.34 *** 0.39 r=−0.32 **
Crown area 0.17 r=−0.12 0.29 r=0.18 0.64 r=0.06 0.13 r=0.20
Crown volume 0.37 r=−0.11 0.28 r=0.20 * 0.56 r=0.12 0.14 r=0.15
LAD 1.76 r=0.5 *** 0.17 r=−0.05 0.22 r=0.05 0.44 r=0.27 *
LAI 0.86 r=0.45 *** 0.05 r=0.03 0.21 r=0.18 0.09 r=0.26 *
Trunk
circumference 0.84 r=0.4 0.39 r=0.26 ** 0.89 r=0.22 * 0.06 r=0.17
Street
orientation 0.41 0.49 1.45 0.02
Climate
classification 0.23 1.71 2.78 0.33
* correlations significant atp<0.05 level, ** correlations significant atp<0.01 level, *** correlations significant at p<0.001 level.
3.1. Surface Cooling
In accordance with many other empirical studies, our results show a pronounced cooling effect of trees on surface temperature [20,33]. The measured surface temperatures of shaded areas range from 22.2◦C to 38.6◦C. As expected, the surface temperatures at full sun-exposed areas were considerably higher, varying from 32.4◦C to 57.0 ◦C. A reduction in surface temperatures could be found for all individuals with means ranging from 13.58◦C (Acer platanoides) to 22.69 ◦C (Acer platanoides
“Globosum”). Table3shows the minimum, mean and maximum surface cooling effect for each of the seven tree species. These values are similar to the surface cooling effect measured in the study of Rahman et al. [33] (∆12.71–25.59◦C) who also compared different urban tree species with different species-specific tree traits.
Using our measured tree physiognomies data and adding information about climate zone (Köppen climate classification) as well as street orientation (North–South, East–West) or open places (free standing) for each tree individual in the random forest analysis, 52.36% of the surface cooling effect can be explained. The order of importance for the surface cooling effect is tree species>tree height>LAD> crown base>LAI>trunk circumference>street orientation>crown volume>
climate>crown area (details shown in Table4a).
The scatter plot (a) of Figure1shows a strong significant negative linear correlation between cooling effect and tree height. Beside the tree height, the height of the crown base also correlates significantly negatively (Table4a). In contrast to that, surface cooling and LAD (Figure1b) as well as LAI (Table4a) correlate significantly positively. Correlations with the crown area, crown volume, or the trunk circumference show no statistical significance. In sum, these findings show that the lower the tree height as well as the height of the crown base and the denser the leaf foliage is, the higher
is the surface cooling potential of trees. For example,Acer platanoides “Globosum” with the lowest height and lowest mean crown base but the highest LAD provides the maximum surface cooling.
WhereasAcer platanoides, belonging to the bigger individuals with low mean LAD and LAI measured, provides the lowest cooling effect (Table3).
Forests 2020, 11, 1064 8 of 14
and lowest mean crown base but the highest LAD provides the maximum surface cooling. Whereas Acer platanoides, belonging to the bigger individuals with low mean LAD and LAI measured, provides the lowest cooling effect (Table 3).
Figure 1. Correlation between surface cooling and (a) tree height (r = −0.47 p < 0.001) (b) LAD (r = 0.5 p < 0.001).
3.2. Cooling of Air Temperature at 1.1 m Height
The observed air temperature at 1.1 m height under the shading tree crown ranges from 29.3 °C to 38.7 °C. The temperatures at the full sun-exposed reference site vary from 31.6 °C to 43.6 °C. A reduction in air temperature was found for each individual with means ranging from 2.70 °C (Aesculus x carnea) to 5.07 °C (Platanus x hispanica). Table 3 shows the minimum, mean and maximum cooling effect for each of the seven tree species.
The average cooling effect of 3.9 °Cis markedly higher than that described in many studies.
Takács et. al. [17] and Rahman et. al. [34] described average temperature differences of only 0.4–0.8
°C or 1.0–1.3 °C. However, Golden et. al. [35] measured higher average temperature differences of 3.5 °C in a study design comparable to ours because it measured reduction in ambient air temperature during highest solar irradiance. The random forest analysis shows that 64.04% of the cooling effect can be explained by the measured tree traits, information about climate zone and the street orientation. The order of importance is climate > street orientation > trunk circumference > tree species
> crown area > crown volume > tree height > LAD > LAI > crown base (details shown in Table 4c).
Figure 2 visualises that trees growing under a temperate climate (Cfb and Cfa) have higher cooling potential than trees growing under continental climate (Dfb) conditions. Moreover, the street orientation influences the cooling potential. According to the boxplots, trees growing in open places (free standing) provide more cooling than trees growing in a street canyon (N–S, E–W). Besides the site characteristics (climate and street orientation), the trunk circumference is a good indicator for the cooling effect. There is a significant positive linear correlation between cooling and the trunk circumference (r = 0.22 p < 0.05). Our analyses also show a strong negative correlation between cooling effect and the height of the crown base (r = −0.34 p < 0.001) (Table 4c). In other words, the bigger the trunk circumference and the lower the crown base, the better trees can cool the air temperature.
(a) (b)
Figure 1.Correlation between surface cooling and (a) tree height (r=−0.47p<0.001) (b) LAD (r=0.5 p<0.001).
3.2. Cooling of Air Temperature at 1.1 m Height
The observed air temperature at 1.1 m height under the shading tree crown ranges from 29.3◦C to 38.7◦C. The temperatures at the full sun-exposed reference site vary from 31.6◦C to 43.6◦C. A reduction in air temperature was found for each individual with means ranging from 2.70◦C (Aesculus x carnea) to 5.07◦C (Platanus x hispanica). Table3shows the minimum, mean and maximum cooling effect for each of the seven tree species.
The average cooling effect of 3.9 ◦C is markedly higher than that described in many studies.
Takács et al. [17] and Rahman et al. [34] described average temperature differences of only 0.4–0.8◦C or 1.0–1.3◦C. However, Golden et al. [35] measured higher average temperature differences of 3.5◦C in a study design comparable to ours because it measured reduction in ambient air temperature during highest solar irradiance. The random forest analysis shows that 64.04% of the cooling effect can be explained by the measured tree traits, information about climate zone and the street orientation.
The order of importance is climate>street orientation>trunk circumference>tree species>crown area
>crown volume>tree height>LAD>LAI>crown base (details shown in Table4c).
Figure2visualises that trees growing under a temperate climate (Cfb and Cfa) have higher cooling potential than trees growing under continental climate (Dfb) conditions. Moreover, the street orientation influences the cooling potential. According to the boxplots, trees growing in open places (free standing) provide more cooling than trees growing in a street canyon (N–S, E–W). Besides the site characteristics (climate and street orientation), the trunk circumference is a good indicator for the cooling effect. There is a significant positive linear correlation between cooling and the trunk circumference (r=0.22p<0.05). Our analyses also show a strong negative correlation between cooling effect and the height of the crown base (r=−0.34p<0.001) (Table4c). In other words, the bigger the trunk circumference and the lower the crown base, the better trees can cool the air temperature.
Forests 2020, 11, 1064 9 of 14
Figure 2. Boxplot of cooling of air temperature at 1.1 m height and Köppen climate classification and street orientation.
3.3. Improving Human Thermal Comfort
The measured WBGT in the shade of the tree crown ranges from 21.8 °C to 28.0 °C and for the full sun-exposed sites from 24.2 °C to 31.3 °C. An improvement in human thermal comfort can be observed for all individuals with means ranging from 3.09 °C (Acer platanoides “Globosum”) to 4.72 °C (Platanus x hispanica). Table 3 presents the minimum, mean and maximum effect on WBGT for each of the seven tree species. WBGT is a proxy for improvement of human thermal comfort and translates the cooling of urban heat islands into a metric that is relevant for the health and comfort of city dwellers. The measured values are consistent with the cooling effect measured in other studies.
Armson et. al. as well as Sanusi et. al. described average temperature differences of 5–7 °C and 4.7–
5.3 °C [14,15].
The random forest analysis shows that the measured tree physiognomies data, information about climate classification and the street orientation explain 56.45% of the improvement of human thermal comfort. The order of importance is climate > tree species > street orientation > trunk circumference > crown area > crown volume > tree height > LAD > crown base > LAI (details shown in Table 4, column b).
As shown in Table 4b, climate has the highest influence on the cooling potential concerning human thermal comfort. Figure 3 illustrates that trees growing under a temperate climate (Cfb and Cfa) have on average a higher cooling potential than trees growing under continental climate (Dfb) conditions. Moreover, the boxplot shows that trees in open places have a higher cooling potential than trees in street canyons. There also is a significant positive linear correlation between cooling measured by WBGT and the trunk circumference (r = 0.26 p < 0.01). Furthermore, our analyses show a negative correlation between cooling effect and the height of the crown base (r = −0.29 p < 0.01) and a positive correlation with the crown volume (r = 0.20 p < 0.05), both significant (Table 4b).
Summarising, the bigger the trunk circumference as well as the crown volume, and the lower the crown base, the higher the positive influence on the improvement of human thermal comfort.
Figure 3. Boxplot of WBGT and Köppen climate classification plus street orientation.
Figure 2.Boxplot of cooling of air temperature at 1.1 m height and Köppen climate classification and street orientation.
3.3. Improving Human Thermal Comfort
The measured WBGT in the shade of the tree crown ranges from 21.8◦C to 28.0◦C and for the full sun-exposed sites from 24.2◦C to 31.3◦C. An improvement in human thermal comfort can be observed for all individuals with means ranging from 3.09◦C (Acer platanoides“Globosum”) to 4.72◦C (Platanus x hispanica). Table3presents the minimum, mean and maximum effect on WBGT for each of the seven tree species. WBGT is a proxy for improvement of human thermal comfort and translates the cooling of urban heat islands into a metric that is relevant for the health and comfort of city dwellers.
The measured values are consistent with the cooling effect measured in other studies. Armson et al. as well as Sanusi et al. described average temperature differences of 5–7◦C and 4.7–5.3◦C [14,15].
The random forest analysis shows that the measured tree physiognomies data, information about climate classification and the street orientation explain 56.45% of the improvement of human thermal comfort. The order of importance is climate>tree species>street orientation>trunk circumference
>crown area>crown volume>tree height>LAD>crown base>LAI (details shown in Table4, column b).
As shown in Table4b, climate has the highest influence on the cooling potential concerning human thermal comfort. Figure3illustrates that trees growing under a temperate climate (Cfb and Cfa) have on average a higher cooling potential than trees growing under continental climate (Dfb) conditions.
Moreover, the boxplot shows that trees in open places have a higher cooling potential than trees in street canyons. There also is a significant positive linear correlation between cooling measured by WBGT and the trunk circumference (r=0.26p<0.01). Furthermore, our analyses show a negative correlation between cooling effect and the height of the crown base (r=−0.29p<0.01) and a positive correlation with the crown volume (r=0.20p<0.05), both significant (Table4b). Summarising, the bigger the trunk circumference as well as the crown volume, and the lower the crown base, the higher the positive influence on the improvement of human thermal comfort.
Figure 2. Boxplot of cooling of air temperature at 1.1 m height and Köppen climate classification and street orientation.
3.3. Improving Human Thermal Comfort
The measured WBGT in the shade of the tree crown ranges from 21.8 °C to 28.0 °C and for the full sun-exposed sites from 24.2 °C to 31.3 °C. An improvement in human thermal comfort can be observed for all individuals with means ranging from 3.09 °C (Acer platanoides “Globosum”) to 4.72 °C (Platanus x hispanica). Table 3 presents the minimum, mean and maximum effect on WBGT for each of the seven tree species. WBGT is a proxy for improvement of human thermal comfort and translates the cooling of urban heat islands into a metric that is relevant for the health and comfort of city dwellers. The measured values are consistent with the cooling effect measured in other studies.
Armson et. al. as well as Sanusi et. al. described average temperature differences of 5–7 °C and 4.7–
5.3 °C [14,15].
The random forest analysis shows that the measured tree physiognomies data, information about climate classification and the street orientation explain 56.45% of the improvement of human thermal comfort. The order of importance is climate > tree species > street orientation > trunk circumference > crown area > crown volume > tree height > LAD > crown base > LAI (details shown in Table 4, column b).
As shown in Table 4b, climate has the highest influence on the cooling potential concerning human thermal comfort. Figure 3 illustrates that trees growing under a temperate climate (Cfb and Cfa) have on average a higher cooling potential than trees growing under continental climate (Dfb) conditions. Moreover, the boxplot shows that trees in open places have a higher cooling potential than trees in street canyons. There also is a significant positive linear correlation between cooling measured by WBGT and the trunk circumference (r = 0.26 p < 0.01). Furthermore, our analyses show a negative correlation between cooling effect and the height of the crown base (r = −0.29 p < 0.01) and a positive correlation with the crown volume (r = 0.20 p < 0.05), both significant (Table 4b).
Summarising, the bigger the trunk circumference as well as the crown volume, and the lower the crown base, the higher the positive influence on the improvement of human thermal comfort.
Figure 3. Boxplot of WBGT and Köppen climate classification plus street orientation.
Figure 3.Boxplot of WBGT and Köppen climate classification plus street orientation.
3.4. Transpirational Cooling
The measured air temperature at crown height in the shading tree crown ranges from 28.4◦C to 36.1◦C. The air temperature at crown height at the full sun-exposed reference site ranges from 29.4◦C to 35.9◦C. These high temperatures highlight the extreme heat loads at the chosen study sites.
A reduction in air temperature at crown height can be found for most of the individuals with means ranging from 0.35◦C (Corylus colurna) to 1.53◦C (Platanus x hispanica). Table3shows the minimum, mean and maximum cooling effect for each of the seven tree species. The rather small differences measured correspond to empirical values on transpirational cooling in the body of literature. Gillner et al. and Rahman et al. described mean temperature differences of 0.77–2.22◦C and 0.8◦C [19,36].
The even smaller air temperature differences observed in our study may be caused by reduced leaf transpiration rates at times of highest solar irradiance and extremely high temperatures that exceed the optimum of photosynthesis, which in turn reduces transpiration rates [37].
The random forest analysis shows that only 15.45% of the transpirational cooling can be explained by the measured tree physiognomies data, information about climate classification and street orientation.
The order of importance is tree height>LAD>crown base>climate>crown volume>crown area>
LAI>trunk circumference>street orientation>tree species (details shown in Table4, column d).
However, our statistical analyses show some significant correlations between tree traits and the cooling of air temperature at crown height. There is a significant negative correlation between the cooling effect and the height of the crown base (r=−0.32p<0.01) and significant positive correlations with LAD (r=0.27p<0.05) as well as LAI (r=0.26p<0.05) (Table4d).
4. Discussion
4.1. Surface Cooling
In their review paper, Rahman et al. [20] identified the following order of relative contributions for surface cooling: climate>below canopy surface>growing size>leaf thickness>LAI>crown shape
>plant functional type>habitat>wood anatomy>leaf shape>leaf colour. By comparison, our model put forward the following order: tree species>tree height> LAD>crown base> LAI>
trunk circumference>street orientation>crown volume>climate>crown area (bold font highlights the parameters that are explanatory in both models). In contrast to the order of traits Rahman et al.
identified, the parameter “climate” is, according to our results, only in the penultimate place. However, if we take a closer look at the result, there is a notably greater variation in climate (tropical climates, dry climates, temperate climate, continental climate) in the different studies, than in the four cities we selected (temperate climate, continental climate). Similar to the growing size in the third rank, we could identify the tree height as the second most important tree trait. The review paper by Rahman et al. [20]
suggests that the influence of tree size on the surface cooling relates to the fact that smaller trees cast shade on a specific surface point for a longer time. Our results support this line of reasoning, since the height of the crown base is the fourth most important parameter in our model and has a significant negative correlation with surface cooling (Table4a). This means that the smaller the distance between the bottom of the tree crown and the ground, the higher the cooling performance is. Looking again at the order of tree traits in the model, LAI is also highly ranked. This also matches our model in which LAD and LAI are ranked 3rd and 5th. In line with the findings in other studies, the LAD (Figure1b) and LAI (Table4a) correlate strongly positively with the surface cooling effect [19,33]. According to our model, the tree species is the most important factor. It can be assumed that the tree species is a very good indicator as the canopy shape (tree height, LAD and LAI) is species specific.
4.2. Cooling of Air Temperature at 1.1 m Height
In our model, tree traits had the strongest explanatory power when considering the cooling of air temperature at 1.1 m height. Over 64% of the mitigation effect is explained by the selected tree traits and site parameters. According to our analyses, the order of importance is climate>street orientation
>trunk circumference>tree species>crown area>crown volume>tree height>LAD>LAI>
crown base. The most important factors are the two site parameters climate and street orientation.
It seems that trees growing under a temperate climate have a higher cooling potential than those under a continental climate (Figure2).
This is possibly due to a higher water availability, which leads to higher transpiration rates [34].
This assumption can be underlined comparing the mean precipitation of the months (May–July) preceding microclimate measurement campaigns. Salzburg (Cfb) benefited from 443 mm [24]
precipitation, followed by Vienna (Cfa) with 191 mm [24] and Szeged (Cfa) with 173 mm [25]
and finally Dresden (Dfb) with 147 mm [23]. Additionally, the street orientation has a strong influence on the cooling potential. Trees growing in open places (free) provide more cooling than trees growing in street canyons (N–S, E–W) (Figure2). We assume that this is due to the higher temperatures in open places and the missing artificial shade of, for example, buildings. Furthermore, other studies report that the cooling effect in E–W is higher than in N–S-running street canyons and that the cooling potential of trees in N–S-oriented streets strongly depends on the daytime and on the side of the street [38]. In addition to the site characteristics, the trunk circumference is a good indicator for the cooling effect at 1.1 m height. Our results show a significant positive linear correlation between cooling and the trunk circumference (Table4c). Most likely, the high importance can be explained by the intercorrelation between trunk circumference and the following numeric tree physiognomies parameters: crown area (r=0.59p<0.001)>crown volume (r=0.57p<0.001)>tree height (r=0.34 p<0.001). These correlations are the basis for allometric and growth equations that are also widely used for modelling the regulation of ecosystem services of urban trees [39]. This turns the trunk circumference into a highly meaningful indicator for estimating climate-regulating ecosystem services.
For urban tree management practitioners, this has practical implications because this indicator could be easily measured and recorded during tree inspections and could be considered in urban tree management [28]. To include estimation and monitoring of ecosystem services in tree cadasters and tree inspection routines would be a useful addition in the context of a future-oriented and climate-adaptive urban tree management. Our findings underscore the suggestion by Scholz et al. that in order to support ecosystem service assessment with tree cadasters, practitioners could consider adding measurements of tree trunk circumference during regular tree inspections [28].
4.3. Improving Human Thermal Comfort
Our results add to the body of literature that demonstrates the important role of trees for improving human thermal comfort in cities. The selected parameters explain over 56% of the effect on WBGT.
The order of parameters concerning the WBGT cooling is climate>tree species>street orientation
>trunk circumference > crown area>crown volume >tree height> LAD>crown base> LAI.
Again, the climate and the street orientation are highly important for the WBGT cooling potential.
In addition, the tree species and the trunk circumference have a great influence on human thermal comfort. Regarding the tree species, it can be assumed that it is a very good indicator because the canopy shape (tree height, LAD and LAI) is species specific. However, tree species with equal foliage density do not differ significantly in their cooling potential [14]. Furthermore, the trunk circumference intercorrelates with the crown area, crown volume and tree height, as mentioned before. Although our data show no significant correlation between WBGT cooling and LAI/LAD, a positive effect of a higher LAI as well as LAD on human thermal comfort is described in the literature [20,34]. Finally, the height of the crown base shows a significant negative correlation (Table4b). We suggest that this is the same size effect as described for the surface cooling effect. It is obvious that a lower tree crown base casts shade on a specific surface point for a longer time, which also influences human thermal comfort positively.
4.4. Transpirational Cooling
The results concerning air temperature within the tree crown are in line with previous studies, which also reported a rather small transpirational cooling effect [19,36]. These slight differences may be the reason for the poor explanatory power of these parameters in our model. The air temperature within the tree crown could be explained worse by the selected parameters. Only about 15% of the cooling effect could be explained in our model. Moreover, it is surprising that the cooling effect seems to correlate significantly negatively with the crown base, which means that the smaller the distance between the bottom of the tree crown and the ground, the higher the cooling effect is. This contradicts the findings of Rahman’s meta-analysis. One explanation for this might be the strong correlation between crown base and LAI (r=0.49p>0.001) as well as between crown base and LAD (r=0.44 p>0.001). This assumption is supported by the significant positive correlation of the cooling effect and LAD/LAI (Table3d). The relation of cooling effect and LAD/LAI also has been described in other studies [19,34].
4.5. Conclusions and Tree Management Recommendations
In situ measurements of tree physiognomy and microclimate effects for an intersecting set of urban tree species across four European cities with pronounced UHI intensities allow for the following general conclusions and improved management recommendations for urban heat mitigation.
As basis for our recommendations, it is important to emphasize that tree species in urban areas have to be adapted to the urban climate and site conditions [40]. By examining and analyzing the cooling effect of seven different tree species with different traits and site conditions, the following recommendations for optimizing cooling benefits of urban street trees can be given:
1. Tree and crown base height should be low to provide constant shading for pedestrians (as far as allowed by traffic and safety regulations).
2. Tree species with dense and big canopies ensure better shading effect and human thermal comfort.
3. The trunk circumference is a rather easy to measure indicator for estimating climate regulating ecosystem services and therefore highly meaningful for decision makers and tree management practitioners. This indicator could be easily measured and recorded during tree inspections and recorded in tree cadasters.
4. Trees in open places provide the highest cooling effect.
In accordance with Rahman et al. [20], we suggest that more research is done on modelling approaches that incorporate empirical data as such modelling results will improve the information base for policy makers and tree management practitioners and improve decision-making processes.
Author Contributions:Conceptualization, C.H. and A.H.; Data curation, C.H.; Formal analysis, C.H.; Funding acquisition, A.H.; Investigation, C.H. and A.H.; Methodology, C.H., S.G.,Á.G. and A.H.; Project administration, A.H.; Resources, C.H., S.G.,Á.G., E.T. and A.H.; Supervision, R.R.J. and A.H.; Validation, C.H.; Visualization, C.H.;
Writing—original draft, C.H.; Writing—review & editing, C.H. and A.H. All authors have read and agreed to the published version of the manuscript.
Funding:This work was supported by the Sparkling Science research program of the Federal Ministry of Science, Research and Economy (BMWFW), Austria, project “Urban trees as climate messengers”, grant number SPA 06/005.
Acknowledgments: We thank Celina Stanley and Wolfgang Rainsberger for collaboration in project field data collection. We are grateful to Christian Stadler, Michael Heinl (Stadt:Gärten Salzburg), Günther Nowotny and Matthias Marbach for administrative and technical support.
Conflicts of Interest: The authors declare no conflict of interest. The funders had no role in the design of the study; in the collection, analyses, or interpretation of data; in the writing of the manuscript; or in the decision to publish the results.
References
1. Nikodinoska, N.; Paletto, A.; Pastorella, F.; Granvik, M.; Franzese, P.P. Assessing, valuing and mapping ecosystem services at city level: The case of Uppsala (Sweden).Ecol. Model.2018,368, 411–424. [CrossRef]
2. Oke, T.R. The energetic basis of the urban heat island.Q. J. R. Meteorol. Soc.1982,108, 1–24. [CrossRef]
3. McCarthy, M.P.; Best, M.J.; Betts, R.A. Climate change in cities due to global warming and urban effects.
Geophys. Res. Lett.2010,37. [CrossRef]
4. Zuvela-Aloise, M.; de Wit, R.; Hollasi, B.; Andre, K.ZAMG Urban Modelling; ZAMG: Wien, Austria, 2017.
5. Hajat, S.; Vardoulakis, S.; Heaviside, C.; Eggen, B. Climate change effects on human health: Projections of temperature-related mortality for the UK during the 2020s, 2050s and 2080s.J. Epidemiol. Community Health 2014,68, 641–648. [CrossRef]
6. Steininger, K.W.; König, M.; Bednar-Friedl, B.; Kranzl, L.; Loibl, W.; Prettenthaler, F.Economic Evaluation of Climate Change Impacts; Springer: Cham, Switzerland, 2016.
7. IPCC.Climate Change 2013: The Physical Science Basis; Stocker, T., Qin, D., Plattner, G., Tignor, M., Allen, S., Boschung, J., Nauels, A., Xia, Y., Bex, V., Midgley, P., Eds.; Cambridge University Press: Cambridge, UK;
New York, NY, USA, 2013. [CrossRef]
8. Heaviside, C.; Vardoulakis, S.; Cai, X.-M. Attribution of mortality to the urban heat island during heatwaves in the West Midlands, UK.Environ. Health2016,15, 49–59. [CrossRef]
9. Venter, Z.S.; Krog, N.H.; Barton, D.N. Linking green infrastructure to urban heat and human health risk mitigation in Oslo, Norway.Sci. Total Environ.2020,709, 136193. [CrossRef]
10. Salmond, J.A.; Tadaki, M.; Vardoulakis, S.; Arbuthnott, K.; Coutts, A.; Demuzere, M.; Dirks, K.N.;
Heaviside, C.; Lim, S.; Macintyre, H. Health and climate related ecosystem services provided by street trees in the urban environment.Environ. Health2016,15, 95–111. [CrossRef]
11. Larsen, L. Urban climate and adaptation strategies.Front. Ecol. Environ.2015,13, 486–492. [CrossRef]
12. Bowler, D.E.; Buyung-Ali, L.; Knight, T.M.; Pullin, A.S. Urban greening to cool towns and cities: A systematic review of the empirical evidence.Landsc. Urban Plan.2010,97, 147–155. [CrossRef]
13. Lenzholzer, S.Weather in the City-How Design Shapes the Urban Climate; Nai 010 Uitgevers/Publishers:
Rotterdam, The Netherlands, 2015.
14. Sanusi, R.; Johnstone, D.; May, P.; Livesley, S.J. Microclimate benefits that different street tree species provide to sidewalk pedestrians relate to differences in Plant Area Index. Landsc. Urban Plan. 2017,157, 502–511.
[CrossRef]
15. Armson, D.; Stringer, P.; Ennos, A. The effect of tree shade and grass on surface and globe temperatures in an urban area.Urban For. Urban Green.2012,11, 245–255. [CrossRef]
16. Gross, G. Effects of different vegetation on temperature in an urban building environment. Micro-scale numerical experiments.Meteorol. Z.2012,21, 399–412. [CrossRef]
17. Takács,Á.; Kiss, M.; Hof, A.; Tanács, E.; Gulyás,Á.; Kántor, N. Microclimate modification by urban shade trees–an integrated approach to aid ecosystem service based decision-making.Procedia Environ. Sci.2016,32, 97–109. [CrossRef]
18. Moser, A.; Rötzer, T.; Pauleit, S.; Pretzsch, H. Structure and ecosystem services of small-leaved lime (Tilia cordata Mill.) and black locust (Robinia pseudoacacia L.) in urban environments.Urban For. Urban Green.
2015,14, 1110–1121. [CrossRef]
19. Gillner, S.; Vogt, J.; Tharang, A.; Dettmann, S.; Roloff, A. Role of street trees in mitigating effects of heat and drought at highly sealed urban sites.Landsc. Urban Plan.2015,143, 33–42. [CrossRef]
20. Rahman, M.A.; Stratopoulos, L.M.; Moser-Reischl, A.; Zölch, T.; Häberle, K.-H.; Rötzer, T.; Pretzsch, H.;
Pauleit, S. Traits of trees for cooling urban heat islands: A meta-analysis.Build. Environ.2020,170, 106606.
[CrossRef]
21. Roloff, A.T.; Weiß, D.; Aktuelle, H. Fragen der Stadtbaumplanung, -pflege und -verwendung.Forstwiss. Beitr.
Tharandt/Contrib. For. Sc. Beih.2013,14, 173–187.
22. Endreny, T.A. Strategically growing the urban forest will improve our world.Nat. Commun.2018,9, 1160.
[CrossRef]
23. Deutscher Wetterdienst. Climate Data of the Reference Period 1981–2010 for Germany. Available online:https:
//www.dwd.de/DE/wetter/wetterundklima_vorort/sachsen/dresden/_node.html(accessed on 5 August 2020).
24. Zentralanstalt für Meteorologie und Geodynamik. Climate Data of the Reference Period 1981–2010 for Austria. Available online:https://www.zamg.ac.at/cms/de/klima/informationsportal-klimawandel/daten- download/klimamittel(accessed on 5 August 2020).
25. Hungarian Meteorological Service. Climate Data of the Reference Period 1981–2010 for Hungary.
Available online:www.met.hu(accessed on 5 August 2020).
26. Chakraborty, T.; Lee, X. A simplified urban-extent algorithm to characterize surface urban heat islands on a global scale and examine vegetation control on their spatiotemporal variability.Int. J. Appl. Earth Obs. Geoinf.
2019,74, 269–280. [CrossRef]
27. Vogt, J.; Gillner, S.; Hofmann, M.; Tharang, A.; Dettmann, S.; Gerstenberg, T.; Schmidt, C.; Gebauer, H.;
de Riet, K.V.; Berger, U.; et al. Citree: A database supporting tree selection for urban areas in temperate climate.Landsc. Urban Plan.2017,157, 14–25. [CrossRef]
28. Scholz, T.; Hof, A.; Schmitt, T. Cooling Effects and Regulating Ecosystem Services Provided by Urban Trees—Novel Analysis Approaches Using Urban Tree Cadastre Data.Sustainability2018,10, 712. [CrossRef]
29. LI-COR, Inc.LAI-2200C Plant Canopy Analyzer Instruction Manual; LI-COR, Inc.: Lincoln, NE, Lancaster, 2013;
Available online:https://www.licor.com/documents/6n3conpja6uj9aq1ruyn(accessed on 5 August 2020).
30. Budd, G.M. Wet-bulb globe temperature (WBGT)—Its history and its limitations.J. Sci. Med. Sport2008,11, 20–32. [CrossRef] [PubMed]
31. Mayer, H.; Holst, J.; Dostal, P.; Imbery, F.; Schindler, D. Human thermal comfort in summer within an urban street canyon in Central Europe.Meteorol. Z.2008,17, 241–250. [CrossRef]
32. Liaw, A.; Wiener, M. Classification and regression by randomForest.R News2002,2, 18–22.
33. Rahman, M.A.; Moser, A.; Rötzer, T.; Pauleit, S. Comparing the transpirational and shading effects of two contrasting urban tree species.Urban Ecosyst.2019,22, 683–697. [CrossRef]
34. Rahman, M.A.; Hartmann, C.; Moser-Reischl, A.; von Strachwitz, M.F.; Paeth, H.; Pretzsch, H.;
Pauleit, S.; Rötzer, T. Tree cooling effects and human thermal comfort under contrasting species and sites.Agric. For. Meteorol.2020,287, 107947. [CrossRef]
35. Golden, J.S.; Carlson, J.; Kaloush, K.E.; Phelan, P. A comparative study of the thermal and radiative impacts of photovoltaic canopies on pavement surface temperatures.Sol. Energy2007,81, 872–883. [CrossRef]
36. Rahman, M.A.; Moser, A.; Rötzer, T.; Pauleit, S. Within canopy temperature differences and cooling ability of Tilia cordata trees grown in urban conditions.Build. Environ.2017,114, 118–128. [CrossRef]
37. Duursma, R.A.; Barton, C.V.; Lin, Y.-S.; Medlyn, B.E.; Eamus, D.; Tissue, D.T.; Ellsworth, D.S.; McMurtrie, R.E.
The peaked response of transpiration rate to vapour pressure deficit in field conditions can be explained by the temperature optimum of photosynthesis.Agric. For. Meteorol.2014,189, 2–10. [CrossRef]
38. Sanusi, R.; Johnstone, D.; May, P.; Livesley, S.J. Street orientation and side of the street greatly influence the microclimatic benefits street trees can provide in summer.J. Environ. Qual. 2016,45, 167–174. [CrossRef]
[PubMed]
39. Peper, P.J.; McPherson, E.G.; Mori, S.M. Equations for predicting diameter, height, crown width, and leaf area of San Joaquin Valley street trees.J. Arboric.2001,27, 306–317.
40. Sæbø, A.; Benedikz, T.; Randrup, T.B. Selection of trees for urban forestry in the Nordic countries.Urban For.
Urban Green.2003,2, 101–114. [CrossRef]
©2020 by the authors. Licensee MDPI, Basel, Switzerland. This article is an open access article distributed under the terms and conditions of the Creative Commons Attribution (CC BY) license (http://creativecommons.org/licenses/by/4.0/).