plants
Article
Identification of Bioactive Phytochemicals in Leaf Protein Concentrate of Jerusalem Artichoke
(Helianthus tuberosus L.)
LászlóKaszás1, Tarek Alshaal1,2,* , Hassan El-Ramady1,2, Zoltán Kovács1, Judit Koroknai1, Nevien Elhawat1,3,Éva Nagy1, Zoltán Cziáky4 , Miklós Fári1andÉva Domokos-Szabolcsy1
1 Department of Agricultural Botany, Plant Physiology and Biotechnology (MEK), Debrecen University, Böszörményi Street 138, 4032 Debrecen, Hungary; kaszas.laszlo@agr.unideb.hu (L.K.);
ramady2000@gmail.com (H.E.-R.); kovacs.zoltan@agr.unideb.hu (Z.K.); koroknaij@agr.unideb.hu (J.K.);
nevienelhawat@gmail.com (N.E.); nagyeva0116@gmail.com (É.N.); fari@agr.unideb.hu (M.F.);
szabolcsy@agr.unideb.hu (É.D.-S.)
2 Soil and Water Department, Faculty of Agriculture, Kafrelsheikh University, Kafr El-Sheikh 33516, Egypt
3 Department of Biological and Environmental Sciences, Faculty of Home Economic, Al-Azhar University, Tanta 31732, Egypt
4 Agricultural and Molecular Research and Service Institute, University of Nyíregyháza, 4407 Nyíregyháza, Hungary; cziaky.zoltan@nye.hu
* Correspondence: alshaaltarek@gmail.com; Tel.:+36-2035-404-38
Received: 24 June 2020; Accepted: 13 July 2020; Published: 14 July 2020 Abstract:Jerusalem artichoke (JA) is widely known to have inulin-rich tubers. However, its fresh aerial biomass produces significant levels of leaf protein and economic bioactive phytochemicals.
We have characterized leaf protein concentrate (JAPC) isolated from green biomass of three Jerusalem artichoke clones, Alba, Fuseau, and Kalevala, and its nutritional value for the human diet or animal feeding. The JAPC yield varied from 28.6 to 31.2 g DM kg−1green biomass with an average total protein content of 33.3% on a dry mass basis. The qualitative analysis of the phytochemical composition of JAPC was performed by ultra-high performance liquid chromatography-electrospray ionization-Orbitrap/mass spectrometry analysis (UHPLC-ESI-ORBITRAP-MS/MS). Fifty-three phytochemicals were successfully identified in JAPC. In addition to the phenolic acids (especially mono- and di-hydroxycinnamic acid esters of quinic acids) several medically important hydroxylated methoxyflavones, i.e., dimethoxy-tetrahydroxyflavone, dihydroxy-methoxyflavone, hymenoxin, and nevadensin, were detected in the JAPC for the first time. Liquiritigenin, an estrogenic-like flavanone, was measured in the JAPC as well as butein and kukulkanin B, as chalcones. The results also showed high contents of the essential amino acids and polyunsaturated fatty acids (PUFAs; 66-68%) in JAPC. Linolenic acid represented 39–43% of the total lipid content; moreover, the ratio between ω-6 andω-3 fatty acids in the JAPC was ~0.6:1. Comparing the JA clones, no major differences in phytochemicals, fatty acid, or amino acid compositions were observed. This paper confirms the economic and nutritional value of JAPC as it is not only an alternative plant protein source but also as a good source of biological valuable phytochemicals.
Keywords: circular economy; green biorefinery; polyunsaturated fatty acids; phytochemicals; amino acids; food and feed; UHPLC-ESI-ORBITRAP-MS/MS
1. Introduction
The global protein demand continuously grows as the world population exponentially increases.
In Europe, the increasing protein dependency particularly obtained from soybean has triggered an
Plants2020,9, 889; doi:10.3390/plants9070889 www.mdpi.com/journal/plants
urgent need for alternative production systems. Locally grown green biomass crops represent an alternative protein source. Due to high green biomass yield and regrown capacity, clover, alfalfa, and grasses are the most common and prospective plant species for leaf protein isolate. However, digestion of green biomass by monogastric animals is difficult because of its high fiber content [1].
Green biorefinery is a complex processing system with a dedicated goal of making a commercially viable production system of added-value protein based on green biomass [2]. Separating fresh green biomass into two fractions is a key step in the green biorefinery. The fibrous pulp contains insoluble and fiber-bound protein, while the other fraction (green juice) is soluble protein-rich [1]. Soluble proteins in green juice can be precipitated by different techniques. Recovered protein concentrate is separated from brown juice fraction by filtration. Moreover, the quality of leaf protein concentrate as a main product is very important. Based on extended qualitative and quantitative analysis, alfalfa leaf protein concentrate can be directed towards feed and/or food [3,4]. However, besides the well-known herbaceous species, a range of agro-industrial crops is constantly expanding, which can be utilized in the green biorefinery [5].
Jerusalem artichoke (JA), a perennial plant, belongs to the Asteraceae family. Cultivation of JA has many advantages as it is tolerant to biotic stress, i.e., pests and diseases [6]. It can grow normally in a wide range of soils including salt-affected soil, sandy soil, and marginal lands with nearly zero levels of fertilization [7–9]. Moreover, it showed potential resistance to drought, frost, and high temperatures [10].
It yields a huge green biomass almost 120 tons ha−1fresh mass [11]. These aspects are important when avoiding competition with food production on arable lands. The recognized nutritional value of JA is mainly due to the high inulin and fructose contents in its tubers, which additionally contain protein, nutrients, and vitamins [12]. Additionally, JA is well-known as multipurpose use crop where its aerial part has attracted the interest of many researchers, firstly, concerning bioenergy production due to its high lignocellulosic content, high biomass yield, and low inputs [6]. Among the phytochemicals, sesquiterpene lactones, phenolic acids, flavone glucosides (kaempferol 3-O-glucoside and quercetin 7-O-glucoside), chlorophylls, and carotenoids have been described by several authors in the whole plant or different organs such as tubers, leaves, or flowers [13–19]. These isolated phytochemicals are known as potential anticancer, antidiabetic, antioxidant, antifungal, and antimicrobial in addition to their other medical uses [13,17].
Despite green leafy shoot of JA can be utilized directly as fresh forage, silage, or food pellets for animal feeding [9,12], most of the animal species do not prefer it because of trichome-rich leaves and stems [8]. Considering its high green biomass, regeneration capacity, and chemical composition, leafy shoots of JA can be alternatively used in the green biorefinery practice; however, there is a shortage of knowledge in this area [20].
The objectives of the present work were to produce and characterize the biological value of JAPC originating from the green biomass of JA. We aimed to provide detailed insights into the extraction efficiency and biochemical composition of JAPC. Therefore, three clones of JA representing different climatic zones were grown under low input conditions in Hungary. In addition to total protein, amino acid composition, and fatty acids profile the biochemical composition and qualitative determination of phytochemicals in the JAPCs from these clones were measured using ultra-high performance liquid chromatography-electrospray ionization-Orbitrap/mass spectrometry analysis (UHPLC-ESI-ORBITRAP-MS/MS).
2. Materials and Methods
2.1. Experimental Installation
A field experiment was conducted in 2016 at the Horticultural Demonstration garden of the University of Debrecen, Hungary (47◦330N; 21◦360E). Three different clones of JA (i.e., Alba, Fuseau, and Kalevala) were compared for their fresh aerial biomass, phytochemical content, and biochemical traits of the JAPC, under low input conditions. Tubers of JA clones representing three climatic zones
Plants2020,9, 889 3 of 17
were obtained from different sources as follows: Alba was obtained from a Hungarian market; Fuseau was obtained from Ismailia, Egypt; and Kalevala was obtained from Helsinki, Finland. The experiment was set up in a randomized complete block design with six replicates. The area of the experimental plot was 0.8×0.6 m2; the row was 3.5 m in length and 0.8 m in width, and within-row spacing was 0.6 m.
The cultivation of the JA clones started on 5 April 2016, using identically sized tubers (60–80 g/tuber).
Neither irrigation nor fertilization was applied. The chemical characteristics of the experimental soil were as follows: total N (555±2 mg kg−1); total P (6793±17 mg kg−1); total K (1298±7 mg kg−1); and humus (1.9%±0.02%).
2.2. Harvest of Above-Ground Biomass
Due to the ability of JA plants to regrow, the green biomass of the three clones was harvested twice during the growing season, when young shoots reached 1.3–1.5 m in height from the soil surface.
The first harvest was conducted on 27 June 2016, and the second on 8 August 2016. The fresh yield of the aerial parts was measured.
2.3. Fractionation of Harvested Green Biomass
The harvest of JA plants was conducted early in the morning and they were immediately transferred to the laboratory in an icebox to prevent the chemical compounds from degrading. The plants were harvested 15–20 cm above the soil surface. A 1 kg harvest of green biomass was mechanically pressed and pulped using a twin-screw juicer (Green Star GS 3000, Toronto, ON, Canada) in three replicates.
Thereafter, the green juice was thermally coagulated at 80◦C in one step to obtain the JAPC. The JAPC was separated from the brown-colored liquid fraction using cloth filtration. Both the fresh and dry masses of the JAPC were measured before it was lyophilized using an Alpha 1–4 LSC Christ lyophilizer.
2.4. Biochemical Composition of JAPC
2.4.1. Crude Protein Content
The total protein content of the JAPC was measured as total N content using the Kjeldahl method [21]. Briefly, 1 g lyophilized sample was weighed in a 250 mL Kjeldahl digestion tube, then 15 mL concentrated sulfuric acid (99%, VWR Ltd., Debrecen, Hungary) and two catalyst tablets were added. The Kjeldahl digestion tubes were placed in a Tecator Digestor (VELT, VWR Ltd, Debrecen, Hungary) at 420◦C for 1.5 h. The total N content in the digested samples was measured by titration and calculated based on the weight of the titrated solution and the sample weight. The total protein content of the sample was calculated using the following equation: Total protein %=total N content×6.25.
2.4.2. Quantification of Amino Acid Composition in JAPC Using an Amino Acid Analyzer
Lyophilized and ground samples of JAPC were digested with 6 M HCl at 110◦C for 23 h. Since the digested sample was designed to contain at least 25 mg N, the measured weights of the samples were variable. Alternating application of inert gas and a vacuum using a three-way valve was conducted to remove air. Following hydrolysis, the sample was filtered into an evaporator flask and the filtrate was evaporated under 60◦C to achieve a syrup-like consistency. Thereafter, distilled water was added to the sample and evaporation was conducted twice more under the same conditions. The evaporated sample was washed with citrate buffer pH 2.2. For the analysis of amino acid composition an INGOS AAA500 (Ingos Ltd., Prague, Czech Republic) amino acid analyzer was used. The separation was based on ionic exchange chromatography with post-column derivatization of ninhydrin. A UV/VIS detector was used at 440/570 nm.
2.4.3. Determination of Fatty Acid Composition in JAPC Using Gas Chromatography
The esterification of fatty acids in the JAPC fraction into methyl esters was conducted using a sodium methylate catalyst. Lyophilized homogeneous sample (70 mg) was weighed into a 20 mL tube;
3 mL of n-hexane, 2 mL of dimethyl carbonate and 1 mL of sodium methylate in methanol were added.
The contents of the test tube were shaken for 5 min (Janke and Kunkel WX2) and then 2 mL of distilled water was added before the tube was shaken again. The samples were centrifuged at 3000 rpm for 2 min (Heraeus Sepatech, UK). A 2.0 mL sample of supernatant (hexane phase) was transferred into a container through filter paper, which contained anhydrous sodium sulfate. The prepared solution contained approximately 50–70 mg cm−3 fatty acid methyl ester (FAME) and was suitable for analysis by gas chromatography. Gas chromatography was performed using an Agilent 6890 N coupled to an Agilent flame ionization detector. A Supelco Omegawax capillary column (30 m, 0.32 mm i.d., 0.25µm film thickness) was used to separate FAMEs. The oven temperature was 180◦C and the total analysis time was 36 min. An Agilent 7683 automatic split/splitless injector was used with an injector temperature of 280◦C and a 100:1 split ratio. The injection volume was 1µL. The carrier gas was hydrogen with a flow rate of 0.6 mL min−1 and the makeup gas was N with a flow rate of 25.0 mL min−1. The components were identified from retention data and standard addition.
2.5. Screening of Phytochemicals in JAPC by UHPLC-ESI-ORBITRAP-MS/MS 2.5.1. Sample Preparation
To prepare the hydro-alcoholic extracts, 0.5 g ground JAPC powder was extracted with 25 mL methanol:water solution. The mixture was stirred at 150 rpm for 2 h at room temperature.
The hydro-alcoholic extracts were filtered using a 0.22µm PTFE syringe filter.
2.5.2. UHPLC-ESI-ORBITRAP-MS/MS Analysis
Phytochemical analyses were performed using UHPLC-ESI-ORBITRAP-MS/MSwith a Dionex Ultimate 3000RS UHPLC system (Thermo Fisher, Waltham, MA, USA) coupled to a Thermo Q Exactive Orbitrap hybrid mass spectrometer equipped with a Thermo Accucore C18 analytical column (2.1 mm
×100 mm, 2.6µm particle size). The flow rate was maintained at 0.2 mL/min and the column oven temperature was set to 25◦C±1◦C. The mobile phase consisted of methanol (A) and water (B) (both acidified with 0.1% formic acid). The gradient program was as follows: 0–3 min, 95% B; 3–43 min, 0%
B; 43–61 min, 0% B; 61–62 min, 95% B; and 62–70 min, 95% B. The injection volume was 2µL.
2.5.3. Mass Spectrometry Conditions
A Thermo Q Exactive Orbitrap hybrid mass spectrometer (Thermo Fisher, Waltham, MA, USA) was equipped with an ESI source. The samples were measured in both positive and negative ionization modes separately. The capillary temperature was 320◦C and spray voltages were 4.0 kV in positive ionization mode and 3.8 kV in negative ionization mode, respectively. The resolution was 35,000 for MS1 scans and 17,500 for MS2 scans. The scanned mass interval was 100–1500m/z. For the tandem MS (MS/MS) scans, the collision energy was set to 30 nominal collision energy units. The difference between measured and calculated molecular ion masses was less than 5 ppm in each case. The data were acquired and processed using Thermo Trace Finder 2.1 software based on own and internet databases (Metlin, Mass Bank of North America,m/zCloud). After processing, the results were manually checked using Thermo Xcalibur 4.0 software (ThermoFisher, Waltham, MA, USA).
2.6. Quality Assurance of Results
The glass- and plastic-ware used for analyses were usually new and were cleaned by soaking in 10% (v/v) HNO3for a minimum of 24 h, followed by thorough rinsing with distilled water. All chemicals were analytical reagent grade or equivalent analytical purity. All equipment was calibrated, and uncertainties were calculated. Internal and external quality assurance systems were applied at the Central Laboratory of the University of Debrecen, according to MSZ EN ISO 5983-1: 2005 (for Total N), and the Bunge Private Limited Company Martf ˝u Laboratory, according to MSZ 190 5508: 1992 (for fatty acid composition).
Plants2020,9, 889 5 of 17
2.7. Statistical Analysis
Before the ANOVA test, Levene’s Test for Equality of Variances was performed. The Levene’s test for different variables at all treatments was negative,p<0.05, showing homogeneity of the variances.
The experimental design was established as a randomized complete block design with six replicates.
The data obtained from the experiments were subjected to one-way ANOVA by ‘R-Studio’ software and the means were compared by Duncan’s Multiple Range Test atp<0.05 [22].
3. Results
3.1. Green Biomass of Jerusalem Artichoke Clones
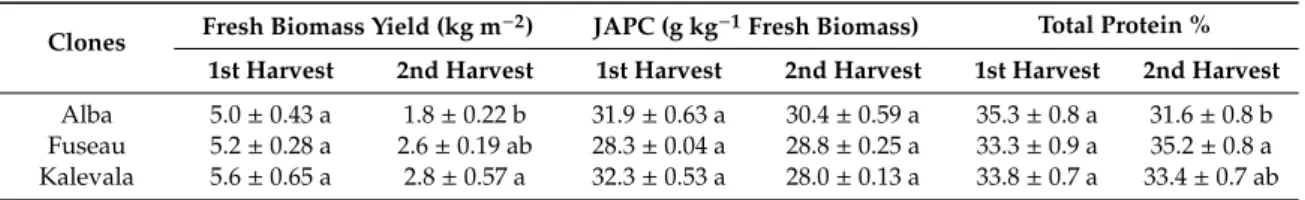
The yield of the aerial fresh biomass of different JA clones is presented in Table1. Clones displayed almost the same fresh biomass yield. Hence, no significant differences among the clones (i.e., Alba, Fuseau, and Kalevala) were noticed, especially during the first harvest. The harvest time largely influenced the yield. The average fresh biomass yield was approximately 5.3 kg m−2for the first harvest, while for the second harvest the yield was significantly reduced to 2.4 kg m−2(Table1).
The total aerial fresh biomass yield—as an average—was estimated to be 7.7 kg m−2.
Table 1.Aerial fresh biomass, dry mass, and total protein content of Jerusalem artichoke leaf protein concentrate (JAPC) isolated from green biomass of different clones.
Clones Fresh Biomass Yield (kg m−2) JAPC (g kg−1Fresh Biomass) Total Protein % 1st Harvest 2nd Harvest 1st Harvest 2nd Harvest 1st Harvest 2nd Harvest Alba 5.0±0.43 a 1.8±0.22 b 31.9±0.63 a 30.4±0.59 a 35.3±0.8 a 31.6±0.8 b Fuseau 5.2±0.28 a 2.6±0.19 ab 28.3±0.04 a 28.8±0.25 a 33.3±0.9 a 35.2±0.8 a Kalevala 5.6±0.65 a 2.8±0.57 a 32.3±0.53 a 28.0±0.13 a 33.8±0.7 a 33.4±0.7 ab
Means followed by different letters in the same column show significant differences according to Duncan’s test at p<0.05.
3.2. JAPC Yield
The yield of JAPC, extracted using thermal coagulation, from 1 kg fresh green biomass of the JA clones is displayed in Table1. No significant differences were seen between the JA clones in either the first or the second harvests. The JAPC yield ranged from 28.3 (Fuseau) to 32.3 (Kalevala) g kg−1fresh biomass for the first harvest, while for the second harvest it varied from 28 (Kalevala) to 30.4 (Alba) g kg−1fresh biomass (Table1). However, the results showed that the average JAPC dry yield from the first and second harvests was 30.8 and 29.1 g kg−1fresh biomass, respectively. Therefore, 1 kg of green biomass of JA was estimated to yield approximately 30 g JAPC dry mass as an annual average.
3.3. Total Protein Content of JAPC
The total protein content (m/m%) of JAPC generated from fresh green biomass of JA clones ranged between 33.3 m/m% (Fuseau) and 35.3 m/m% (Alba) in the first harvest, while in the second, it varied from 31.6 m/m% (Alba) to 35.2 m/m% (Fuseau). Statistically, no significant differences were calculated either between the clones or harvests (Table1). The average total protein content in the first harvest was 34.1 m/m% and 33.4 m/m% in the second based on the dry weight. The annual average total protein content of the JAPC extracted from the JA fresh biomass was estimated to be 33.8 m/m% (Table1).
3.4. Amino Acid Composition of JAPC
The amino acid composition of the JAPC obtained from the green biomass of the JA clones is presented in Table2. Essential amino acids (i.e., lysine, histidine, isoleucine, leucine, phenylalanine, methionine, threonine, and valine) play a major nutritional role in feed; therefore, they are of special interest. Among the investigated JA clones, Kalevala displayed the highest content of five essential amino acids (i.e., phenylalanine, histidine, isoleucine, threonine, and valine). Additionally, the content
of aspartic acid, glycine, glutamic acid, proline, and serine was the highest in Kalevala, with values of 4.23, 2.13, 4.82, 2.20, and 1.90 m/m%, respectively (Table2). Lysine is particularly important in animal feed and its content in Alba, Fuseau, and Kalevala ranged between 2.19 and 2.32 m/m% in the first harvest. Lysine content in the clones was similar regardless of the harvest time with higher value in the second harvest (2.35–2.54 m/m%) than the first harvest. Methionine is another limiting essential amino acid. The methionine content in Alba and Fuseau clones ranged between 0.82 and 0.95 m/m% in both harvests (Table2). A reduction in methionine content was found in the second harvest for all clones except Fuseau.
Table 2.Amino acid profile (m/m%) of Jerusalem artichoke leaf protein concentrate (JAPC) extracted from green biomass of different clones.
Amino Acid 1st Harvest 2nd Harvest
Alba Fuseau Kalevala Alba Fuseau Kalevala
Lysine 2.32±0.02‡a 2.19±0.02 c 2.25±0.02 b 2.35±0.03 c 2.54±0.01 a 2.46±0.02 b Histidine 0.80±0.20 a 0.71±0.01 b 0.83±0.03 a 0.72±0.02 c 0.76±0.02 b 0.82±0.02 a Isoleucine 1.72±0.03 a 1.64±0.02 b 1.77±0.02 a 1.72±0.02 bc 1.86±0.02 a 1.78±0.02 ab
Leucine 3.25±0.05 b 3.08±0.02 c 3.31±0.01 a 3.19±0.02 b 2.46±0.02 c 3.30±0.10 a Phenylalanine 2.12±0.02 b 1.96±0.02 c 2.19±0.01 a 2.03±0.03 b 2.20±0.10 a 2.18±0.02 a Methionine 0.87±0.03 a 0.84±0.02 a 0.79±0.03 b 0.82±0.02 b 0.95±0.01 a 0.77±0.02 c Threonine 1.96±0.01 b 1.87±0.02 c 2.33±0.03 a 1.95±0.02 c 2.12±0.02 b 2.33±0.03 a
Valine 2.05±0.05 a 2.02±0.02 a 2.06±0.02 a 2.10±0.02 b 2.34±0.01 a 2.09±0.01 b Alanine 2.36±0.05 a 2.20±0.10 b 2.35±0.02 a 2.32±0.02 b 2.47±0.02 a 2.34±0.02 b Arginine 2.08±0.04 a 1.88±0.02 b 1.86±0.01 b 1.87±0.02 c 1.97±0.02 b 2.21±0.01 a Aspartic acid 3.81±0.01 b 3.63±0.03 c 4.23±0.03 a 3.89±0.02 b 4.23±0.03 a 4.24±0.04 a Cysteine 0.24±0.02 a 0.22±0.02 a 0.22±0.02 a 0.24±0.02 ab 0.26±0.02 a 0.23±0.03 bc
Glycine 2.04±0.04 b 1.93±0.03 c 2.13±0.01 a 1.99±0.01 b 2.14±0.01 a 2.14±0.02 a Glutamic acid 4.29±0.01 bc 4.14±0.02 c 4.82±0.02 a 4.38±0.02 c 4.74±0.02 b 4.79±0.02 a Proline 1.92±0.03 b 1.82±0.02 c 2.20±0.10 a 2.04±0.02 b 2.18±0.01 a 2.19±0.01 a Serine 1.74±0.04 b 1.67±0.02 b 1.90±0.10 a 1.77±0.02 c 1.89±0.01 b 1.93±0.01 a Tyrosine 1.48±0.02 a 1.38±0.02 c 1.46±0.02 ab 1.42±0.02 c 1.61±0.01 a 1.55±0.01 b Ammonia 0.49±0.01 ab 0.47±0.02 b 0.52±0.02 a 0.52±0.02 a 0.48±0.02 b 0.54±0.02 a
‡Standard deviation. Means followed by different letters in the same row and same harvest show significant differences according to Duncan’s test atp<0.05.
3.5. Qualitative Analysis of JAPC Fatty Acid Composition
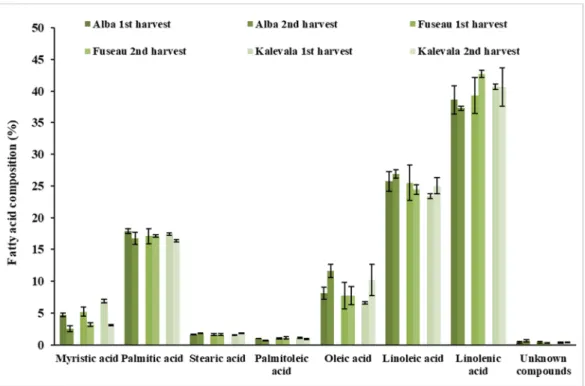
Both saturated (SFA) and unsaturated fatty acids (UFA) were detected in the JAPC. Polyunsaturated fatty acids (PUFA) including linoleic acid (C18:2ω–6) and linolenic acid (C18: 3ω–3) predominated (66%–68%) in all of the JA clones (Figures1and2). Among these fatty acids, linolenic acid (38.6%–42.7%) exhibited a narrow range of content that was present in the highest amount regardless of harvest time or clone. Linoleic acid was present in the second-highest concentration, at a minimum of 23.4% in the first harvest JAPC of Kalevala and a maximum of 26.9% in the second harvest JAPC of Alba. All of the analyzed JAPC samples exhibited a low concentration of unknown fatty acid, which comprised 0.3–0.6% of the total fatty acid content (Figure1). Among the monounsaturated fatty acids (MUFAs), oleic acid (C18:1ω–9) was detected at a high value (6.6–11.6%), whereas the content of palmitoleic acid (C16:1ω–7) was significantly lower and ranged from 0.7% to 1.1% (Figure1). The saturated fatty acids (SFA), myristic acid (C14:0), palmitic acid (C16:0), and stearic acid (C18:0) were also identified.
Palmitic acid was the most abundant saturated component with no significant differences (16.4–17.9%) either between clones or time of harvest. The percent composition of myristic acid (2.5–6.9%) and stearic acid (1.5–1.8%) in the JAPC fractions were markedly lower than that of palmitic acid. Opposing tendencies were found for the oleic and myristic acid contents between the first and second harvests.
The myristic acid content in JAPC was higher in the first harvest in all the three JA clones, while the oleic acid content was higher in the second harvest JAPC of Alba and Kalevala (Figure1).
Plants2020,9, 889 7 of 17
Plants 2020, 9, x FOR PEER REVIEW 7 of 17
Figure 1. Fatty acid composition (%) of Jerusalem artichoke leaf protein concentrate (JAPC) extracted from the green biomass of three clones (Alba, Fuseau, and Kalevala).
Figure 2. Distribution of saturated fatty acids (SFA), monounsaturated fatty acids (MUFA), and polyunsaturated fatty acids (PUFA) in Jerusalem artichoke leaf protein concentrate (JAPC) extracted from the green biomass of three clones (Alba, Fuseau, and Kalevala).
3.6. Screening JAPC Phytochemicals Using UHPLC-ESI-ORBITRAP-MS/MS
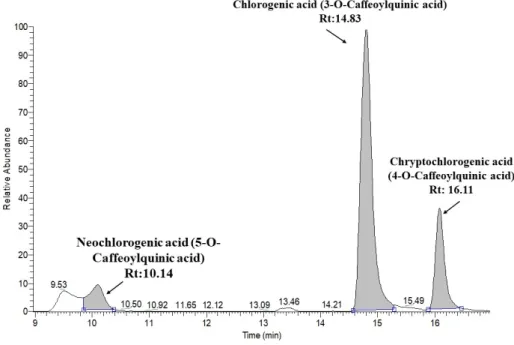
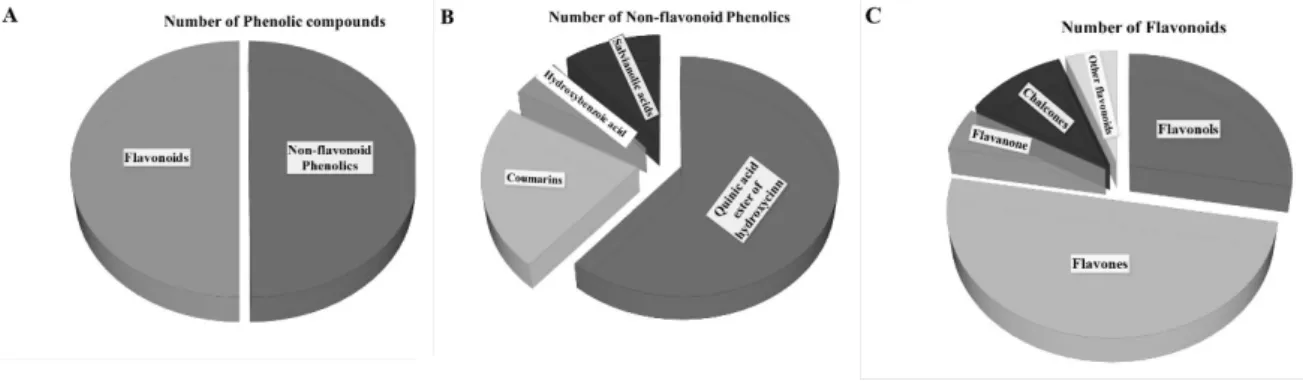
The profiles of the phytochemicals in the JAPCs isolated from the JA clones Alba, Fuseau, and Kalevala, exhibited negligible differences between them. Up to 61 phytochemicals were defined, based on specific retention time, accurate mass, isotopic distribution, and fragmentation pattern, and by screening the following MS databases: Metlin, mzCloud, MoNA-MassBank of North America, and our own database. Table 3 indicates that phenolic compounds comprised a significant component of the compounds identified. Regardless of JA clones, three caffeoylquinic acid isomers: chlorogenic acid (3-O-caffeoylquinic acid), neochlorogenic acid (5-O-caffeoylquinic acid), and cryptochlorogenic acid (4-O-caffeoylquinic acid), respectively, were identified in the JAPCs with a characteristic [M−H]− ion at m/z 353.0873. Considering the area of the peak of extracted ion chromatogram of isomers the 3-O-caffeoylquinic acid is the dominant one, while a lower ratio of neochlorogenic acid (5-O- caffeoylquinic acid) and cryptochlorogenic acid (4-O-caffeoylquinic acid) were detected (Figure 3).
Additionally, three di-O-caffeoylquinic acid isomers ([M−H]− ion at m/z 515.1190), four coumaroylquinic acid isomers ([M−H]− ion at m/z 337.0924), and a 5-O-feruloylquinic acid ([M−H]− ion at m/z 367.1029) were identified in the hydro-alcoholic extracted JAPC. The investigation also revealed a compound with a [M−H]− ion at m/z 299.0767 in all of the JAPC extracts. The ion scan
23
%11
% 66
%
Alba
23%
68% 9%
Fuseau
24%
66% 10%
Kalevala
SFA MUFA PUFA Figure 1.Fatty acid composition (%) of Jerusalem artichoke leaf protein concentrate (JAPC) extracted from the green biomass of three clones (Alba, Fuseau, and Kalevala).
Plants 2020, 9, x FOR PEER REVIEW 7 of 17
Figure 1. Fatty acid composition (%) of Jerusalem artichoke leaf protein concentrate (JAPC) extracted from the green biomass of three clones (Alba, Fuseau, and Kalevala).
Figure 2. Distribution of saturated fatty acids (SFA), monounsaturated fatty acids (MUFA), and polyunsaturated fatty acids (PUFA) in Jerusalem artichoke leaf protein concentrate (JAPC) extracted from the green biomass of three clones (Alba, Fuseau, and Kalevala).
3.6. Screening JAPC Phytochemicals Using UHPLC-ESI-ORBITRAP-MS/MS
The profiles of the phytochemicals in the JAPCs isolated from the JA clones Alba, Fuseau, and Kalevala, exhibited negligible differences between them. Up to 61 phytochemicals were defined, based on specific retention time, accurate mass, isotopic distribution, and fragmentation pattern, and by screening the following MS databases: Metlin, mzCloud, MoNA-MassBank of North America, and our own database. Table 3 indicates that phenolic compounds comprised a significant component of the compounds identified. Regardless of JA clones, three caffeoylquinic acid isomers: chlorogenic acid (3-O-caffeoylquinic acid), neochlorogenic acid (5-O-caffeoylquinic acid), and cryptochlorogenic acid (4-O-caffeoylquinic acid), respectively, were identified in the JAPCs with a characteristic [M−H]− ion at m/z 353.0873. Considering the area of the peak of extracted ion chromatogram of isomers the 3-O-caffeoylquinic acid is the dominant one, while a lower ratio of neochlorogenic acid (5-O- caffeoylquinic acid) and cryptochlorogenic acid (4-O-caffeoylquinic acid) were detected (Figure 3).
Additionally, three di-O-caffeoylquinic acid isomers ([M−H]− ion at m/z 515.1190), four coumaroylquinic acid isomers ([M−H]− ion at m/z 337.0924), and a 5-O-feruloylquinic acid ([M−H]− ion at m/z 367.1029) were identified in the hydro-alcoholic extracted JAPC. The investigation also revealed a compound with a [M−H]− ion at m/z 299.0767 in all of the JAPC extracts. The ion scan
23
%11
% 66
%
Alba
23%
68% 9%
Fuseau
24%
66% 10%
Kalevala
SFA MUFA PUFA
Figure 2. Distribution of saturated fatty acids (SFA), monounsaturated fatty acids (MUFA), and polyunsaturated fatty acids (PUFA) in Jerusalem artichoke leaf protein concentrate (JAPC) extracted from the green biomass of three clones (Alba, Fuseau, and Kalevala).
3.6. Screening JAPC Phytochemicals Using UHPLC-ESI-ORBITRAP-MS/MS
The profiles of the phytochemicals in the JAPCs isolated from the JA clones Alba, Fuseau, and Kalevala, exhibited negligible differences between them. Up to 61 phytochemicals were defined, based on specific retention time, accurate mass, isotopic distribution, and fragmentation pattern, and by screening the following MS databases: Metlin, mzCloud, MoNA-MassBank of North America, and our own database. Table3indicates that phenolic compounds comprised a significant component of the compounds identified. Regardless of JA clones, three caffeoylquinic acid isomers: chlorogenic acid (3-O-caffeoylquinic acid), neochlorogenic acid (5-O-caffeoylquinic acid), and cryptochlorogenic acid (4-O-caffeoylquinic acid), respectively, were identified in the JAPCs with a characteristic [M−H]− ion at m/z 353.0873. Considering the area of the peak of extracted ion chromatogram of isomers the 3-O-caffeoylquinic acid is the dominant one, while a lower ratio of neochlorogenic acid (5-O-caffeoylquinic acid) and cryptochlorogenic acid (4-O-caffeoylquinic acid) were detected (Figure3). Additionally, three di-O-caffeoylquinic acid isomers ([M−H]−ion atm/z515.1190), four coumaroylquinic acid isomers ([M−H]−ion atm/z337.0924), and a 5-O-feruloylquinic acid ([M−H]− ion atm/z367.1029) were identified in the hydro-alcoholic extracted JAPC. The investigation also revealed a compound with a [M−H]−ion atm/z299.0767 in all of the JAPC extracts. The ion scan
experiment of this ion showed corresponding fragment ions atm/zvalues of 137.0233; 113.0229; 93.0331;
85.0281; and 71.0122. After comparison with the databases, this compound was identified as salicylic acid 2-O-β-d-glucoside.
Table 3.Chemical composition of Jerusalem artichoke leaf protein concentrate (JAPC) extracted from green biomass.
No. Compound Formula Retention
Time
Measured Mass (m/z)
Fragments 1 Fragments 2 Fragments 3 Fragments 4 Fragments 5 [M+H]+ [M−H]-
1 γ-Aminobutyric acid C4H9NO2 1.25 104.07116 87.0446 86.0607 69.0342 58.0658
2 Quinic acid C7H12O6 1.27 191.05557 173.0447 171.0289 127.0388 93.0331 85.0280
3 Betaine (Trimethylglycine) C5H11NO2 1.28 118.08681 59.0737 58.0659
4 Malic acid C4H6O5 1.33 133.01370 115.0024 89.0230 87.0075 72.9916 71.0123
5 Nicotinic acid (Niacin) C6H5NO2 1.51 124.03986 96.0450 80.0501 78.0347
6 Citric acid C6H8O7 1.73 191.01918 173.0082 129.0182 111.0075 87.0073 85.0280
7 Neochlorogenic acid
(5-O-Caffeoylquinic acid) C16H18O9 10.14 353.08726 191.0557 179.0344 173.0448 135.0441
8 Salicylic acid-2-O-glucoside C13H16O8 13.56 299.07670 137.0234 113.0229 93.0331 85.0280 71.0123 9 Chlorogenic acid
(3-O-Caffeoylquinic acid) C16H18O9 14.83 353.08726 191.0556 179.0344 173.0443 161.0234 135.0441 10 Cryptochlorogenic acid
(4-O-Caffeoylquinic acid) C16H18O9 16.11 353.08726 191.0555 179.0344 173.0447 161.0232 135.0441 11 4-O-(4-Coumaroyl) quinic
acid C16H18O8 16.14 337.09235 191.0555 173.0447 163.0390 119.0489 93.0331
12
Vanillin (4-Hydroxy-3-methox
ybenzaldehyde)
C8H8O3 16.22 153.05517 125.0600 111.0445 110.0366 93.0341 65.0393
13 5-O-(4-Coumaroyl)quinic
acid C16H18O8 17.38 337.09235 191.0556 173.0447 163.0391 119.0490 93.0332
14 Indole-3-acetic acid C10H9NO2 17.98 174.05551 146.0601 144.0440 130.0651 128.0492 15 4-O-(4-Coumaroyl)quinic
acid cis isomer C16H18O8 18.04 337.09235 191.0556 173.0447 163.0391 119.0489 93.0331
16
Isoscopoletin (6-Hydroxy-7-meth
oxycoumarin)
C10H8O4 18.33 193.05009 178.0264 165.0550 149.0598 137.0600 133.0287
17 5-O-Feruloylquinic acid C17H20O9 18.42 367.10291 193.0503 191.0556 173.0447 134.0362 93.0331
18 Riboflavin C17H20N4O619.03 377.14611 359.1352 243.0879 200.0824 172.0872 69.0342
19
Scopoletin (7-Hydroxy-6-meth
oxycoumarin)
C10H8O4 19.08 193.05009 178.0263 165.0546 149.0597 137.0601 133.0287
20
Azelaamic acid (9-Amino-9-oxononanoic
acid)
C9H17NO3 19.21 186.11302 125.0959 97.0647
21 6-Methylcoumarin C10H8O2 19.44 161.06026 133.0651 115.0547 105.0704 91.0547 79.0549
22 5-O-(4-Coumaroyl)quinic
acid cis isomer C16H18O8 19.63 337.09235 191.0555 173.0446 163.0390 119.0491 93.0330
23 Indole-4-carbaldehyde C9H7NO 19.67 146.06059 118.0655 117.0574 91.0548
24 Fraxidin or Isofraxidin C11H10O5 19.72 221.04500 206.0219 190.9983 163.0030
25 Loliolide C11H16O3 20.05 197.11777 179.1069 161.0962 135.1171 133.1015 107.0860
26
4-Hydroxy-3-meth oxycinnamaldehyde (Coniferyl aldehyde)
C10H10O3 20.59 179.07082 161.0599 147.0442 133.0652 119.0495 55.0186
27 7-Deoxyloganic acid isomer C16H24O9 22.36 359.13421 197.0815 153.0909 135.0805 109.0643 89.0230 28 Di-O-caffeoylquinic acid
isomer 1 C25H24O12 22.61 515.11896 353.0884 191.0556 179.0342 173.0447 135.0441
29 Di-O-caffeoylquinic acid
isomer 2 C25H24O12 22.77 515.11896 353.0884 191.0556 179.0342 173.0446 135.0440
30 Salvianolic acid derivative
isomer 1 C27H22O12 22.80 537.10331 375.0705 201.0165 179.0343 161.0234 135.0440
31 Butein (20,3,4,40-Tetrah
ydroxychalcone) C15H12O5 23.00 273.07630 255.0656 227.0699 209.0602 163.0391 137.0235 32 Quercetin-3-O-glucuronide C21H18O13 23.26 477.06692 301.0359 178.9980 163.0028 151.0026 121.0281 33 Isoquercitrin (Hirsutrin,
Quercetin-3-O-glucoside) C21H20O12 23.47 463.08765 301.0358 300.0283 271.0253 255.0300
34 Chrysoeriol-O-glucoside C22H22O11 23.87 461.10839 299.0560 298.0484 270.0537 255.0292 227.0346 35 Salvianolic acid derivative
isomer 2 C27H22O12 24.60 537.10331 375.0705 201.0166 179.0343 161.0236 135.0440
36 Di-O-caffeoylquinic acid
isomer 3 C25H24O12 24.62 515.11896 353.0884 191.0557 179.0342 173.0447 135.0440
Plants2020,9, 889 9 of 17
Table 3.Cont.
No. Compound Formula Retention
Time
Measured Mass (m/z)
Fragments 1 Fragments 2 Fragments 3 Fragments 4 Fragments 5 [M+H]+ [M−H]-
37 Azelaic acid C9H16O4 25.05 187.09704 169.0863 143.1070 125.0959 123.0803
38 Kaempferol-3-O-
glucuronide C21H18O12 25.18 461.07200 285.0410 229.0505 113.0231
39 Apigenin-O-
malonylglucoside C24H22O13 25.21 517.09822 473.1116 269.0461 268.0376
40 Astragalin
(Kaempferol-3-O-glucoside) C21H20O11 25.26 447.09274 285.0410 284.0331 255.0302 227.0350
41 Isorhamnetin-3-O-glucoside C22H22O12 25.48 477.10330 315.0524 314.0437 285.0406 271.0248 243.0292
42
Kukulkanin B (20,40,4-Trihydroxy-30-
methoxyxchalcone)
C16H14O5 25.50 287.09195 269.0810 241.0864 177.0548 145.0286 137.0235
43 Isorhamnetin-3-O-
glucuronide C22H20O13 25.70 491.08257 315.0517 300.0275 271.0249
44 Dihydroactinidiolide C11H16O2 27.16 181.12286 163.1119 145.1014 135.1171 121.1015 107.0860
45 Dimethoxy-
tetrahydroxyflavone C17H14O8 28.38 345.06105 330.0386 315.0153 287.0204 215.0347 178.9978 46 Dihydroxy-methoxyflavone C16H12O5 29.89 283.06065 268.0381 267.0305 240.0427 239.0350 211.0396 47 Dimethoxy-trihydr
oxyflavone isomer 1 C17H14O7 30.09 329.06613 314.0439 299.0197 283.0869 271.0247 255.0913 48 Trihydroxy-trime
thoxyflavone C18H16O8 30.36 359.07670 344.0541 329.0307 314.0075 301.0358 286.0129
49 Dimethoxy-trihyd
roxyflavone isomer 2 C17H14O7 30.38 329.06613 314.0439 299.0201 283.0871 271.0252 253.0763 50 Liquiritigenin (40,7-
Dihydroxyflavanone) C15H12O4 30.56 255.06574 153.0183 135.0077 119.0489 91.0175
51
Hymenoxin (5,7,Dihydroxy-30,40, 6,8-tetramethoxyflavone)
C19H18O8 32.11 375.10800 360.0840 345.0606 342.0736 330.0367 317.0659
52 Epiafzelechin trimethyl
ether C18H20O5 33.32 317.13890 167.0704 163.0755 155.0705 137.0598 121.0651
53
Nevadensin (5,7-Dihydroxy-40, 6,8-trimethoxyflavone)
C18H16O7 33.91 345.09743 330.0736 315.0501 312.0631 287.0554
Plants 2020, 9, x FOR PEER REVIEW 8 of 17
experiment of this ion showed corresponding fragment ions at m/z values of 137.0233; 113.0229;
93.0331; 85.0281; and 71.0122. After comparison with the databases, this compound was identified as salicylic acid 2-O-β-D-glucoside.
Figure 3. Extracted ion chromatogram of chlorogenic acid structural isomers.
Table 3. Chemical composition of Jerusalem artichoke leaf protein concentrate (JAPC) extracted from green biomass.
No
. Compound Formula Retention Time
Measured Mass
(m/z) Fragment s 1
Fragment s 2
Fragment s 3
Fragment s 4
Fragment [M + s 5
H]+ [M − H]- 1 γ-Aminobutyric acid C4H9NO2 1.25 104.071
16 87.0446 86.0607 69.0342 58.0658
2 Quinic acid C7H12O6 1.27 191.055
57 173.0447 171.0289 127.0388 93.0331 85.0280
3 Betaine
(Trimethylglycine)
C5H11NO
2 1.28 118.086
81 59.0737 58.0659
4 Malic acid C4H6O5 1.33 133.013
70 115.0024 89.0230 87.0075 72.9916 71.0123 5 Nicotinic acid
(Niacin) C6H5NO2 1.51 124.039
86 96.0450 80.0501 78.0347
6 Citric acid C6H8O7 1.73 191.019
18 173.0082 129.0182 111.0075 87.0073 85.0280 7
Neochlorogenic acid (5-O-Caffeoylquinic
acid)
C16H18O9 10.14 353.087
26 191.0557 179.0344 173.0448 135.0441 8 Salicylic acid-2-O-
glucoside C13H16O8 13.56 299.076
70 137.0234 113.0229 93.0331 85.0280 71.0123 9
Chlorogenic acid (3- O-Caffeoylquinic
acid)
C16H18O9 14.83 353.087
26 191.0556 179.0344 173.0443 161.0234 135.0441
10
Cryptochlorogenic acid (4-O- Caffeoylquinic acid)
C16H18O9 16.11 353.087
26 191.0555 179.0344 173.0447 161.0232 135.0441 11 4-O-(4-Coumaroyl)
quinic acid C16H18O8 16.14 337.092
35 191.0555 173.0447 163.0390 119.0489 93.0331
12
Vanillin (4-Hydroxy- 3- methoxybenzaldehy
de)
C8H8O3 16.22 153.055
17 125.0600 111.0445 110.0366 93.0341 65.0393
13
5-O-(4- Coumaroyl)quinic
acid
C16H18O8 17.38 337.092
35 191.0556 173.0447 163.0391 119.0490 93.0332
Figure 3.Extracted ion chromatogram of chlorogenic acid structural isomers.
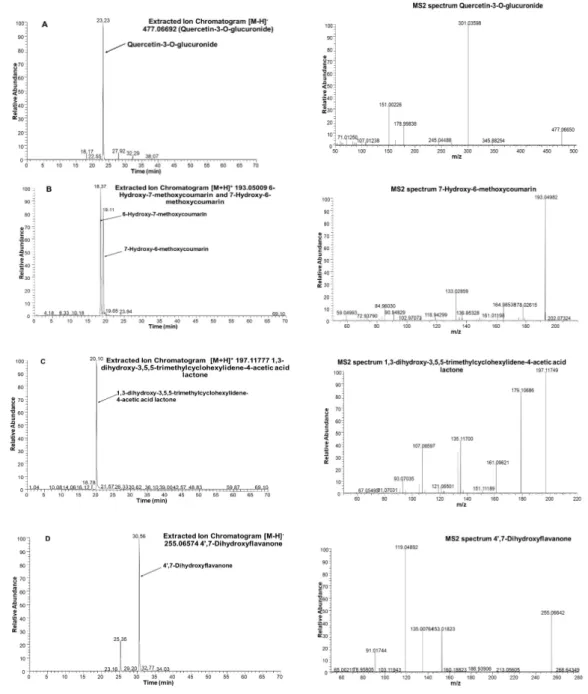
Among flavonoids, isorhamnetin-3-O-glucoside withm/z477.1033, kaempferol 3-glucuronide (kaempferol 3-O-β-d-glucopyranosiduronic acid) with m/z 461.0720, and astragaline (kaempferol 3-O-β-d-glucopyranoside) withm/z447.0927 was found in the JAPC. However, to our knowledge, this is the first time glucuronide derivatives of isorhamnetin (isorhamnetin-3-O-glucuronide) and isoquercetin (quercetin 3-O-β-d-glucopyranoside) with m/z 463.0877 (Table 3 and Figure 4) have been identified. In addition to flavonols, most of the identified flavonoids belonged
to the flavones. As far as we are aware, none of these has been identified previously in JAPC. For instance, we identified two dimethoxy-trihydroxyflavone isomers ([M−H]− ion at m/z 329.0661), dimethoxy-tetrahydroxyflavone ([M − H]− ion at m/z 345.0611), dihydroxy-methoxyflavone ([M − H]− ion at m/z 283.0607), and trihydroxy-trimethoxyflavone ([M−H]−atm/z359.0767). Hymenoxin (5,7-dihydroxy-30,40,6,8-tetramethoxyflavone) atm/z375.1080 and nevadensin (5,7-hydroxy-40,6,8-trimethoxyflavone) atm/z317.1389 were identified in positive ESI mode (Table3). Within flavonoids, Butein (20,3,4,40-tetrahydroxychalcone) and kukulkanin B (30-methoxy-20,4,40-methoxychalcone) which related to chalcones subgroup were identified. Finally, liquiritigenin (40,7-dihydroxyflavanone; [M−H]−atm/z255.0657) was the only flavanone found in this study (FigurePlants 2020, 9, x FOR PEER REVIEW 4). 11 of 17
Figure 4. Extracted Ion Chromatograms (XIC) and MS spectra of selected phytoconstituents from Jerusalem artichoke leaf protein concentrate: (A): quercetin- 3-O-glucuronide; (B): 7-Hydroxy-6- methoxycoumarin (Scopoletin); (C): 1,3-dihydroxy-3,5,5-trimethylcyclohexylidene-4-acetic acid lactone (Loliolide); and (D): 4’,7-Dihydroxyflavanone (Liquiritigenin).
4. Discussion
One important aspect of the biorefinery to become a competitive process is to produce at least one product of high value. The quantitative analysis of crude protein content of JAPC is a priority.
The protein content of JAPC is influenced by plant type and also by the processing method. The average total protein content of the JAPC produced from Alba, Fuseau, and Kalevala was 33.4 m/m%;
however, most of the isolated protein was found in the leaves, as these organs contain 3-fold higher total protein than the stem [23]. The JAPC comprised parenchyma tissues (80–87%) containing easily released cytoplasmic and chloroplast proteins such as Rubisco, which is of high nutritional value [24].
Figure 4. Extracted Ion Chromatograms (XIC) and MS spectra of selected phytoconstituents from Jerusalem artichoke leaf protein concentrate: (A): quercetin-3-O -glucuronide; (B):
7-Hydroxy-6-methoxycoumarin (Scopoletin); (C): 1,3-dihydroxy-3,5,5-trimethylcyclohexylidene -4-acetic acid lactone (Loliolide); and (D): 40,7-Dihydroxyflavanone (Liquiritigenin).
Plants2020,9, 889 11 of 17
In addition to polyphenols, three different terpenes consistently appeared in the JAPC of the JA clones. Loliolide (1,3-dihydroxy-3,5,5-trimethylcyclohexylidene-4-acetic acid lactone) is a C11 monoterpenoid lactone, which was observed with a [M+H]+ ion atm/z197.1178 (Figure4).
Dihydroactinidiolide as a volatile monoterpene with a [M+H]+ion atm/z181.1229, and 7-deoxyloganic acid isomer, an iridoid monoterpene with a [M−H]−ion atm/z359.1342, were recognized. Several proteinogenic amino acids were also identified (Table3). In terms of vitamins, vitamin B molecules such as nicotinic acid (niacin; [M+H]+ion atm/z124.0399) and riboflavin ([M+ H]+ ion atm/z 377.1461) were seen, while organic acids, i.e., malic acid and citric acid, and plant hormones such as indole acetic acid, were also identified in the JAPC.
4. Discussion
One important aspect of the biorefinery to become a competitive process is to produce at least one product of high value. The quantitative analysis of crude protein content of JAPC is a priority.
The protein content of JAPC is influenced by plant type and also by the processing method. The average total protein content of the JAPC produced from Alba, Fuseau, and Kalevala was 33.4 m/m%;
however, most of the isolated protein was found in the leaves, as these organs contain 3-fold higher total protein than the stem [23]. The JAPC comprised parenchyma tissues (80–87%) containing easily released cytoplasmic and chloroplast proteins such as Rubisco, which is of high nutritional value [24].
The time of harvest is critical to the quantity and quality of the JAPC produced from the aerial parts of the JA. Rashchenko [25] reported that the N content of older leaves is ~50% less than that in young leaves and Seiler [26] reported that the total protein content fell by 32.6% between the vegetative and flowering stages of JA growth. Knowing this, the shoots were harvested at the point of the maximum green leaf; ahead of senescence and before the bottom leaves turn dry. Ultimately, there was no significant difference in protein content between the two harvests.
In terms of an ideal protein source, the amino acid profile cannot be ignored, because among the 20 proteinogenic amino acids, nine cannot be synthesized by most animal species [20]. The content of these essential amino acids is, therefore, of particular interest. Among the green biomass fractions, the JAPC, as a dedicated protein enriched product for feed, was examined thoroughly.
Several indispensable amino acids, i.e., lysine, isoleucine, leucine, methionine, and threonine, were present in high concentrations in the JAPC. However, even higher amino acid contents were found in JAPC by Rawate and Hill [27]; this may be attributed to different extraction methods and varieties.
Additionally, the amino acid profiles exhibited minor differences between the two harvests, which may be due to differences in weather and plant age, as has previously been documented [11,25,26].
Considering the scientific literature about phytoconstituents of different JA organs, it was assumed that the green biomass-originated JAPC can be more than an alternative protein source. Qualitative analysis of phytochemicals in JAPC was performed by UHPLC-ESI-MS in both negative and positive ESI modes. The negative mode was used to identify flavonoid and phenolic acid (hydroxycinnamic acid and benzoic acid) derivatives, as it provided better sensitivity. The easy protonation of N in the positive mode made it suitable for identifying terpenes, amino acids, coumarins, and coumaroylquinic acids.
Phenolic compounds are one of the largest groups of plant secondary metabolites. Among them, phenolic acids are an important subgroup and their presence is characteristic of the Asteraceae family. The most revealed phenolic acids are the mono- and di, and even tri-hydroxycinnamic acid (p-coumaric, caffeic, and ferulic acids) esters of quinic acids in the tuber and shoot organs of JA [15,17,19]. Our measurements confirmed 13 different “phenolic acids” from green biomass originated hydro-alcoholic extracted JAPC. The three structural isomers of caffeoylquinic acid were identified with a similar degree of ionization, and the same molecular weight and fragmentation pattern. Hence, the area of the peak of extracted ion chromatogram of isomers is comparable and the 3-O-caffeoylquinic acid seemed to be the dominant one (Figure3). However, neochlorogenic acid (5-O-caffeoylquinic acid) displayed the lowest ratio. Chlorogenic acid (3-O-caffeoylquinic acid) is known as the most abundant isomer in plants, whereas cryptochlorogenic acid (4-O-caffeoylquinic