MSTO1 is a cytoplasmic pro-mitochondrial fusion protein, whose mutation induces myopathy and ataxia in humans
Aniko Gal
1,2, Peter Balicza
2, David Weaver
1, Shamim Naghdi
1, Suresh K Joseph
1, Péter Várnai
3, Tibor Gyuris
4, Attila Horváth
4, Laszlo Nagy
4, Erin L Seifert
1, Maria Judit Molnar
2&
György Hajnóczky
1,*Abstract
The protein MSTO1has been localized to mitochondria and linked to mitochondrial morphology, but its specific role has remained unclear. We identified a c.22G>A (p.Val8Met) mutation of MSTO1 in patients with minor physical abnormalities, myopathy, ataxia, and neurodevelopmental impairments. Lactate stress test and myopathological results suggest mitochondrial dysfunction. In patient fibroblasts, MSTO1 mRNA and protein abundance are decreased, mitochondria display fragmentation, aggregation, and decreased network continuity and fusion activity. These character- istics can be reversed by genetic rescue. Short-term silencing of MSTO1in HeLa cells reproduced the impairment of mitochondrial morphology and dynamics observed in the fibroblasts without damaging bioenergetics. At variance with a previous report, we find MSTO1to be localized in the cytoplasmic area with limited colocalization with mitochondria. MSTO1interacts with the fusion machinery as a soluble factor at the cytoplasm-mitochondrial outer membrane interface. After plasma membrane permeabiliza- tion, MSTO1 is released from the cells. Thus, an MSTO1 loss-of- function mutation is associated with a human disorder showing mitochondrial involvement. MSTO1 likely has a physiologically relevant role in mitochondrial morphogenesis by supporting mito- chondrial fusion.
Keywordsmisato; mitochondria; mitochondrial disease; mitochondrial fusion;
MSTO1
Subject Categories Genetics, Gene Therapy & Genetic Disease; Metabolism DOI10.15252/emmm.201607058| Received13September2016| Revised13 April2017| Accepted21April2017| Published online29May2017 EMBO Mol Med (2017)9:967–984
Introduction
Mitochondria are highly dynamic organelles whose morphology, distribution, and activity are dependent on fusion and fission (Chan, 2006). Several neurodegenerative diseases such as optic atrophy, Charcot–Marie–Tooth, Alzheimer’s, Parkinson, and Huntington disease are associated with alterations of mitochondrial dynamics (Chan, 2006; Itohet al, 2013).
MSTO1 (Misato) is an evolutionarily conserved nuclear DNA- encoded protein showing some structural similarity to eukaryotic tubulins and prokaryotic FtsZ. Null mutations of the misato in Drosophila are associated with irregular chromosomal segregation (Mikloset al, 1997; Gurvitzet al, 2002; Mottier-Pavieet al, 2011).
However, depletion of MSTO1 by siRNA was also linked to mito- chondrial fragmentation and cell death, and overexpressed EGFP- Misato was localized in the mitochondria and was shown to induce aggregation of mitochondria at the perinuclear region and cell death in HeLa cells (Kimura & Okano, 2007). In this study, MSTO1 was proposed to contribute to the cell’s health as an outer mitochondrial membrane (OMM) resident affecting mitochondrial morphology.
However, the mechanism by which MSTO1 supports mitochondrial morphogenesis and its potential human disease relevance remains elusive.
Disorders with primary mitochondrial dysfunction are clinically heterogeneous disorders that can manifest at any age, and can affect multiple tissues and organs, commonly the most energy demanding tissues, such as the central nervous system, skeletal and cardiac muscle, liver, endocrine glands, kidney, and the eyes. Mitochondrial diseases can result from mutations of genes located in either the nuclear DNA or the maternally inherited mitochondrial DNA. Until now, based on the relevant databases (Mitomap, MitoMiner, NCBI, Nexprot), approximately 300 different mtDNA pathogenic mutations have been found. The collection of nuclear genes encoding mito- chondrial proteins is still changing, and only a few hundred
1 MitoCare Center for Mitochondrial Imaging Research and Diagnostics, Department of Pathology, Anatomy and Cell Biology, Thomas Jefferson University, Philadelphia, PA, USA
2 Institute of Genomic Medicine and Rare Disorders, Semmelweis University, Budapest, Hungary 3 Department of Physiology, Semmelweis University, Budapest, Hungary
4 Department of Biochemistry and Molecular Biology, University of Debrecen, Debrecen, Hungary
*Corresponding author. Tel: +1 215 503 1427; E-mail: gyorgy.hajnoczky@jefferson.edu
disease-associated mutations of these genes have been identified.
The minimum prevalence of all mitochondrial disorders is 1:2,000 (Suomalainen, 2015), but with the recent progress in identification of the mitochondrial proteins and the progress in genetic diagnosis, the number of human disease-associated mutations is expected to steeply increase.
In this study, we have identified an MSTO1 mutation in patients by whole-exome sequencing. This mutation segregated in the affected family and is absent in the other sequenced cases. Members of the affected family showed a diverse collection of the following alterations: severe myopathy, hypoacusis, endocrine dysfunctions, and psychiatric symptoms. These symptoms and laboratory tests indicate a possible role for the newly foundMSTO1mutation in the background of mitochondrial disorders. Therefore, we have investi- gated mitochondrial dynamics and bioenergetics in both patient- derived cells and cell lines using genetic rescue and gene silencing, respectively. Collectively, our studies suggest that MSTO1 is a cyto- plasmic protein required for mitochondrial fusion and network formation and its loss likely causes a multisystem disorder.
Results
Clinical data
Patient1(I/1) (Fig1A)
A 53-year-old Hungarian female patient’s symptoms started at the age of 38 with myalgia, weakness of the small hand muscles, and cognitive dysfunction. She was born as an immature, small baby from an overdue pregnancy. Her III digit on the foot was absent.
Her motor and verbal development was delayed. Her bone age was also delayed. She had joint hyperlaxity and generalized lipomatosis.
Presently, she has hyperthyroidism; mitral and tricuspidal insuffi- ciency. Neurological examination revealed short stature (150 cm), micrognathia with small close-set eyes, myopia, myopathic face, bilateral hypoacusis, moderate atrophy of the small muscles of the hands and feet, pes varus. She had mild weakness in the distal muscles of the extremities. Deep tendon reflexes were decreased;
pyramidal tract signs were not present. She had distal type hypaes- thesia in the limbs. Mild truncal and upper limb ataxia and dysdi- adochokinesis were present. She had anxiety and depressed mood.
Her brain MRI detected frontal atrophy and enlarged interhemi- spheric fissure and EMG showed myopathy. CK was in normal range. The resting serum lactate level was normal, while the lactate stress test indicated altered aerobic metabolism (resting lactate:
1.7 mmol/l (normal range: 1.0–2.0 mmol/l), after 15 min bicycling 0 min: 6.5 mmol/l, 5 min: 4.8 mmol/l, 15 min: 4.2 mmol/l, 30 min: 3.5 mmol/l (normal if the lactate level after 30 min exercise is less than twofold of the resting value)). Decreased vitamin D3 was measured (13.0 ng/ml, normal range 23.0–60.0 ng/ml). Using light microscopy, the myopathological investigations detected moderate muscle fiber caliber variation. No ragged blue or COX negative fibers were present. Electron microscopy found increased number of mitochondria and lipid droplets both in subsarcolemmal and intermyofibrillar localization. Many mitochondria had rounded shape; intramitochondrial paracrystalline inclusions were not present. Glycogen accumulation was also detected in these regions (Fig 1B).
Patient2(II/1)
The 30-year-old daughter of patient 1 (Fig 1A) was born from breech position. She was resuscitated. She had normal development. From age 11, episodically inflammatory lipomas occurred on her body. Her psychiatric symptoms stared at age 15 with depression and hallucina- tions. Severe undifferentiated type of schizophrenia was diagnosed.
Some years later unilateral hypoacusis developed, and she had severe episodic ataxic gait repeatedly. Hyperthyreosis, hyperprolactanemia, and primer amenorrhea were detected as well. Neurological examina- tion revealed mild weakness in the tibial anterior muscles and distal type hypaesthesia in the legs. Her CK and resting serum lactate level was in normal range. This patient did not agree to perform the lactate stress test. The vitamin D3 level was low (8.6 ng/ml). Her brain MRI detected pituitary adenoma and mild cerebellar ectopia.
Patient3(II/2)
The 24-year-old male patient was born from normal pregnancy. He had normal motor development. In his childhood, bone develop- mental problems were suspected based on his laboratory results (abnormal vitamin D3, calcium, phosphate, and ALP levels). The social anxiety started in the childhood. Later dyslexia, dysgraphia, dyscalculia, and learning difficulties were detected. His neurological examination revealed micrognathia, pectus excavatum, kyphoscol- iosis, poor fine coordination, and slow psychomotility. CK was normal. Vitamin D3 was decreased (12.5 ng/ml).
Patient4(II/3)
The 20-year-old male patient was born as a hypotonic infant; his early development was delayed. He had a social anxiety since his early childhood and learning difficulties. Presently, he has autistic features with anxiety and impulsive behaviors. He had very long face, prominent jaw, and laxity of the knee joints. No neurological signs were found. The vitamin D3 level was low (10.8 ng/ml).
Mutation analysis
Mitochondrial DNA mutation was not found in either blood or skele- tal muscle samples, and single or multiple mtDNA deletions have been excluded as well.
Exome capture sequencing generated ~9.4 billion bases of sequence, and ~9.3 billion bases were then mapped to the target regions based on SeqCap_EZ_Exome_v3 Kit. 95% of the target regions had at least 10×coverage. After identification of variants, we focused only on non-synonymous variants, splice acceptor and donor site mutations, and short, frame shift coding insertions or deletions (indel). Using GEM.app software with autosomal dominant model after filtering out synonymous SNPs, 61 heterozygous vari- ants remained, including 1 coding indel, 57 missense, 1 splice-site, 2 nonsense mutations. Further narrowing based on protein prediction scores resulted in 27 variations. We did not find any homozygous or compound heterozygous rare variants in the 1,015 genes, which were previously associated by the literature with mitochondrial func- tion. The narrowing analysis for known mitochondrial genes filtered out 25 heterozygous (2 nonsense and 23 missense) variants. Among the rare variant filtering by the autosomal dominant inheritance model 16 genes were without any known function. Based on the literature, further seven genes were excluded because these genes are not linked to CNS involvements or mitochondrial dysfunctions.
Finally, four missense mutations were validated with Sanger sequencing. Among them only the c.22 G>A (p.Val8Met) substitu- tion inMSTO1gene is segregated in all affected family members and
was present in heterozygous form (Table EV1 and Fig 1C). This mutation was found in urinary tract and colorectal tumors, as a somatic mutation (COSM3930426, COSM3930426) (http://cancer.sa
I/1 I/2
MSTO P1
II/1 MSTO P2
II/2 II/3
c.22 G>A p.Val8Met
Ctrl2 Ctrl3 MSTO
P2 MSTO
P1
A B
C D
E F
Patient 1 MAGGVREMLTLQLGHFAGFVGAHW 24
Homo sapiens 1 MAGGAREVLTLQLGHFAGFVGAHW 24 Pan troglodytes 1 MAGGAREVLTLQLGHFAGFVGAHW 24 Bos taurus 1 MAGGAREVLTLQLGHFAGFVGAHW 24 Mus musculus 1 MAGGAREVLTLQLGHFAGFVGAHW 24 Rattus norvegicus 1 MAGGAREVLTLQLGHFAGFVGAHW 24 Meleagris gallopavo 1 MAG---EAVTLQLGHYAGCVGAHW 21 Xenopus tropicalis 17 ---EIVTVQLGPFSNCLGAHW 34 Danio rerio 1 MSGACREVVTLQLGHYSNFIGTHW 24 Drosophila melanogaster 5 ---REILTFQFGTYANYVGTHF 23
MSTO P1
MSTO P2 Ctrl1
MSTO1 HSP70
55kDa 70kDa
MSTO P1
MSTO P2
2μm
g.DNA
c.DNA
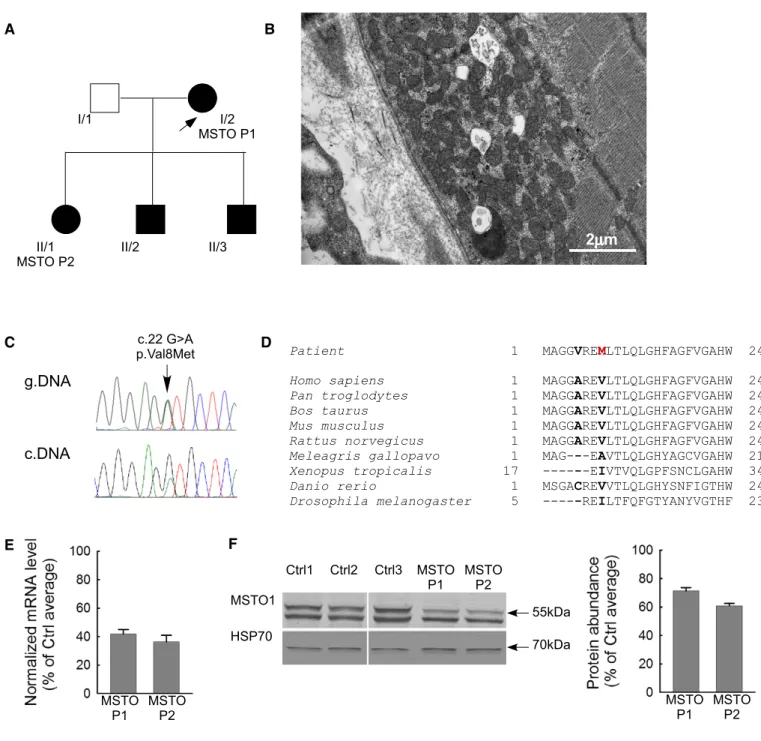
Figure1. Clinical and genetic data of the patient.
A Family tree of the investigated patients. Arrow indicates the proband.
B Electron microscopy sections of the patient muscle biopsy specimen. Increased number of mitochondria both subsarcolemmal and intermyofibrillar, lipid droplets, and glycogen accumulation (electron microscopy,30,000×).
C Sequenogram of the suspected pathogenic mutation and the neighboring polymorphism in exon1ofMSTO1gene from genomic (upper part) and cDNA (lower part).
Arrow indicates the position of the mutation.
D Taxonomical alignments of the affected MSTO1protein sequence. Location of the alterations in the patients are shown in bold. The red“M”indicates the amino acid substitution segregated in all affected family members.
E Normalized mRNA expression level from the patient primary fibroblasts (percentage of the average value of the healthy controls) (meanSEM).
F MSTO1Western blotting of the patient and control fibroblast. Left: representative blots; right: normalized protein abundance of the percentage of the average protein expression levels of the controls (meanSEM).
Source data are available online for this figure.
nger.ac.uk); according to the Exome Aggregation Consortium (ExAC) database (http://exac.broadinstitute.org), the minor allele frequency is 0.003% (rs762798018), and it was absent in 1000 Genome (http://www.1000genomes.org), NHLBI Exome Sequencing Project (ESP) (http://evs.gs.washington.edu/EVS/), ClinVar (http://
www.ncbi.nlm.nih.gov/clinvar), dbGAP (http://www.ncbi.nlm.
nih.gov/gap), and EGA (http://www.ebi.ac.uk/ega) databases.
Connection with any clinical phenotype has not been described, yet.
The mutated part of MSTO1 protein sequence is highly conserved in mammals (Fig 1D). This alteration was confirmed by cDNA sequenc- ing from fibroblast as well (Fig 1C). Other alterations ofMSTO1gene were excluded by Sanger sequencing of the total coding sequence from genomic DNA and cDNA sequencing from patient derivate fibroblasts (MSTO P1, II/1 and MSTO P2, I/2). The copy number alteration was also excluded by real-time PCR methodology.
In the patient-derived primary fibroblast culture, the MSTO1 mRNA and protein expression were significantly decreased (MSTO P1 and MSTO P2) compared with the average values of three controls (Fig 1E and F). The MSTO1 mRNA expression was 42.03.0% in MSTO P1 and 36.34.7% in MSTO P2 (Fig 1E), while the protein abundance was 71.42.3% in MSTO P1 and 61.01.6% in MSTO P2 (Fig 1F). The other two affected family members did not agree to the skin biopsy.
In silicoanalysis
Based on the prediction of the InterPro domain software, MSTO1 protein has 2 tubulin/Ftz-like GTPase domains. The prediction of GTP binding residues in the protein sequence by GTP-binder appli- cation (Chauhan et al, 2010) found seven possible GTP binding sites in the first (aa 16-21; 23-24; 30; 62-63; 73-74; 76-77; and 81) tubulin/Ftz GTPase domain (Fig EV1A).
The protein alignments between MSTO1 and the known mito- chondrial fusion proteins detected some similarities in a 12 amino acid span with the OMM fusion proteins, MFN1 and MFN2 (Fig EV1B). These amino acids are located in the second tubulin/
Ftz, GTPase domain of the MSTO1 protein and are highly conserved in mammals (Fig EV1C). To determine the significance of the simi- larity between MSTO1 and MFN1, BLAST alignments using randomly scrambled versions of each protein were performed with the default parameters for multiple sequence alignment (word size 3, BLOSUM62 matrix). Out of 100 alignments MFN1 and scrambled MSTO1s and 100 alignments of MSTO1 and scrambled MFN1s, 17 (8.5%) aligned segments with an equal or higher bit-score were found. Thus, the homology is not statistically significant in and of itself, though we would note the strong conservation across species of the acidic amino acids in MSTO1 and mitofusins. No similarity was found between MSTO1 and the inner mitochondrial membrane (IMM) fusion protein, OPA1.
Mitochondrial morphology in primary fibroblasts
Mitochondrial morphology was visualized in fibroblasts obtained from I/2: MSTO1 Patient 1 (P1) and II/1: MSTO1 Patient 2 (P2), the 2 family members who agreed to undergo skin biopsy, and from 3 individuals serving as controls (Ctrl 1, 2, and 3), expressing mito- chondrial matrix-targeted DsRed1 (mtDsRed). The cells with various mitochondrial morphology (Fig EV2A) were quantified as a
percentage of the total number of transfected cells (≥20 cells per experiment,n=5 independent experiments). More cells with aggre- gated mitochondria were counted in MSTO1 patient fibroblasts than in the controls (P1: 37.8%; P2: 33.3%; Ctrl average: 11.70.4%).
In patient fibroblasts, the percentage of cells with fragmented and partially fragmented mitochondria was also increased (P1, partially fragmented: 46.7%, fragmented: 17.3; P2: partly fragmented:
48.8%, fragmented: 8.5%; Ctrl average: partly fragmented:
25.11%, fragmented: 00%) (Fig EV2A–C).
Mitochondrial continuity in primary fibroblasts
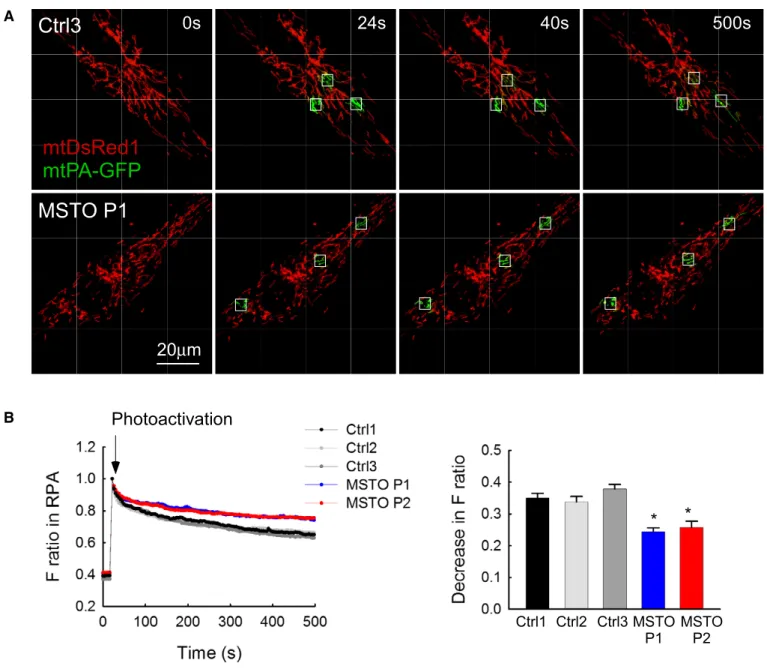
To evaluate whether the distinct mitochondrial morphology in patient and control fibroblasts can result from different levels of interorganellar continuity and fusion events, the cells were co-trans- fected with cDNA encoding mtDsRed1 and mitochondrial matrix- targeted photoactivatable GFP (mtPA-GFP). Using confocal micro- scopy, time series of fluorescence images were recorded and 25lm2 square-shaped areas were illuminated by a pulsed laser to photoacti- vate mtPA-GFP (Eisneret al, 2014; Weaveret al, 2014), which is a soluble protein that shows rapid diffusion (Partikian et al, 1998).
Mitochondrial matrix continuity and connectivity is unveiled by the diffusion of the photoactivated mtPA-GFP to the regions outside the 2P illuminated area. Image time series shows that mtPA-GFP diffu- sion was slower in P1 than in the age-matched Ctrl3 fibroblasts (Fig 2A). To quantify connectivity, the time course of the ratio of FmtPA-GFPandFmtDsRedwas calculated for the region of photoactiva- tion (RPA) in both P1 and P2 and in the three controls (Fig 2B). At 500 s, the lesser decay of the fluorescence ratio in the RPA indicates a decrease in the combined activity of mitochondrial network formation, mitochondrial fusion, and mitochondrial movements in the MSTO1 patient cells (Fig 2B).
Mitochondrial fusion dynamics in primary fibroblasts
To validate fusion events, reciprocal spreading of mtPA-GFP and mtDsRed among mitochondria that were not continuous at the time of mtPA-GFP photoactivation was sought (Fig 3A). The fusion events were quantitatively analyzed by the progression of the distribution of mtPA-GFP fluorescence between the images collected in the first 8 min after photoactivation. The result of manual counting indicates less mitochondrial fusion activity in the MSTO1 patient fibroblasts (Fig 3B). The total fusion numbers were decreased significantly in the patient fibroblasts (P1: 4.010.13 fusion/run; P2:
3.500.12 fusion/run; Ctrl average: 6.390.24 fusion/run) (Fig 3B). In a previous study, we have quantified the effect of two different ADOA-associated OPA1 mutations on the mitochondrial fusion activity using the same manual counting method used in the present study (Eisner et al, 2014). G300E point mutation in the GTPase domain and D58 deletion of the GTPase domain caused 60–70% decrease in the fusion activity, whereas the present MSTO1 mutations induced an approximately 40% decrease in fusion activity.
However, we have also studied an ADOA-associated OPA1 mutation (c.984) that caused a lesser decrease in the fusion activity (30%) than the present MSTO1 mutations. Thus, the MSTO1-associated fusion decrease is in the range of the OPA1-associated ones.
Fusion activity was also quantified by an algorithm that calculates the loss of the green-only pixels during the
post-photoactivation period. This unbiased determination showed that the average half-time of the GFP-only pixel loss was increased significantly in the MSTO1 fibroblasts (P1: 1,914305 s; P2:
1,817312 s; Ctrl average: 713105 s). Thus, results obtained by two different approaches show that mitochondrial fusion activity is suppressed in the MSTO1-deficient patient cells.
The average duration of individual fusion events was similar in both MSTO1 fibroblasts and in age-matched controls (P1: 1337 s;
P2: 1337 s; Ctrl average: 1176 s) (Fig 3C). Furthermore, the distribution of different fusion types in terms of rapid reversal (Fig 3D) and orientations (Fig 3E) did not show any alterations in
MSTO1 fibroblasts as compared with controls. In addition, the abun- dance of the main fusion (MFN1, MFN2, and OPA1) and fission (DRP1) proteins was unaltered in MSTO1 fibroblasts (Fig 3F).
MSTO1overexpression restores mitochondrial fusion dynamics in MSTO1patient fibroblasts
To test whether normal mitochondrial fusion phenotype can be restored by MSTO1 overexpression in MSTO1 patient fibroblasts, a bicistronic expression vector for MSTO1 and mtDsRed was created (mtDsRed1-T2A-MSTO1). Upon transfection of the P2 fibroblasts
MSTO P1 mtDsRed1 mtPA-GFP Ctrl3
20 μ m
0s 24s 40s 500s
Photoactivation
* *
Ctrl1 Ctrl2 Ctrl3 MSTO P1
MSTO P2 A
B
Figure2. Mitochondrial continuity in primary fibroblasts.
A Image time series showing a representative fibroblast cell before and after2P photoactivation of mtPA-GFP (white squares):0s (pre-activation),24s (immediately after photoactivation),40s, and500s.
B The time course of the ratio ofFmtPA-GFPtoFmtDsRedfor the region of photoactivation (RPA) (left); the decay of the fluorescence ratio in the RPA at500s (right) (number of imaged cells: Ctrl1N=94; Ctrl2N=45; Ctrl3N=87; MSTO P1N=84; MSTO P2N=130from minimum three experiments per each cells). Stars indicate the significant differences (Student’st-test: Ctrl average vs. MSTO P1*P=1.44×10 9, Ctrl average vs. MSTO P2*P=1.52×10 12; one-way ANOVA:P=0.00815) (meanSEM).
Side by side undeterminate (%) End to side transient (%)
End to end complete (%) Side by side complete (%) End to side complete (%) End to end transient (%) Side by side transient (%)
End to side undeterminate (%) End to end undeterminate (%)
13.4 ± 1.1 6.9 ± 0.4 25.1 ± 1.3
8.6 ± 0.5 4.1 ± 1.0 25.5± 0.9 18.5 ± 1.7
7.1 ± 0.7 31.0 ± 1.2
9.2 ± 1.0 4.9 ± 0.5 42.4 ± 1.9 0.5 ± 0.2 2.7 ± 0.4 0.2 ± 0.1 0.3 ± 0.1 0.5 ± 0.1 3 ± 0.6
Ctrl1 Ctrl2
7.2 ± 1.4 1.6 ± 0.7 27.2± 2.5 17.5 ± 2.2 5.1 ± 0.8 37.6 ± 2.4
2.1 ± 06 0.5 ± 0.1 0.9± 0.2 Ctrl3
8.5 ± 1.3 6.2 ±1.7 21.1± 2.8 20.0 ± 3.2 6.8 ± 1.1 34.4 ± 1.4 0.8 ± 0.1 0.8 ± 0.2 1.0± 0.1 MSTO P2 6.6 ± 1.4
0.9 ±0.7 28.5± 1.6 16.9 ± 3.5 4.1 ± 1.5 40.2 ± 2.7
0.9 ± 0.1 0± 0 1.9± 0.2 MSTO P1 Ctrl1 Ctrl2 Ctrl3 MSTO
P1 MSTO
P2
* *
MFN1 MFN2 OPA1 DRP1 HSP70
70kDa 75kDa 100kDa 80kDa 75kDa
70kDa MFN1 MFN2 OPA1 DRP1
A
B C D
E
F Ctrl1 Ctrl2 Ctrl3 MSTO P1
MSTO P2
Ctrl1Ctrl2 Ctrl3 MSTO P1
MSTO P2
Ctrl1 Ctrl2 Ctrl3 MSTO P1
MSTO P2 mtDsRed1
mtPA-GFP
0s 24s 272s 280s
4μm
Before event After event Photoactivation
mtDsRed1 mtPA-GFP
Mitochondrion 1 Mito1
Mito2
Mitochondrion 2
272s 280s
272s 280s
After Before
event
Figure3.
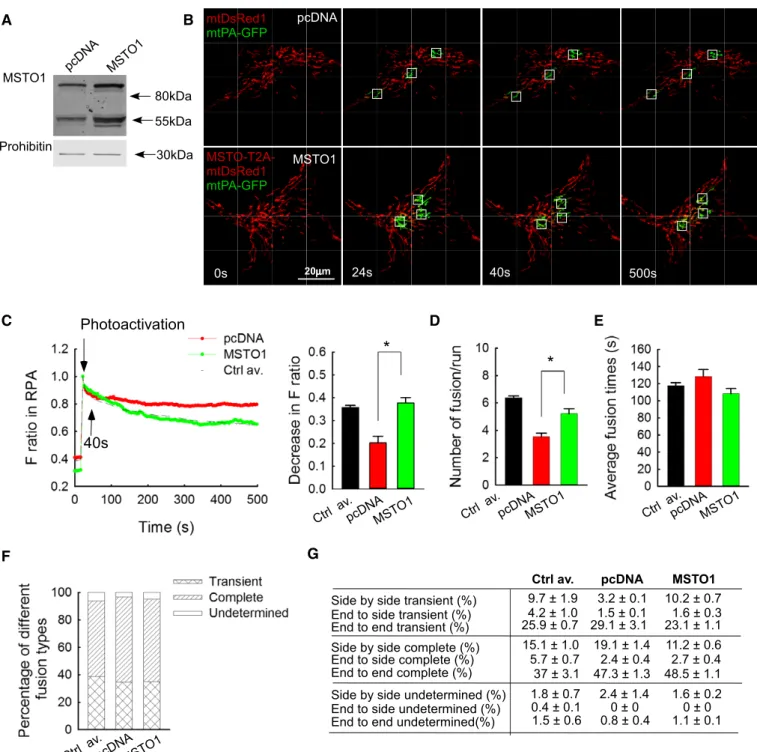
with this vector, the abundance of MSTO1 protein was greatly increased as compared with pcDNA-transfected cells (186%, Fig 4A). Only a hardly noticeable band appeared at the expected molecular weight of the mtDsRed1-T2A-MSTO1 complex, indicating that it was effectively processed to give rise to separated MSTO1 and mtDsRed proteins (Fig 4A).
To evaluate fusion dynamics, the fibroblasts were then co-trans- fected with mtPA-GFP and either mtDsRed1-T2A-MSTO1 or mtDsRed and pcDNA. In the microscopy studies, the MSTO1 overex- pressing cells were identified based on the mtDsRed fluorescence (images in Fig 4B). The spreading of mtPA-GFP fluorescence from the areas of photoactivation was accelerated in the MSTO1 overex- pressing cells (Fig 4B). The decrease in the fluorescence ratio at the RPA was significantly greater after MSTO1 transfection and was similar to the average value of the three controls (MSTO1-trans- fected P2 cells: 0.370.02; only mtDsRed-transfected MSTO P2 cells: 0.20.01; average of controls: 0.350.02 s) (Fig 4C). The average half-time of the GFP-only pixel loss was decreased signifi- cantly in the MSTO1 overexpressed cells (pcDNA-transfected cells:
1,714300 s, MSTO1-transfected cells: 954137 s,npcDNA=34;
nMSTO1=36; P=0.00343). The MSTO1 gene delivery normalized the fusion numbers as well (Fig 4D). After MSTO1 transfection, the average fusion number was 5.20.4/run (0.650.0/min), while in the mtDsRed-transfected cells 3.520.3/run (0.440.02/min) fusion events were counted (Fig 4D). As a reference, the average fusion numbers of control fibroblasts were 6.40.1/run, 0.80.0/min (Fig 4D). However, MSTO1 overexpression did not alter the reversibility (Fig 4E), duration (Fig 4F), and orientation (Fig 4G) of the fusion events.
MSTO1silencing inhibits mitochondrial fusion in HeLa cells
Next, in order to avoid the complexities and high variability of the cells derived from different individuals, the possible contribution of MSTO1 to fusion dynamics was assessed in HeLa cells. Gene silenc- ing was performed with either MSTO1-targeting or scrambled siRNA. Immunoblotting confirmed the MSTO1 depletion (Fig 5A).
Following 72-h silencing, the protein amount of MSTO1 was 493% compared to the scrambled siRNA control. In the MSTO1- silenced cells, the expression of MFN1, MFN2, OPA1, and DRP1 was not significantly changed (Fig 5A).
Mitochondrial fusion dynamics was evaluated upon co-transfec- tion of the siRNA-treated cells with mtPA-GFP and mtDsRed. The siMSTO1 cells showed increased mitochondrial fragmentation (Fig EV2D and E) and relatively slow spreading of mtPA-GFP from the photoactivation areas (Fig 5B and C). Applying the fusion quan- tification algorithm, the average half-time of the GFP-only pixel loss, which inversely correlates with mitochondrial fusion activities, was increased significantly in the MSTO1-silenced cells (MSTO1-silenced cells: 505101 s, scramble siRNA-silenced cells: 24720 s, nScr=45;nMSTO1=58;P<0.00001). Consistent with this, the manu- ally counted fusion number also decreased in the siMSTO1 condition (Fig 5D). After MSTO1 siRNA transfection, the average fusion number was 10.90.1/run, while in the scramble siRNA-transfected cells 20.10.5/run fusion events were counted (Fig 5D). The average duration of the fusion events slightly increased upon MSTO1 targeting (Fig 5E), whereas the distribution of the different fusion types (Fig 5F) and the orientation of the fusion events (Fig 5G) were not changed.
Mitochondrial motility is maintained in patient fibroblasts
We have previously shown that mitochondrial fusion can be controlled indirectly through changes in mitochondrial motility (Liuet al, 2009;
Twiget al, 2010). Therefore, mitochondrial motility was quantified in the MSTO1 patient fibroblasts as well as in the controls in side-by-side comparisons (Fig EV3). The results show that P2 had similar mito- chondrial movement activity to Ctrl1 and more than Ctrl2 (P=0.97 and P=0.0063, respectively, Kruskal–Wallis one-way ANOVA, Dunn’s multiple comparison test), and P1 was similar to Ctrl3 in terms of mitochondrial motility (P=0.10, Mann–Whitney rank sum test).
Thus, the decrease in mitochondrial fusion is not secondary to a decrease in mitochondrial motility in the MSTO1-deficient patient cells.
Mitochondrial membrane potential, Ca2+uptake, and respiration after MSTO1silencing
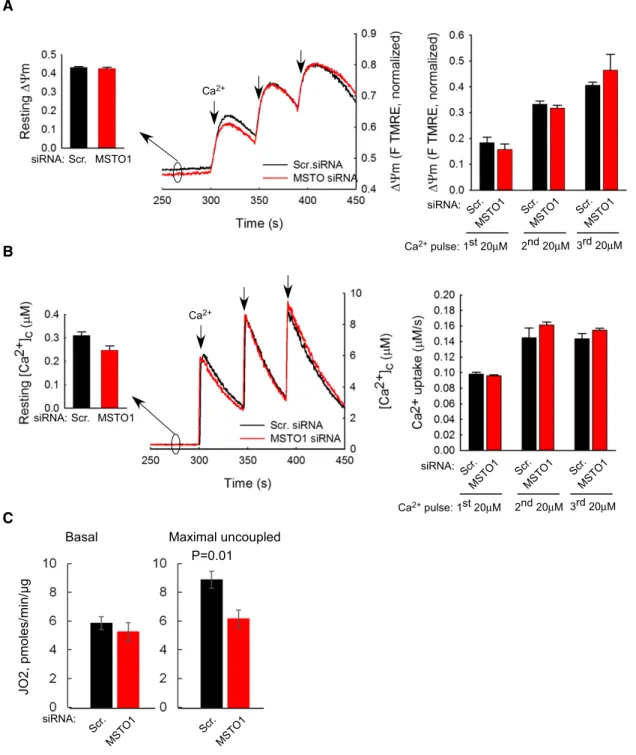
To determine whether the effect of MSTO1 silencing on mitochon- drial fusion might be secondary to an effect on mitochondrial bioen- ergetics, the mitochondrial membrane potential (DΨm) and Ca2+
uptake were determined. The restingDΨmand theDΨmloss evoked by Ca2+ additions were similar in both MSTO1- and scramble siRNA-silenced cells (Fig 6A). The resting “cytoplasmic” [Ca2+] and
◀
Figure3. Mitochondrial fusion events in primary fibroblast.A Representative example is shown out of2,200events. During photoactivation of mtPA-GFP, mtDsRed is photobleached, allowing detection of the mixing of each fluorescent protein after mitochondrial fusion. Mitochondria shown in the white box undergo an end-to-end fusion event at272s. During the event, mitochondrion
#1donates fluorescent mtPA-GFP to mitochondrion #2(acceptor). At the same time, the green acceptor mitochondrion donates fluorescent mtDsRed to mitochondrion #1. Arrows show the location of the fusion, abrupt, and complementary inter-mitochondrial transfer of the fluorescent proteins. The graphs on the right show the average mtDsRed1and mtPA-GFP fluorescence intensities of mitochondrion1and mitochondrion2before and after fusion event. The white box indicates two mitochondria before and after fusion.
B Rates of fusion events in primary fibroblasts. Stars indicate the significant differences (Student’st-test: Ctrl average vs. MSTO P1*P=9.6×10 21, Ctrl average vs.
MSTO P2*P=5.3×10 31; one-way ANOVA:P<0.00001) (meanSEM).
C Average duration of fusion events which were followed by fission during the8-min recording time (meanSEM).
D Distribution of transient and complete type fusion events.
E Orientation characteristics of fusion events in different fibroblasts (meanSEM).
F Western blot of the main fusion and fission proteins. Left: representative blots; right: quantified protein abundances in MSTO cells relative to the control cell average (meanSEM).
Data information: (B–E) Number of fusions: Ctrl1N=599; Ctrl2N=292; Ctrl3N=551; MSTO P1N=299; MSTO P2N=459; number of imaged cells: Ctrl1N=94; Ctrl2 N=45; Ctrl3N=87; MSTO P1N=84; MSTO P2N=130from minimum three experiments per each cells.
Source data are available online for this figure.
pcDNA
Ctrl av.
* *
MSTO1
Prohibitin
55kDa 30kDa 80kDa pcDNA MS
TO1
Photoactivation
40s
pcDNA MSTO1
Ctrl av.
pcDNA MSTO1
Ctrl av.
pcDNAMSTO1
A B
Ctrl av.
pcDNA MSTO1
Side by side undetermined (%) End to side transient (%)
End to end complete (%) Side by side complete (%) End to side complete (%) End to end transient (%) Side by side transient (%)
End to side undetermined (%) End to end undetermined(%)
29.1 ± 3.1 1.5 ± 0.1 3.2 ± 0.1
23.1 ± 1.1 1.6 ± 0.3 10.2 ± 0.7
47.3 ± 1.3 2.4 ± 0.4 19.1 ± 1.4
48.5 ± 1.1 2.7 ± 0.4 11.2 ± 0.6
0.8 ± 0.4 1.1 ± 0.1 0 ± 0 0 ± 0 2.4 ± 1.4 1.6 ± 0.2
pcDNA MSTO1
25.9 ± 0.7 4.2 ± 1.0 9.7 ± 1.9
37 ± 3.1 5.7 ± 0.7 15.1 ± 1.0
1.5 ± 0.6 0.4 ± 0.1 1.8 ± 0.7 Ctrl av.
0s 20μm mtDsRed1 mtPA-GFP
24s 40s 500s
MSTO1
C
F
D E
G MSTO-T2A- mtDsRed1 mtPA-GFP
Figure4. MSTO1overexpression in MSTO1patient fibroblasts.
A Representative Western blot of MSTO1protein expression after mtDsRed1-T2A-MSTO1vector delivery (representative of three experiments).
B Image time series showing representative pcDNA- and mtDsRed1-T2A-MSTO1-transfected fibroblast cell before and after2P photoactivation of mtPA-GFP (white squares) as in Fig2A.
C The time course of the ratio ofFmtPA-GFPtoFmtDsRedfor the region of photoactivation (RPA) (left); the decay of the fluorescence ratio in the RPA at500s (right). Stars indicate the significant differences (Student’st-test: *P=0.00412, ANOVA:P=0.00859) (meanSEM).
D Rates of fusion events in primary fibroblasts. Stars indicate the significant differences (Student’st-test: *P=1.71×10 4, ANOVA:P=0.00343) (meanSEM).
E Average duration of fusion events which were followed by fission during the8-min recording time (meanSEM).
F Distribution of transient and complete type fusion events.
G Orientation characteristics of fusion events in different fibroblasts (meanSEM).
Data information: (C–G) Number of fusions: mtDsRed1-T2A-MSTO1:N=188; pcDNA+DsRedN=127; number of imaged cells: mtDsRed1-T2A-MSTO1:35;
pcDNA+DsRedN=36; from≥2experiments per each cells.
Source data are available online for this figure.
MSTO1 MFN1 MFN2 OPA1 DPR1 Prohibitin
55kDa 70kDa 75kDa 100kDa 80kDa 75kDa 30kDa
Side by side undetermined (%) End to side transient (%)
End to end complete (%) Side by side complete (%) End to side complete (%) End to end transient (%) Side by side transient (%)
End to side undetermined (%) End to end undetermined(%)
49.1 ± 2.55.7 ± 1.2 9.7 ± 2.6
43.3 ± 2.4 7.2 ± 1.0 10.7 ± 2.2
22.6 ± 1.0 3.7 ± 1.0 4.5 ± 0.7
21.4 ± 2.9 3.5 ± 0.5 8.8 ± 0.9
2.3 ± 1.2 1.8 ± 0.4 0.5 ± 0.1 0.5 ± 0.3 1.9 ± 0.4 1.9 ± 0.4 Scr. siRNA MSTO1 siRNA Scr.
40μg Scr.
20μg
MSTO1 40μg
mtDsRed1 mtPA-GFP
Scr. siRNA
Photoactivation
40s
MSTO1 siRNA
20μm
0s 24s 40s
MSTO1 Scr.
siRNA:
MSTO1 Scr.
siRNA:
MSTO1
MFN 2 MFN1 OPA1
DRP 1
MSTO1
Scr. Scr. MSTO1
siRNA:
Protein:
A B
C
D F
G
E
Figure5.
the transients caused by CaCl2 boluses were also similar in the MSTO- and scrambled siRNA-treated cells (Fig 6B).
Respiration function measurements showed that MSTO silencing was without major effect on basal (Fig 6C) or leak-dependent JO2, but led to a slight but significant lowering of the maximal electron transport chain activity (Fig 6C) as determined by injecting the chemical uncoupler FCCP.
Thus, DΨm generation, mitochondrial Ca2+ accumulation and basal respiration do not seem to be affected by short-term MSTO1 depletion, indicating that suppression of mitochondrial fusion is not secondary to a change in mitochondrial bioenergetics.
MSTO1protein is mainly localized in the cytoplasmic area and shows partial colocalization with the mitochondria
In HeLa cells, overexpression of either MSTO1-Myc or mtDsRed1- T2A-MSTO1 caused an increase in MSTO1 protein amount (465 and 542%, respectively, compared to that in the pcDNA-transfected cells, Fig 7A). Again, the 80 kDa band representing the uncleaved mtDsRed1-T2A-MSTO1 complex was faint (Fig 7A).
To test the subcellular distribution of MSTO1, immunostaining was performed. HeLa cells transfected with mtDsRed1-T2A-MSTO1 vector were stained with anti-MSTO1 antibody 24 h after transfection.
MSTO1 did not show colocalization with the mitochondria; rather, intense MSTO1 staining was present in the whole cytoplasmic area (Fig 7B). To further investigate the localization of MSTO1 protein, HeLa cells were co-transfected with OMM-targeted GFP (OMP25-GFP) and MSTO-cMyc vectors. 24 h after transfection, the coverslips were divided into two groups. One group was permeabilized with digi- tonin (30lg/ml) before fixation, while the other group was just fixed.
Both the intact and permeabilized cells were stained with anti-MSTO1 or anti-cMyc antibodies. In the intact cells, the MSTO1/Myc signal and mitochondrial targeted OMP25-GFP colocalization was approx.
30% (MSTO1 staining: 292.7%; c-Myc staining: 33.12.1%) (Fig 7C and D). In the permeabilized cells, most of the MSTO1/c-Myc immunostaining disappeared, and for the remaining signal, the colocalization was around 50% (MSTO1 staining: 561.2%; c-Myc staining: 48.23.1%) (Fig 7C lower images; and Fig 7E).
To complement these results, endogenous MSTO1 protein abundance was assessed by immunoblotting in both total cell lysate and mitochon- dria isolated from HeLa cells. When normalized to the amount of the mitochondrial loading control, prohibitin, the MSTO1 protein amount was relatively low, only 35% in the mitochondrial fraction (Fig 7F).
MSTO1protein is soluble
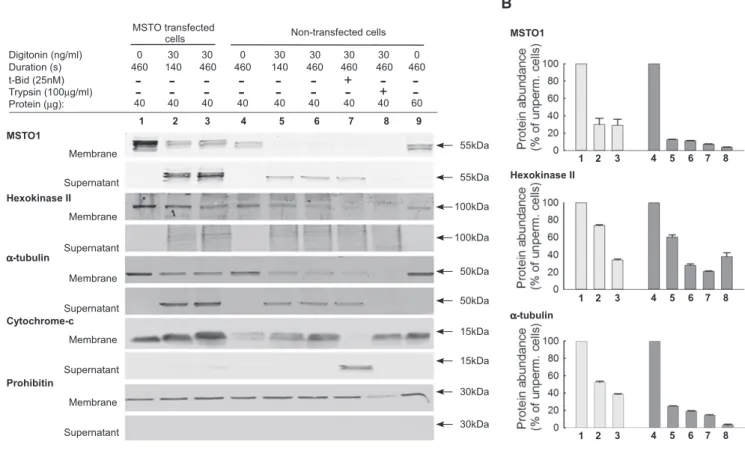
Permeabilization of the plasma membrane resulted in almost complete loss of the immunofluorescence, whereas the mitochon- drial markers stayed (Fig 7C), indicating that MSTO1 cannot be an integral or firmly associated mitochondrial protein. Then, it became important to determine how this protein could interact with the mitochondrial fusion proteins, which are transmembrane compo- nents of the OMM or IMM. Therefore, we compared the release upon plasma membrane permeabilization of MSTO1 to other cellu- lar proteins (Fig 8A). After plasma membrane permeabilization, in both the MSTO1-transfected and non-transfected HeLa cells, the MSTO1 protein is promptly and almost completely released into the cytoplasmic fraction. In MSTO1 transfected cells after 140 s more than 60% of MSTO1 protein was released into the cytoplasmicfrac- tion, while in the non-transfected cells MSTO1 release was even higher, approximately 88% (Fig 8B). For comparison, we tested the release of proteins with known localization. Hexokinase II, known to be loosely bound to the OMM (Chiaraet al, 2008), showed less and slower release than MSTO1 in both conditions (Fig 8B). The a-tubulin, a soluble cytosolic protein, showed a very similar release pattern to MSTO1 (Fig 8B). After saponin treatment, in the control and MSTO1 primary fibroblast cells, similar protein releases were found.
Mitochondrial intermembrane space proteins represented by cytochrome c were not released following digitonin or saponin treat- ments, since the OMM is more resistant to these detergents than the plasma membrane. However, cytochrome c redistributed to the cytoplasmic fraction upon tBid (pro-apoptotic Bcl2 protein) addition (Willis et al, 2007). Lastly, permeabilized cells were exposed to limited proteolysis with trypsin (100lg/ml), followed by addition of soybean trypsin inhibitor (250lg/ml) (Fig 8). After trypsin treat- ment, the MSTO, like hexokinase or a-tubulin, disappeared from both the cytoplasmic and membrane fractions, which further indi- cated that MSTO1 is localized out of the mitochondria and it can be loosely bound to the OMM.
Discussion
In this report, we described the first identified human disease- associated variation ofMSTO1gene in a patient with multisystemic clinical phenotype. Furthermore, we demonstrated that MSTO1 has
◀
Figure5. MSTO1silencing in HeLa cells.A Protein expression of MSTO1and the main fusion and fission proteins after MSTO1silencing. Top: representative blots; bottom: normalized protein abundance of the percentage of the average protein expression levels of the scramble siRNA-treated cells (N=3) (meanSEM).
B Image time series showing a representative MSTO1- and scramble siRNA-silenced HeLa cell before and after2P photoactivation of mtPA-GFP (white squares) as in Fig2A.
C The time course of the ratio ofFmtPA-GFPtoFmtDsRedfor the region of photoactivation (RPA) (left); the decay of the fluorescence ratio in the RPA at500s (right). Stars indicate the significant differences (Student’st-test: *P=5.4×10 4, one-way ANOVA:P=0.03678) (meanSEM).
D Rates of fusion events in silenced HeLa cells. Stars indicate the significant differences (Student’st-test: *P=7.15×10 19, one-way ANOVA:P<0.00001) (meanSEM).
E Average duration of fusion events which were followed by fission during the8-min recording time. Stars indicate the significant differences (Student’st-test:
*P=3.67×10 4, one-way ANOVA:P=0.00052) (meanSEM).
F Distribution of transient and complete type fusion events.
G Orientation characteristics of fusion events in silenced and control HeLa cells (meanSEM).
Data information: (C–G) Number of fusions: MSTO1siRNAN=386; Scr. siRNAN=563; number of imaged cells: MSTO1siRNAN=54; Scr. siRNAN=50; from three experiments.
Source data are available online for this figure.
Ca2+
Scr. MSTO1 siRNA:
Scr . MSTO1 siRNA:
Scr . MSTO1
Scr . MSTO1 3rd 20μM 1st 20μM
Ca2+pulse: 2nd 20μM
A
B
Ca2+
Scr. MSTO1 siRNA:
Scr . MSTO1 siRNA:
Scr . MS
TO1 Scr.
MS TO1
3rd 20μM 1st 20μM
Ca2+pulse: 2nd 20μM
C
Scr. MS
TO1 siRNA:
Scr .
MS TO
1
JO2,pmoles/min/µg
Basal Maximal uncoupled P=0.01
Figure6. Mitochondrial membrane potential and mitochondrial Ca2+uptake after MSTO1silencing.
A DΨmmeasured using TMRE in suspensions of permeabilized HeLa cells. Increase in fluorescence after each CaCl2pulse indicates depolarization. Left inset shows restingDΨmas initial TMRE fluorescence normalized to the fluorescence attained after complete depolarization by uncoupler (5lM FCCP). Left graphs shows the DΨmloss evoked by Ca2+pulses (4and3pairs of scrambled and MSTO siRNA-silenced cells per measurement from two independent experiments). Arrows indicate the CaCl2additions (20lM each) (meanSEM).
B Clearance of Ca2+by mitochondria. The cells were challenged by repetitive CaCl2pulses (20lM each). Ca2+uptake is shown in the representative traces by the decay of the [Ca2+] increases evoked by each CaCl2addition (arrows). Left inset shows the mean resting“cytoplasmic”Ca2+concentrations, the left graph shows
mitochondrial Ca2+uptake after each Ca2+pulse (4and3pairs of scrambled and MSTO siRNA-silenced cells per measurement from two independent experiments) (meanSEM).
C JO2was measured using the Seahorse XF24analyzer and calculated by subtracting the O2consumption rates measured prior to injecting the complex III inhibitor antimycin A (1lM) from the rate measured after antimycin addition. Basal JO2refers to the JO2in cells exposed only to DMEM + substrates. Maximal JO2refers to the JO2after injecting the chemical uncoupler FCCP (250nM).P-value was calculated using Student’st-test (P=0.01).n=5different passages per siRNA treatment (meanSEM).
Source data are available online for this figure.
Total cell lysate Isol
ated mitoch
ondr ia
MSTO1 Prohibitin
55kDa 30kDa anti-c-Myc
anti-MSTO1
Merge mtOMP25-GFP MSTO1/c-Myc
Intact cells
anti-c-Myc
anti-MSTO1 Permeabilized cells
No primary Ab
20μm
c-Myc MSTO1 c-Myc MSTO1
Merge MSTO1-T2A-
mtDsRed
anti-MTSO1
MSTO1
Prohibitin
55kDa
30kDa 80kDa pcDNA MSTO1-
cMyc
MSTO1- DsRed1
A B
20μm
C
D
E
F
Figure7.
a role in mitochondrial morphogenesis and quality control by supporting mitochondrial fusion. MSTO1 likely interacts with the mitochondrial fusion machinery as a soluble factor at the cyto- plasm–OMM interface.
Sequencing of DNA isolated from the blood (whole exome and Sanger sequencing) assumed that Val8Met mutation in theMSTO1 gene is responsible for the clinical symptoms in the present family.
The cDNA sequencing confirmed the heterozygous V8M, while in the genomic DNA no exon loss or multiplication was found in this gene. Thus, the Hungarian patients seem to have one impaired and one normal MSTO1 allele, which result in a partial decrease in
MSTO1 mRNA and protein levels. Based on combination of several criteria, no other known pathogenic mutation is segregated in this family, but we cannot exclude that partial loss of MSTO1 comes together with some other factors to cause the patients clinical picture. Notably, several mitochondria-associated protein distur- bances (e.g.,POLG1, RRM2B, OPA1, MFN2) can be inherited in both autosomal dominant and recessive manner. Based on previous observation, the autosomal recessive forms usually associated with severe, early-onset phenotypes, while in the autosomal dominant forms linked to milder, adult-onset manifestations (Tyynismaaet al, 2009). Loss-of-function mutations are usually associated with a
◀
Figure7. Subcellular localization of MSTO1protein.A Representative Western blot of MSTO1protein expression after both MSTO1-Myc and mtDsRed1-T2A-MSTO1gene delivery compared to the pcDNA-transfected cell lysate.
B Subcellular distribution of MSTO1, immunofluorescence visualization was performed with anti-MSTO1antibody in HeLa cells, which were transfected with mtDsRed1-T2A-MSTO1vector24h before fixation.
C Localization of MSTO1protein after24-h cotransfection with an OMM-targeted GFP (OMP25-GFP) and MSTO-cMyc vectors. The intact (upper part) and permeabilized (lower part) cells were immunostained with anti-MSTO1or anti-cMyc antibodies.
D Percentage of MSTO1colocalization with the mitochondria in intact cells (imaged cellsN=30) (meanSEM).
E Percentage of MSTO1colocalization with the mitochondria in permeabilized cells (imaged cellsN=30) (meanSEM).
F Comparative Western blotting of the MSTO1expression in total cell lysate and isolated mitochondria fraction in HeLa cells.
Source data are available online for this figure.
MSTO1
Prohibitin Protein (μg):
Hexokinase II Membrane Supernatant
Membrane Supernatant
Membrane Supernatant
55kDa 55kDa 100kDa 100kDa
30kDa 30kDa Digitonin (ng/ml)
Duration (s) t-Bid (25nM) Trypsin (100μg/ml)
0 30 30 0 30 30 30 30 0
460 140 460 460 140 460 460 460 460
- - - - - -
+- -
- - - - - - -
+-
40 40 40 40 40 40 40 40 60
MSTO transfected
cells Non-transfected cells MSTO1
Hexokinase II
1 2 3 4 5 6 7 8 9
1 2 3 4 5 6 7 8
1 2 3 4 5 6 7 8
Membrane Supernatant α-tubulin
50kDa 50kDa
α-tubulin
1 2 3 4 5 6 7 8
Membrane Supernatant Cytochrome-c
15kDa 15kDa
A B
Figure8. MSTO1protein release after plasma membrane permeabilization.
A Representative Western blots of MSTO1, hexokinase II,a-tubulin, and cytochrome c in membrane and supernatant fractions of MSTO1-cMyc-transfected and non-transfected cells.
B Protein release of MSTO1, hexokinase II,a-tubulin after plasma membrane permeabilization (values are normalized to the intact cells).N=3(meanSEM).
Source data are available online for this figure.
lower amount of the expressed proteins, but depending on its mono- or biallelic features, the remaining protein level could be different.
For example in the case of OPA1, the autosomal dominant muta- tions are associated with reduced OPA1 expression (Bonifertet al, 2014), while for the recessive form almost absent protein expression was found (Spiegelet al, 2016).
Human Misato (MSTO1) was described as an evolutionarily conserved OMM protein, and it has been implicated in the control of mitochondrial morphology (Mikloset al, 1997; Gurvitzet al, 2002;
Kimura & Okano, 2007). Our experiments extended this observation by demonstrating that a decrease in MSTO1 protein in patient fibroblasts as well as in HeLa cells upon MSTO1 acute silencing was associated with a decrease in mitochondrial fusion activity specifi- cally (Figs 2–5). The cause–effect relationship between MSTO1 decrease and fusion inhibition was validated by genetic rescue stud- ies in the patient fibroblasts (Fig 4). Since the decrease in mitochon- drial fusion was observed upon 72-h silencing, it unlikely results from a complex adaptation process. Furthermore, we have shown that at the same time point, no impairment inDΨmor Ca2+handling or basal respiration was noticeable (Fig 6). Thus, fusion inhibition is not secondary to an impairment of bioenergetics when MSTO1 is decreased.
In both fusion and fission, the key factors are the large GTPase enzymes belonging to the large dynamin superfamily; fusion is mainly regulated by MFN1, MFN2, and OPA1 (Meeusenet al, 2006;
Songet al, 2009), while fission requires mainly DRP1 (Oteraet al, 2010; Losonet al, 2013). However, the protein expression of these proteins was unaltered in MSTO1 fibroblasts (Fig 3F) as well as in HeLa cells after MSTO1 silencing (Fig 5A).
MSTO1 protein was originally described as an OMM protein; it was co-localized with cytochrome c and MitoTracker Orange in HeLa cells (Kimura & Okano, 2007), and thus, it could be an OMM fusion mediating factor. However, in our experiments, both overex- pressed (Fig 7) and endogenous (Fig 8) MSTO1 showed cytoplasmic localization. Since the majority of endogenous MSTO1 was promptly released upon plasma membrane permeabilization with a small frac- tion remaining associated with membranes (Fig 8), including the mitochondria (Fig 7), MSTO1 likely is a soluble cytoplasmic protein that might interact with OMM components. Thus, MSTO1 might serve as a cytoplasmic regulator of the OMM fusion machinery.
Interestingly, partial depletion of MSTO1 is sufficient to impair fusion (Figs 1 and 5), indicating that MSTO1 might be quantitatively required for normal mitochondrial fusion activity. However, because of the lack of direct evidence for an interaction of MSTO1 with a fusion protein, we cannot completely exclude the possibility that the decrease in MSTO1 induces a generic cellular stress response. The main argument against this mechanism is that many aspects of cell and mitochondrial function, including motility and bioenergetics remained unaltered in the MSTO1-deficient cells. In any case, further mechanistic studies will be needed to determine the exact mechanism of the fusion supporting role of MSTO1.
Mitochondrial fusion is central for the maintenance of mtDNA and function (Ono et al, 2001; Chan, 2006; Chen et al, 2010). It is sensible that short-term depletion of MSTO1 did not impair bioenergetics but on the long run in the patients, MSTO1 deple- tion is expected to cause some impairment in mitochondrial function. Notably, recent results indicate that impaired trafficking of functional mitochondria can also cause neuronal and other
tissue’s dysfunction (Nguyen et al, 2014) and mitochondrial movements are affected by the fusion dynamics (Liu et al, 2009).
However, MSTO1 also has an involvement in cell division that might be also relevant for some congenital malformations of the proband. DML1 and Misato might be co-opted into a role in mtDNA inheritance in yeast, and into a cell division-related mech- anism in flies. The mutations of DML1 or Misato could inhibit kinetochore-driven microtubules growth, associated with a strong mitotic defect; and it has an additional function in the partition- ing of mitochondrial organelle itself, or in segregation of chromo- somes (Mikloset al, 1997; Gurvitz et al, 2002; Mottier-Pavieet al, 2011).
In conclusion, our findings indicate that MSTO1 has a role in mitochondrial morphogenesis and maintenance by specifically supporting mitochondrial fusion. In contrast to previous findings, MSTO1 likely interacts with the mitochondrial fusion machinery as a soluble factor at the cytoplasm–OMM interface. Since a loss-of- function mutation in MSTO1 is associated with impaired mitochon- drial dynamics and several symptoms characteristic to mitochon- drial disease patients, MSTO1 might be a factor in diseases that have a mitochondrial component.
Materials and Methods
Patient selection and clinical investigations
The patients and controls were collected from the NEPSY Biobank of the Institute of Genomic Medicine and Rare Disorders, Semmel- weis University (Molnar & Bencsik, 2006). Written informed consent was obtained from each individual before sample collec- tion and molecular genetic testing. The study was approved by the National Ethical Committee (37/2014 TUKEB). Molecular genetic analysis was performed for diagnostic purposes in all investigated patients.
Detailed neurological, cardiology, psychiatric examinations, and laboratory investigations were performed. Skeletal muscle biopsy was obtained for light and electron microscopic examination using standard routine staining. Electroneurography and electromyogra- phy were performed by standard techniques (Dantech Keypoint, Denmark).
Molecular genetic studies
DNA was extracted from blood and skeletal muscle using QIAamp DNA blood and tissue kits, according to the instructions of manufac- turer (QIAGEN, Hilden, Germany).
The total coding region of mtDNA was screened by Sanger sequencing using ABI Prism 3500 DNA Sequencer (Applied Biosys- tems, Foster City, USA); the obtained sequences were compared with the mitomap databases using NCBI’s Blast application, while mtDNA deletion was investigated with long PCRs using Phusion High-Fidelity DNA Polymerase (Finnzyme, Vanta, Finland).
Exome Capture was performed in two steps according to the manufacturer’s protocol. Genomic DNA library preparation was performed by using TruSeq DNA Sample Prep Kit v2-Set A (Illu- mina), followed by NimbleGen SeqCap EZ Human Exome Library
v3.0 Kit exome enrichment (Roche). First pre-capture genomic library was prepared using 1lg of highly purified genomic DNA.
Crude pre-captured genomic library was analyzed by Agilent 2100 Bioanalyzer 1000 DNA chip to assess library quality. Next, during exome enrichment step, individual pre-captured libraries were hybridized to biotinylated NimbleGen SeqCap EZ Human Exome Library for 68–70 h at 47°C. Hybridized libraries were captured by magnetic Dynabeads MyOne Streptavidin C1 (Thermo Fisher Scientific). Streptavidin beads were washed, and the captured DNA was eluted. Eluted DNA was PCR amplified by 18 cycles.
Crude target-captured libraries were gel purified on 2% E-Gel (Life Technologies) and cleaned up with QIAquick Gel Extraction Kit (QIAgen, Hilden, Germany). Target-captured, gel-purified libraries were analyzed by Agilent 2100 Bioanalyzer 1000 DNA chip to assess libraries quality. The final library concentration was deter- mined by manual integration of molecular profile by Agilent 2100 Bioanalyzer 1000 DNA chip. Illumina adaptor-specific qPCR was also performed for each library to measure the library template concentration containing adaptor sequences on both ends which will subsequently form clusters on the Illumina flow cell. All library pools were sequenced on the HiScanSQ Illumina sequencing platform, using 2×95-bp pair-end sequencing protocol, with an extra 9-bp index sequencing run. Final exome-captured sequencing libraries were diluted to 10 nM. Reads were filtered according to the Q30 standard. 95-bp paired-reads were aligned to the human reference genome (hg19). The alignment was performed using Burrows–Wheeler aligner (BWA) software. For variation calling, Samtools software was used (Liet al, 2009; Li, 2011). After identifi- cation of variants, we focused only on non-synonymous variants, splice acceptor and donor site mutations, and short, frame shift coding insertions or deletions (indel) using Genomes Management Application (GEM.app) software (Department of Human Genetics, University of Miami Health System, and Miami, FL, USA).
The WES filtering procedure was the following: GATK (QUAL)>50, GQ>40, RD>4 quality scores; autosomal dominant inheritance; only the missense, nonsense, indels, and splice-site rare variants with MAF<0.01 were selected. All SNVs higher than three occurrences in GEMapp were excluded.
For crosschecking, the mitochondrial genetic alterations were investigated by targeted screening for both autosomal dominant and recessive inheritance performed in genes, which is responsible for mitochondrial function. The rare variants were filtered out based on mitochondrial gene function and disease association used a gene list, which was created by UNIPROT, NextProt, MitoMiner, and NCBI databases.
As large-scale genomic data are not available from the Hungarian population, a mutation with low minor allele frequency may be population specific. Finally, we prioritized mutations based on consequence. Exonic frameshift and stop mutations were considered as damaging. Missense mutations were prioritized, which was based on the protein prediction score annotations given by ANNOVAR (Wanget al, 2010). Further narrowing was based on protein predic- tion scores (Polyphen2 score>0.5, Mutation taster: disease caus- ing, SIFT<0.1, PHASTCONS>0.5; GERP>3). Using ACMG guideline (Richards et al, 2015), the pathogenic and likely patho- genic variants were confirmed by Sanger sequencing. After identifi- cation of candidate alterations, the segregation analysis was performed in all affected family members.
For the validation of the exome capture resultCOL5A1Exon 3, total coding region ofMSTO1from genomic and cDNA,RELNExon 62,RYR2Exon 16, were analyzed with bidirectional Sanger sequenc- ing (the primers listed in Table EV2). The obtained sequences were compared with the human reference genome (ENST00000371817, NM_000093.4; ENST00000245564, NM_018116.3; ENST00000343529, NM_173054.2; ENST00000366574, NM_001035.2) using NCBI’s Blastapplication.
The analysis of copy number variation of all exons of MSTO1 gene was performed by quantitative real-time RT–PCR with SYBG methodology in the real-time PCR StepOnePlus system according the manufacturer’s instructions (Life Technology). For quan- tification, the ddCt method was used.
RNA isolation and RT–PCR
Total cellular RNA was isolated using by RNeasy Plus Mini Kit, according to the instructions of manufacturer (QIAgen, Hilden, Germany). cDNA was synthesized by high Sensitive cDNA reverse transcriptase kit (Life Technology) according to the manufacturer’s instructions. For measuring mRNA level, RT–PCR products were analyzed by quantitative real-time RT–PCR with TaqMan Gene Expression Assays of MSTO1 genes (Hs01094406_g1), and GAPDH (Hs02758991_g1) as endogenous control (Life Technology). All PCRs were performed in the real-time PCR StepOnePlus system. For quantification of gene expression level, the ddCt method was used.
Creation of a Mito-DsRed1-T2A-MSTO1construct
Human MSTO1-Myc was purchased from OriGene (clone RC200136). To create the mtDsRed1-T2A-MSTO1 construct, first the sequences of the mtDsRed1 (from the pDsRed1-Mito plasmid, Clontech) and the human MSTO1 (from the cDNA clone RC200136, OriGene) were cloned into the pEGFP-N1 plasmid (Clontech) using the NheI and NotI restriction sites. Next, the sequence of the viral T2A peptide was inserted between Mito-DsRed1 and MSTO1 result- ing the cleavage of the single mRNA-coded polypeptide chain into two pieces during translation (PMID: 22357943). Transfection was performed using Lipofectamine 2000 (Life Technologies) with 0.7–4lg of plasmid DNA in serum-free culture medium for 4 h.
Cell lines, cultures, and transfections with siRNA and plasmid DNA
Fibroblasts were generated from a 6-mm skin punch biopsy taken under local anesthetic of healthy control individuals (Ctrl1: 35-year- old male, Ctrl2: 25-year-old female, Ctrl3: 57-year-old male) and patients carrying a c.22 G>A, p.Val8Met mutation inMSTO1gene (MSTO P1, MSTO P2). Cells were grown in Dulbecco’s modified Eagle’s medium (DMEM), with 4.5 g/l glucose supplemented with 10% fetal bovine serum, 2 mM glutamate, 100 units/ml penicillin/
streptomycin (all from GIBCO, Life Technology), and 110 mg/l pyruvate (Sigma). All cells were grown at 37°C in a humidified 5%
CO2 incubator. HeLa cells (ATCC) were grown in the above- described medium without pyruvate.
Before silencing, the cells were plated in antibiotic-free medium, and the samples were silenced in serum-free culture medium with MSTO1-specific (s30301, Life Technologies) or scrambled siRNAs