ORIGINAL INVESTIGATION
Comparison of speckle-tracking
echocardiography with invasive hemodynamics for the detection of characteristic cardiac
dysfunction in type-1 and type-2 diabetic rat models
Csaba Mátyás† , Attila Kovács† , Balázs Tamás Németh, Attila Oláh, Szilveszter Braun, Márton Tokodi, Bálint András Barta, Kálmán Benke, Mihály Ruppert, Bálint Károly Lakatos, Béla Merkely† and Tamás Radovits*†
Abstract
Background: Measurement of systolic and diastolic function in animal models is challenging by conventional non- invasive methods. Therefore, we aimed at comparing speckle-tracking echocardiography (STE)-derived parameters to the indices of left ventricular (LV) pressure–volume (PV) analysis to detect cardiac dysfunction in rat models of type-1 (T1DM) and type-2 (T2DM) diabetes mellitus.
Methods: Rat models of T1DM (induced by 60 mg/kg streptozotocin, n = 8) and T2DM (32-week-old Zucker Diabetic Fatty rats, n = 7) and corresponding control animals (n = 5 and n = 8, respectively) were compared. Echocardiog- raphy and LV PV analysis were performed. LV short-axis recordings were used for STE analysis. Global circumferential strain, peak strain rate values in systole (SrS), isovolumic relaxation (SrIVR) and early diastole (SrE) were measured. LV contractility, active relaxation and stiffness were measured by PV analysis.
Results: In T1DM, contractility and active relaxation were deteriorated to a greater extent compared to T2DM. In contrast, diastolic stiffness was impaired in T2DM. Correspondingly, STE described more severe systolic dysfunction in T1DM. Among diastolic STE parameters, SrIVR was more decreased in T1DM, however, SrE was more reduced in T2DM.
In T1DM, SrS correlated with contractility, SrIVR with active relaxation, while in T2DM SrE was related to cardiac stiff- ness, cardiomyocyte diameter and fibrosis.
Conclusions: Strain and strain rate parameters can be valuable and feasible measures to describe the dynamic changes in contractility, active relaxation and LV stiffness in animal models of T1DM and T2DM. STE corresponds to PV analysis and also correlates with markers of histological myocardial remodeling.
Keywords: Speckle-tracking echocardiography, Invasive hemodynamics, Diabetic cardiomyopathy, Cardiac dysfunction, Heart failure, Murine models, HFpEF, HFrEF
© The Author(s) 2018. This article is distributed under the terms of the Creative Commons Attribution 4.0 International License (http://creativecommons.org/licenses/by/4.0/), which permits unrestricted use, distribution, and reproduction in any medium, provided you give appropriate credit to the original author(s) and the source, provide a link to the Creative Commons license, and indicate if changes were made. The Creative Commons Public Domain Dedication waiver (http://creativecommons.org/
publicdomain/zero/1.0/) applies to the data made available in this article, unless otherwise stated.
Open Access
*Correspondence: radovitstamas@yahoo.com
†Csaba Mátyás, Attila Kovács, Béla Merkely and Tamás Radovits contributed equally to this work
Experimental Research Laboratory, Heart and Vascular Center, Semmelweis University, Városmajor u. 68., 1122 Budapest, Hungary
Page 2 of 13 Mátyás et al. Cardiovasc Diabetol (2018) 17:13
Introduction
Diabetes mellitus (DM) can be divided into four major types including type-1 (T1DM) and type-2 DM (T2DM).
T1DM accounts for 5% of all diabetes cases, while T2DM is more common [1]. The number of diabetic adults is likely to increase by 69% in developing countries and 20%
in the developed countries by the year of 2030 [2]. DM acts as an independent risk factor for different cardiovas- cular disorders. The altered metabolism in DM leads to the development of diabetic cardiomyopathy [3, 4]. Many animal models have been developed throughout the recent decades for T1DM and for T2DM to investigate the pathophysiology and pharmacology of diabetic cardi- omyopathy [5]. Our research group published a detailed report on characteristic deterioration of cardiac func- tion in T1DM and T2DM animal models [6]. According to our and others’ findings, T1DM is associated with the impairment of contractility and active relaxation while in T2DM increased cardiac stiffness and diastolic dysfunc- tion develops [6–8].
Pressure–volume (PV) analysis is the gold standard method for the detailed hemodynamic characterization of the heart [9]. PV analysis provides the possibility to measure intrinsic cardiac function including contractility, diastolic function, active relaxation and cardiac stiffness independently of loading conditions [10]. In spite of its clear advantages, the greatest disadvantage of PV analysis is its invasiveness (direct catheterization of the heart) and that this method requires the euthanization of the animal.
Transthoracic echocardiography may be an alterna- tive approach and due to its non-invasive nature it may be used in follow-up studies as well. However, conven- tional parameters derived from two-dimensional and M-mode echocardiographic images suffer from several shortcomings, including modest sensitivity and techni- cal limitations [9, 11]. Thus, assessment of contractility and diastolic function in diabetic cardiomyopathy is an issue for experimental studies. Parameters that are sensi- tive, reliable and reflect better the systolic and diastolic function of the heart are needed. Speckle-tracking echo- cardiography (STE) is an emerging echocardiographic technique that allows to characterize the deformation of the myocardium yielding advanced measures of systolic and also diastolic function [9, 12].
Based upon that, in the current study we aimed at comparing STE with PV analysis for the detection of characteristic differences between T1DM- and T2DM- associated cardiac dysfunction in relevant rodent models.
Methods Animals
Animals were housed individually in a room with con- stant temperature and 12/12 h light/dark cycles.
Model of T1DM
For T1DM 8-week-old male Sprague–Dawley rats (Charles River, Sulzfeld, Germany) were used. Animals received standard laboratory rat diet and water ad libi- tum. T1DM was induced with a single i.p. injection of streptozotocin (60 mg/kg) (Sigma Aldrich, Budapest, Hungary). Streptozotocin was dissolved in citrate buffer (pH = 4.5; 0.1 mol/l). Control animals received only the buffer. 72 h after the injection blood glucose con- centration was determined by using a digital blood glu- cose meter (Accu-Chek® Sensor, Roche, Mannheim, Germany). Animals with a random blood glucose level
> 15 mmol/l were considered diabetic and included in the study. The following study groups were established: non- diabetic control animals (T1DM Co; n = 5) and animals with type-1 DM (T1DM; n = 8). Experiments were per- formed after 8 weeks of diabetes duration.
Model of T2DM
For T2DM 7-week-old Zucker Diabetic Fatty (ZDF) rats (Charles River) were used [6]. Animals develop T2DM due to a genetic mutation of the leptin receptor.
Homozygous recessive males (fa/fa) develop obesity, fast- ing hyperglycemia and T2DM. Homozygous dominant (+/+) and heterozygous (fa/+) lean genotypes remain normoglycemic. Animals were fed a special diet (Purina
#5008) and water ad libitum. Animals were assigned to the following groups: non-diabetic control lean animals (T2DM Co; n = 8) and animals with type-2 DM (T2DM;
n = 7). Experimental procedures were performed at the age of 32 weeks (after 25 weeks of diabetes duration).
Measurement of blood glucose
Non-fasting blood glucose was measured by a digital blood glucose meter (Accu-Chek® Sensor, Roche, Man- nheim, Germany) from a drop of blood collected from the saphenous vein at the end of the study period.
Echocardiography
Echocardiography was performed at the end of the experimental period as described elsewhere [13]. In brief, animals were anesthetized with 1–2% isoflurane in 100%
oxygen, placed on a heating pad (body temperature was maintained at 37 °C). Echocardiography was conducted by using a 13-MHz linear transducer (GE 12L-RS, GE Healthcare, Horten, Norway) coupled with an echocardi- ography machine (Vivid i, GE Healthcare). Images were analyzed with an image analysis software (EchoPAC v113, GE Healthcare). Long-axis and mid-papillary level short- axis B-mode images were used to measure left ventricu- lar (LV) anterior (AW), posterior wall (PW) thicknesses and LV internal diameter (ID) in end-diastole (d) and in end-systole (s). End-systole was defined at minimal, while
end-diastole was defined at maximal LVID. Heart rate was determined from M-mode images taken at the mid- papillary level in the short-axis view of the LV. Values of three consecutive cycles were averaged and used for sta- tistical analysis. LV mass was calculated by the following equation: LVmass = 1.04 × [(LVAWd + LVIDd + LVPW d)3 − LVIDd3]. LVmass was normalized to the tibia length and body weight [LVmass/tibia length (g/cm); LVmass/
body weight]. Fractional shortening (FS) was calculated as FS = (LVIDd − LVIDs)/LVIDd * 100.
Speckle‑tracking echocardiography
Loops of short-axis views of the mid-papillary level dedicated for speckle-tracking analysis were acquired at least three times using a constant frame rate (218 Hz).
Analysis was performed in a blinded fashion by an expe- rienced operator (EchoPAC v113). Segmental and global circumferential strain (GCS), circumferential systolic (SrS), isovolumic (SrIVR) and early diastolic (SrE) strain rate values were calculated (Fig. 1). Segmental and global radial strain (GRS) was also measured. Three differ- ent short-axis loops from each animal and three cardiac cycles from each loop were analyzed. After manual delin- eation of the endocardial border on end-diastolic frame, the software automatically divided the region of interest to six segments and tracked them throughout the cardiac cycles. In case of low tracking fidelity, manual correction was performed. Acceptance of a certain segment was guided by the recommendation of the software. Ideally, for each parameter (3 × 3 × 6) 54 segmental values are available. Based on our internal protocol [9], animals with
< 36 segmental values available should not be included in statistical analysis. There was no such dropout in the cur- rent experiment.
Hemodynamic measurements
Invasive hemodynamic investigation was performed as described previously [14]. A pressure-conductance microcatheter (SPR-838, Millar Instruments, Houston, TX, USA) was advanced into the LV. In case of T1DM, animals were anesthetized with pentobarbital sodium (60 mg/kg i.p.), while T2DM animals were anesthetized with isoflurane (1–2%). Systolic, diastolic and mean arte- rial blood pressure (MAP), heart rate, LV end-systolic, end-diastolic pressures and volumes, stroke volume, ejection fraction (EF), cardiac output, stroke work, arte- rial elastance (Ea), maximal slope of diastolic pressure increment (dP/dtmax), maximal slope of diastolic pres- sure decrement (dP/dtmin), time constant of LV pressure decay (TauG; Glantz-method), maximal power were cal- culated. The slope of the LV end-systolic PV relationship (ESPVR; linear), preload recruitable stroke work (PRSW), maximal elastance (Emax) and dP/dtmax—end-diastolic
volume relationship were used as load- and heart rate- independent indices of LV contractility. The slope of the LV end-diastolic PV relationship (EDPVR; linear) was determined as an index of LV diastolic stiffness. A special PV analysis software (PVAN, Millar Instruments) was used for data analysis. Heart weight (g) was measured after euthanization.
Histology
Five µm thin myocardial sections were stained with Mas- son’s trichrome and hematoxylin–eosin staining. Inter- stitial fibrosis (excluding vascular spaces) was evaluated on Masson’s trichrome stained sections. Briefly, fibrotic to total tissue area of the myocardium was determined by ImageJ software (NIH, Bethesda, MD, USA) using thresholding on red–green–blue stack images of Mas- son’s trichrome sections by two independent observers.
Cardiomyocyte hypertrophy was evaluated by the meas- urement of cardiomyocyte diameter on hematoxylin–
eosin stained sections as described previously [14].
Statistics
Data are presented as mean ± SEM. Shapiro–Wilk test was used to confirm normal distribution. Based on that, unpaired two-sided Student’s t test or Mann–Whitney U test was used to compare experimental groups to the corresponding control groups. Pearson or Spearman test was used for correlation analysis appropriately. Individual data of the diabetic animals were normalized to the mean of their corresponding control group. Diabetes associ- ated percent changes were derived and compared with unpaired two-sided Student’s t test to compare changes between the two models. To test intra- and interobserver variability of STE measurements, 3 animals from each group were randomly selected and analyzed again using the aforementioned protocol by the first and also by a second operator blinded to previous results. Lin’s con- cordance correlation coefficient values were calculated. A p < 0.05 was considered significant.
Results
Body weight and blood glucose
In T1DM diabetic animals showed significant decrease in body weight, while in T2DM it remained unchanged (Table 1). Blood glucose levels were increased in both DM (T1DM Co vs. T1DM: 7.6 ± 0.4 vs. 33.1 ± 0.2 mmol/l, p < 0.001; T2DM Co vs. T2DM:
9.8 ± 0.6 vs. 27.0 ± 0.6 mmol/l, p < 0.001).
Echocardiography
T1DM was associated with significantly decreased wall thicknesses in diastole and in systole while LVIDd and LVIDs showed significant increase compared to controls
Page 4 of 13 Mátyás et al. Cardiovasc Diabetol (2018) 17:13
Fig. 1 Layout of speckle-tracking analysis. a Determination of circumferential strain on short-axis recordings. The negative peak of the curve represents the global circumferential strain (GCS). b Determination of circumferential strain rate on short-axis images. The peak negative value is the global circumferential strain rate in systole (SrS). The following peak represents the value of isovolumic relaxation (SrIVR) while the positive peak value is the early diastolic strain rate (SrE). Groups: animals with T1DM, their non-diabetic controls (T1DM Co); animals with T2DM and their non- diabetic controls (T2DM Co). Arrows indicate the specific changes of strain and strain rate curves in DM
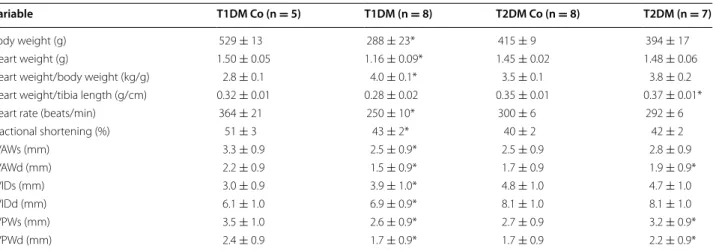
Table 1 Basic characteristics and conventional echocardiographic parameters of the study groups
The table shows the following parameters in the experimental groups: body weight, heart weight, heart weight/body weight, heart weight to tibia length, blood glucose, heart rate (during echocardiography), fractional shortening, left ventricular (LV) anterior (AW) and posterior wall (PW) thicknesses in systole (s) and in diastole (d), LV internal diameter (ID) in ‘s’ and ‘d’. Groups: animals with T1DM, their non-diabetic controls (T1DM Co); animals with T2DM and their non-diabetic controls (T2DM Co). * p < 0.05 vs. corresponding control group
Variable T1DM Co (n = 5) T1DM (n = 8) T2DM Co (n = 8) T2DM (n = 7)
Body weight (g) 529 ± 13 288 ± 23* 415 ± 9 394 ± 17
Heart weight (g) 1.50 ± 0.05 1.16 ± 0.09* 1.45 ± 0.02 1.48 ± 0.06
Heart weight/body weight (kg/g) 2.8 ± 0.1 4.0 ± 0.1* 3.5 ± 0.1 3.8 ± 0.2
Heart weight/tibia length (g/cm) 0.32 ± 0.01 0.28 ± 0.02 0.35 ± 0.01 0.37 ± 0.01*
Heart rate (beats/min) 364 ± 21 250 ± 10* 300 ± 6 292 ± 6
Fractional shortening (%) 51 ± 3 43 ± 2* 40 ± 2 42 ± 2
LVAWs (mm) 3.3 ± 0.9 2.5 ± 0.9* 2.5 ± 0.9 2.8 ± 0.9
LVAWd (mm) 2.2 ± 0.9 1.5 ± 0.9* 1.7 ± 0.9 1.9 ± 0.9*
LVIDs (mm) 3.0 ± 0.9 3.9 ± 1.0* 4.8 ± 1.0 4.7 ± 1.0
LVIDd (mm) 6.1 ± 1.0 6.9 ± 0.9* 8.1 ± 1.0 8.1 ± 1.0
LVPWs (mm) 3.5 ± 1.0 2.6 ± 0.9* 2.7 ± 0.9 3.2 ± 0.9*
LVPWd (mm) 2.4 ± 0.9 1.7 ± 0.9* 1.7 ± 0.9 2.2 ± 0.9*
(Table 1). In spite of that, in LVAWd and LVPW values showed marked increase in T2DM animals in compari- son to controls (Table 1) while LVID values remained unchanged. Additionally, FS decreased significantly in T1DM, while it was preserved in T2DM (Table 1).
Speckle‑tracking echocardiography
In T1DM animals, GCS and SrS values indicated clear systolic dysfunction compared to controls (Fig. 1 and Fig. 2a). However, in the T2DM group only SrS was slightly, but significantly decreased versus control ani- mals (Fig. 2a). SrIVR (suggested to be correlated with active relaxation) [15] was deteriorated in the T1DM model (Fig. 2b), while SrE was significantly reduced in T1DM and T2DM as well (Fig. 1 and Fig. 2b). GRS, along with segmental strain values, are reported in Additional file 1: Table S1.
Invasive hemodynamics
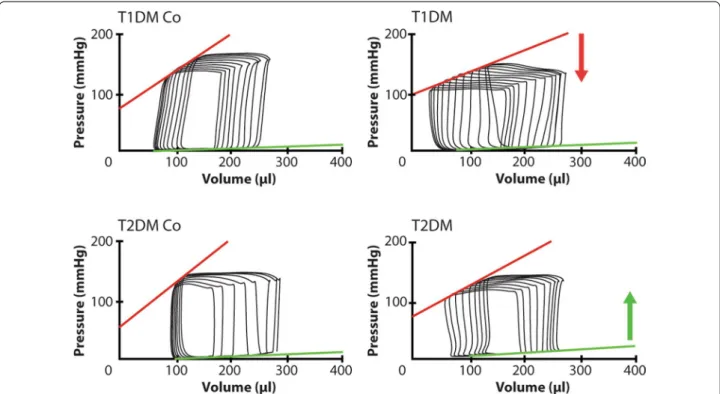
T1DM was associated with lower MAP and heart rate along with the significant worsening of contractile func- tion as shown by decreased values of EF, cardiac output, ESPVR and PRSW versus control rats (Fig. 3 and Addi- tional file 1: Table S2). On the other hand, MAP was similar, systolic function was preserved in the animal
model of T2DM as represented by unchanged EF, cardiac output and ESPVR (Fig. 3 and Additional file 1: Table S2). PRSW showed a slight decrease in LV contractility in T2DM (Additional file 1: Table S2). On the contrary, we observed significant increase of EDPVR (a marker of cardiac stiffness) in the T2DM rats, while it increased slightly in T1DM (Fig. 3 and Additional file 1: Table S2).
Additionally, TauG was markedly increased in both DM models (Additional file 1: Table S2). However, dP/dtmin deteriorated only in T1DM and remained unchanged in T2DM (Additional file 1: Table S2). LVEDP increased only in T2DM (Additional file 1: Table S2). All relevant data generated and calculated by the PVAN software are reported in Additional file 1: Table S2.
Diabetes associated impairment of cardiac function Regarding the cardiac function we observed different pat- tern of hemodynamic alterations in T1DM and T2DM.
Contractile function was more impaired in T1DM as shown by the values of ESPVR and PRSW and by STE parameters GCS and SrS (Fig. 4a). Regarding diastolic function, we observed more severe deterioration of active relaxation in T1DM (Fig. 4b), however, cardiac stiffness was more pronounced in T2DM (Fig. 4c). Accordingly, we observed significant correlations of the parameters of
Fig. 2 Results of speckle-tracking echocardiography. a Graphs show systolic parameters: global circumferential strain (GCS) and peak strain rate values in systole (SrS). b Graphs show diastolic parameters: peak strain rate at isovolumic relaxation (SrIVR) and in early diastole (SrE) in the groups.
Groups: animals with T1DM, their non-diabetic controls (T1DM Co); animals with T2DM and their non-diabetic controls (T2DM Co). *p < 0.05 vs.
corresponding controls
Page 6 of 13 Mátyás et al. Cardiovasc Diabetol (2018) 17:13
GCS and SrS with the contractile parameters of the PV analysis in T1DM (Fig. 4d; GCS and PRSW r = − 0.672, p < 0.05; SrS and PRSW r = − 0.786, p < 0.01). In addition to that, markers of active relaxation TauG and dP/dtmin
correlated with SrIVR in T1DM (Fig. 4e), while the myo- cardial stiffness parameter EDPVR correlated with SrE in T2DM (Fig. 4f; EDPVR and SrE r = 0.800, p < 0.001).
EDPVR and SrE correlate with myocardial hypertrophy in T2DM
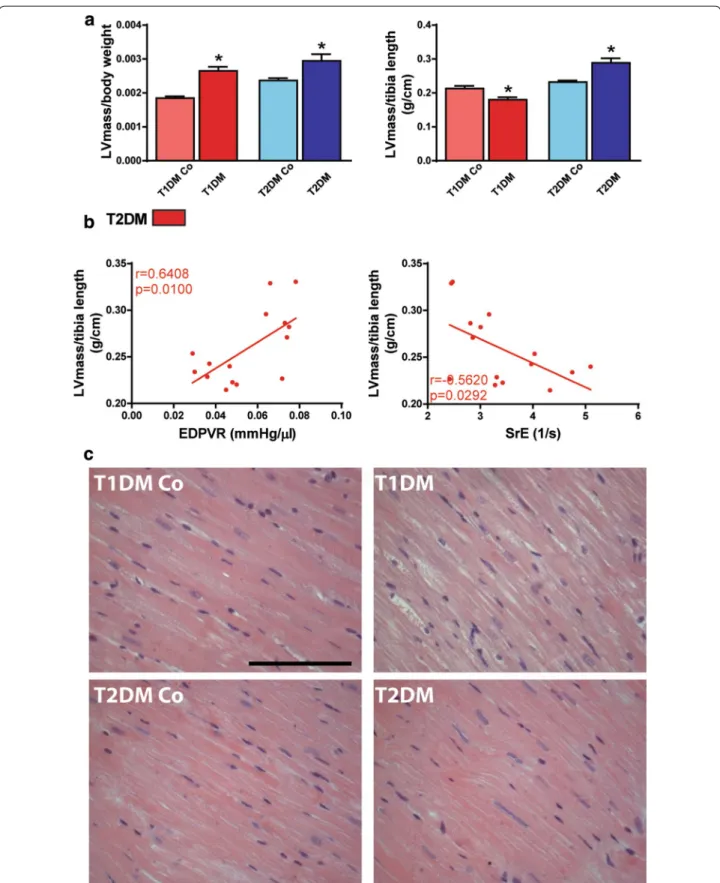
Although heart weight was significantly lower in T1DM, the heart weight/body weight ratio was increased in T1DM animals (Table 1). Additionally, these parameters did not change significantly in T2DM (Table 1). However, heart weight/tibia length ratio was increased in T1DM animals when compared to the controls (Table 1). Inter- estingly, echocardiographic analysis revealed increased LVmass/body weight values in both models (Fig. 5a) while LVmass/tibia length showed significant decrease in T1DM (Fig. 5a) and marked increase in T2DM (Fig. 5a).
The sensitive parameter of cardiac stiffness, EDPVR, along with SrE correlated significantly with the extent of myocardial hypertrophy in T2DM. Of note, EDPVR and SrE correlated with the echocardiography-derived LVmass/tibia length ratio (Fig. 5b; EDPVR r = 0.641,
p < 0.05; SrE r = − 0.562, p < 0.05). Moreover, histological analysis (Fig. 5c) revealed the significant elevation of car- diomyocyte diameter in both models (Fig. 6a) and EDPVR and SrE showed closer correlations with the hypertrophy of individual cardiomyocytes (represented by cardiomyo- cyte diameter) on a histological level (Fig. 6b; EDPVR r = 0.779, p < 0.01; SrE r = − 0.698, p < 0.01).
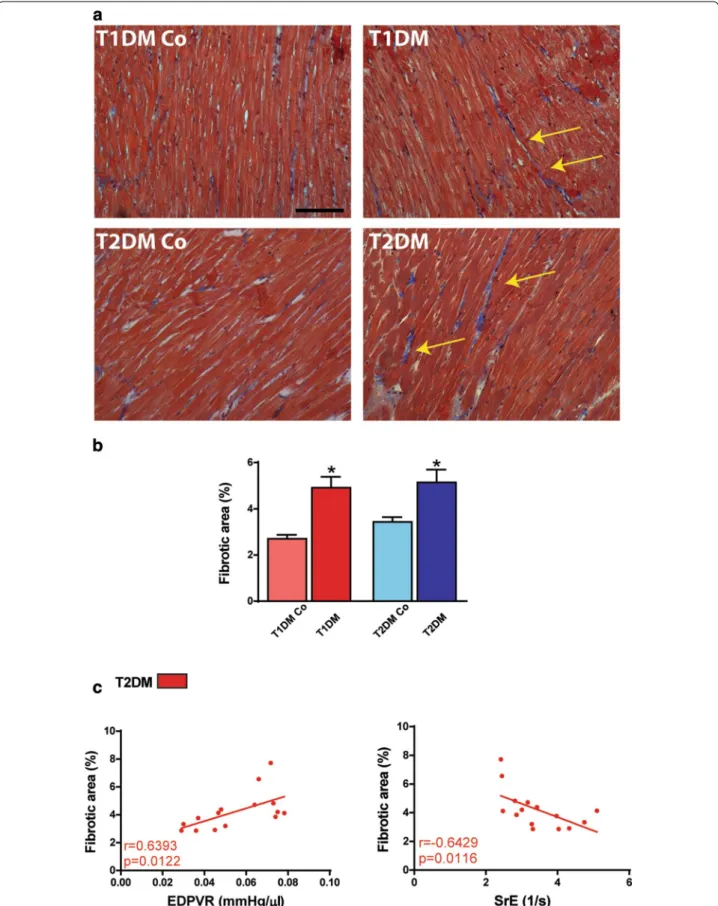
EDPVR and SrE correlate with myocardial fibrosis in T2DM As a sign of myocardial remodeling, fibrosis of the LV was evident in both models (Fig. 7a, b). It is worth not- ing that not only cardiac hypertrophy but also myocardial fibrosis is a determinant of cardiac stiffness since the val- ues of EDPVR and also STE-derived SrE correlated with the fibrotic area of the LV (Fig. 7c).
Intra‑ and interobserver variability of STE parameters Intraclass correlation coefficient values were the highest in terms of SrS (intra-reader and inter-reader: 0.982 and 0.969, respectively). GCS showed almost no difference between intra- and interobserver variability (0.950 and 0.947). SrE (0.971 and 0.929) and SrIVR (0.969 and 0.922) had similar intra-, while lower interobserver reproduc- ibility. Intraclass correlation coefficient values of GRS were lower (0.876 and 0.811).
Fig. 3 Representative pressure–volume loops. The figure shows representative left ventricular pressure–volume (PV) loops of the animals. Red line:
end-systolic PV relationship; green line: end-diastolic PV relationship. Arrows indicate the change of PV relationships (red arrow: decrease in end- systolic PV relationship, green arrow: increase in end-diastolic PV relationship). Groups: animals with T1DM, their non-diabetic controls (T1DM Co);
animals with T2DM and their non-diabetic controls (T2DM Co)
Discussion
In the present study we showed that: (a) STE-derived measurements are sensitive in the detection of diabetes associated impairment of cardiac contractility as well as diastolic function, (b) STE-derived parameters correlate with cardiac contractility, active relaxation and stiffness measured by PV analysis and (c) indices of STE correlate with the markers of histological remodeling (hypertrophy and fibrosis) in T2DM related diabetic cardiomyopathy.
The rat model of streptozotocin-induced T1DM and the ZDF rat as a model of T2DM are widely used in stud- ies focusing on the characterization of diabetic cardio- myopathy. Depending on the type of DM it is associated with characteristic changes in body weight and blood glucose levels. T1DM is associated with insulinopenia
and weight loss, while T2DM is often associated with obesity and hyperinsulinemia [1, 16]. In line with these observations, we found increased blood glucose levels in both models, however, body weight was lower in T1DM while it did not change in T2DM.
Characterization of cardiac performance is challenging in DM due to the changes in MAP and heart rate [10].
These phenomena might contribute to the difficulties of the comparison of cardiac function in these models with conventional techniques. Transthoracic echocardi- ography is the most commonly used imaging modality as it allows detailed morphological and functional char- acterization of the heart, while still remaining radiation free and cost-effective. However, conventional param- eters suffer from several shortcomings including modest Fig. 4 Diabetes associated impairment of systolic and diastolic function in diabetes. a Diabetes associated impairment of the following con- tractile parameters in type-1 and type-2 diabetes mellitus (T1DM, T2DM): end-systolic pressure–volume relationship (ESPVR), preload recruitable stroke work (PRSW), global circumferential strain (GCS) and the peak strain rate values in systole (SrS). b Diabetes associated alteration of diastolic parameters TauG, maximal slope of diastolic decrement (dP/dtmin) and strain rate at isovolumic relaxation (SrIVR) are shown. c Diabetes associated alteration of the slope of end-diastolic pressure–volume relationship (EDPVR), left ventricular end-diastolic pressure (LVEDP) and strain rate in early diastole (SrE) are shown. d Correlation analyses of GCS and SrS to ESPVR and PRSW are shown. e Correlation analyses of active relaxation parameter SrIVR to TauG and dP/dtmin are shown. f Correlation analyses of SrE to EDPVR and LVEDP are shown. Groups: animals with T1DM, their non-diabetic controls (T1DM Co); animals with T2DM and their non-diabetic controls (T2DM Co). *p < 0.05 T1DM vs. T2DM
Page 8 of 13 Mátyás et al. Cardiovasc Diabetol (2018) 17:13
Fig. 5 Cardiac stiffness correlates with the extent of myocardial hypertrophy. a Graphs of left ventricular (LV) mass to body weight (LVmass/body weight) and to tibia length (LVmass/tibia length) are shown. b Results of correlation analysis of LVmass/tibia length to the slope of end-diastolic pressure–volume relationship (EDPVR) and to early diastolic strain rate (SrE). c Representative hematoxylin–eosin stained sections. Magnification:
×400. Marker: 100 µm. *p < 0.05 vs. corresponding controls
sensitivity and reproducibility, resulting in moderate correlations with invasive measurements [11]. Develop- ment of software technology permitted frame-by-frame tracking of the myocardial echogenic pattern and this non-Doppler approach defines several advanced param- eters referring to systolic and diastolic function [17].
Strain measurements may notably overcome the afore- mentioned limitations by reflecting intrinsic myocardial function and also by being a semi-automated method.
Sensitivity of strain measures were proved in numer- ous pathological conditions in human and also in animal experiments [18, 19] including diabetic cardiomyopathy [4, 20–23]. Furthermore, in our recent work, we were able to show correlations between STE and PV analy- sis derived measures in a rat model of increased cardiac contractility [9]. Here, we found that GCS and SrS can demonstrate the overt systolic dysfunction in T1DM and correlate well with invasively measured contractil- ity. However, technical setup of our experiment allows detailed characterization of diastole as well. In our cur- rent work, SrIVR was reduced significantly in T1DM, while the deterioration of SrE was more pronounced in T2DM. This parallels with the invasive PV analysis show- ing more evident deterioration of active relaxation in
T1DM along with pronounced increase in LV stiffness in T2DM. Previously, SrIVR has been shown to be asso- ciated with TauG [24]. In our study, this association was also present in T1DM animals. Additionally, a correla- tion between SrE and the stiffness parameters EDPVR and LVEDP was shown in T2DM. Formerly, decrease of circumferential strain was demonstrated in a mouse model of T2DM [25], while most recently Shepherd et al.
published their data on T1DM highlighting the early sen- sitive nature of STE during consecutive evaluation com- pared to conventional echocardiographic parameters [26]. Based on these previous results, STE is now increas- ingly used in human clinical trials to unmask and follow- up subtle alterations in LV function [27]. Moreover, STE is also capable to assess right ventricular and also atrial deformation, which measurements will contribute to a more complex understanding of diabetic cardiomyopathy [28, 29].
Depending on its type, DM is associated with charac- teristic changes of cardiac function. Diastolic dysfunc- tion is an early sign in DM associated cardiomyopathy before the onset of detectable systolic dysfunction [3].
However, T1DM animals have been shown to exert not only diastolic but systolic cardiac dysfunction already Fig. 6 Cardiac stiffness correlates with the extent of myocardial hypertrophy. a Analysis of cardiomyocyte diameter in the study groups. b Correla- tion analyses of cardiomyocyte diameter to EDPVR and SrE. Groups: animals with T1DM, their non-diabetic controls (T1DM Co); animals with T2DM and their non-diabetic controls (T2DM Co). *p < 0.05 vs. corresponding controls
Page 10 of 13 Mátyás et al. Cardiovasc Diabetol (2018) 17:13
Fig. 7 Cardiac stiffness correlates with myocardial fibrosis. a Masson’s trichrome stained images. Magnification: ×100. Marker: 100 µm. b Quantifi- cation of fibrotic area in the study groups. c Result of correlation analysis of EDPVR and SrE to fibrotic area. Groups: animals with T1DM, their non- diabetic controls (T1DM Co); animals with T2DM and their non-diabetic controls (T2DM Co). *p < 0.05 vs. corresponding controls
at early time-points during the progression of the dis- ease [3, 16, 26, 30, 31]. According to our previous work, streptozotocin-induced (insulin-dependent) T1DM asso- ciated diabetic cardiomyopathy is characterized by the impairment of systolic function and by the prolongation of active relaxation [6]. Contractility and active relaxa- tion are highly energy-dependent processes that are greatly affected by the disturbances of insulin signaling [3]. Accordingly, we observed more pronounced impair- ment of the energy-dependent measures of systolic func- tion (EF, cardiac output, ESPVR, PRSW; GCS, SrS) and active relaxation (TauG, dP/dtmin; SrIVR) in our T1DM model by PV analysis and by STE. On the contrary, our T2DM animal model has been shown to develop insulin resistance together with hyperinsulinemia and insulin- openia at a later stage of the disease [32]. Accordingly, systolic function is preserved along with the impairment of diastolic function in the T2DM rat model [6]. Our present results are in line with the above findings as sys- tolic parameters (EF, cardiac output, ESPVR; GCS) did not change significantly in T2DM. However, LV com- pliance indices were markedly altered (LVEDP, EDPVR) in T2DM, which is in line with our previous results [6, 16]. Additionally, we observed a significant drop in MAP and heart rate in T1DM while they did not change in T2DM. End-diastolic stiffness is predominantly affected by the changes of myocardial structure [33] including cardiomyocyte hypertrophy and fibrotic remodeling [34].
Consistently, we found increased LVEDP and EDPVR in T2DM while SrE was also markedly reduced. In the back- ground of the increased diastolic stiffness we observed hypertrophic and fibrotic remodeling of the myocardium in T2DM. Of note, our sensitive hemodynamic param- eter EDPVR along with STE-derived SrE correlated with the extent of cardiomyocyte hypertrophy and with the amount of interstitial fibrosis. Previous studies have also reported that STE is a useful tool in the assessment of myocardial fibrosis as global and segmental strain parameters correlated with interstitial fibrosis and car- diomyocyte area in animal models of uremic [35] and hypertrophic cardiomyopathy [36] as well as in humans with Fabry-disease [37] and hypertrophic cardiomyopa- thy [38]. However, to our knowledge this is the first study that shows that the impairment of SrE could refer to the extent of cardiac hypertrophy and fibrosis. Additionally, to our knowledge our study firstly reports about the cor- relation between EDPVR, SrE and histological markers of hypertrophy and interstitial fibrosis.
Limitations
Our study has some assumptions and limitations. Firstly, the number of investigated animals may serve as a limita- tion, however, the current case numbers are reasonable
in experimental studies and are based on previous statis- tical calculations (power analysis). This should also affect some of the calculated correlation coefficients, where beyond the peak values, the dispersion of data is higher in the mid-range. While we should be cautious with the interpretation of the exact r values, the presence of a cor- relation is assured. Second, the echocardiographic hard- ware and software environment is not dedicated to small animal models. Nevertheless, the correlations with PV analysis, and also the reported intra- and interobserver values suggest that both the sensitivity and the reproduc- ibility of our setup is comparable to dedicated, higher frequency systems [12, 39]. Longitudinal strain, which is the most robust parameter in human settings, is absent in this work due to the lack of sufficient apical window in rats and due to its less reliable measurement from available long-axis images. However, it has been exten- sively shown that both regional and global STE param- eters derived from short-axis recordings could be feasible and meaningful measurements in various pathological conditions and experimental settings [40–42]. Beyond cardiomyocyte diameter, myocardial hypertrophy is also described by the calculation of LV mass, an M-mode measurement relying on geometrical assumptions. The inherent error in the calculation may have caused the modest correlation with stiffness parameters.
Conclusions
According to our knowledge, this is the first study to compare STE-derived systolic and also diastolic func- tional measurements with PV analysis in detecting the characteristic differences between T1DM- and T2DM- associated cardiac dysfunction in experimental ani- mal models. Based on our results, strain and strain rate parameters might be valuable and feasible measures to describe the dynamic changes in contractility, active relaxation and LV stiffness in animal models of T1DM and T2DM by serial assessment. Moreover, these param- eters may be reliable tools for experimental studies focus- ing on the pathophysiology and on the monitoring of therapeutic interventions in both type-1 and type-2 DM.
Abbreviations
AW: anterior wall; d: diastole; DM: diabetes mellitus; dP/dtmin: maximal slope of diastolic pressure decrement; EDPVR: the slope of the LV end-diastolic PV relationship; EF: ejection fraction; ESPVR: the slope of the LV end-systolic PV relationship; FS: fractional shortening; GCS: global circumferential strain; GRS:
global radial strain; ID: internal diameter; LV: left ventricle; LVEDP: left ventricu- lar end-diastolic pressure; MAP: mean arterial blood pressure; PRSW: preload recruitable stroke work; PV: pressure–volume; PW: posterior wall; s: systole;
STE: speckle-tracking echocardiography; SrE: early diastolic strain rate; SrIVR:
Additional file
Additional file 1. Additional tables.
Page 12 of 13 Mátyás et al. Cardiovasc Diabetol (2018) 17:13
strain rate at isovolumic relaxation; SrS: peak systolic strain rate; T1DM: type-1 diabetes mellitus; T2DM: type-2 diabetes mellitus; TauG: time constant of LV pressure decay; ZDF: Zucker Diabetic Fatty.
Authors’ contributions
Conception and design: CM, AK, BM and TR. Analysis and interpretation: CM, AK, BTN, AO, SB, MT, BAB, KB, MR and BKL. Drafting of the manuscript: CM, AK and TR. Revising the manuscript for important intellectual content: CM, AK, BTN, AO, SB, MT, BAB, KB, MR, BKL, BM and TR. All authors read and approved the final manuscript.
Acknowledgements
The authors express their thanks to medical students Marianna Török and Dalma Kellermayer for their help in performing ex vivo investigations of the project in the frame of the Students’ Scientific Association at Semmelweis University. Expert technical assistance of Tímea Fischinger, Henriett Biró, Dóra Juhász, Gábor Fritz is gratefully acknowledged. Authors are thankful for GE for software support.
Competing interests
The authors declare that they have no competing interests.
Availability of data and materials
The datasets used and/or analyzed during the current study are available from the corresponding author on reasonable request.
Consent for publication Not applicable.
Ethics approval and consent to participate
Our investigation conformed to the ARRIVE guidelines and the Guide for the Care and Use of Laboratory Animals used by the US National Institutes of Health (8th edition, 2011). Our experimental protocol was reviewed and approved by the institutional ethical committee (Permission Number:
22.1/1162/3/2010).
Funding
This work was supported by the Hungarian Scientific Research Fund (OTKA PD100245; TR), by the National Research, Development and Innovation Office (NKFIH) of Hungary (“National Heart Program” NVKP_16-1-2016-0017; BM) and by the Arrhythmia Research Foundation. TR was supported by the János Bolyai Research Scholarship of the Hungarian Academy of Sciences. CM was supported by the scholarship of Human Resource Support Office (National Talent Program; NTP-NFTÖ-16-0081). BAB was supported by the scholar- ship of Ministry of Human Capacities (New National Excellence Program;
ÚNKP-17-2-I-SE-15).
Publisher’s Note
Springer Nature remains neutral with regard to jurisdictional claims in pub- lished maps and institutional affiliations.
Received: 26 October 2017 Accepted: 23 December 2017
References
1. Chamberlain JJ, Rhinehart AS, Shaefer CF Jr, Neuman A. Diagnosis and management of diabetes: synopsis of the 2016 American Diabetes Association standards of medical care in diabetes. Ann Intern Med.
2016;164:542–52.
2. Shaw JE, Sicree RA, Zimmet PZ. Global estimates of the prevalence of diabetes for 2010 and 2030. Diabetes Res Clin Pract. 2010;87:4–14.
3. Huynh K, Bernardo BC, McMullen JR, Ritchie RH. Diabetic cardiomyopa- thy: mechanisms and new treatment strategies targeting antioxidant signaling pathways. Pharmacol Ther. 2014;142:375–415.
4. Miki T, Yuda S, Kouzu H, Miura T. Diabetic cardiomyopathy: pathophysiol- ogy and clinical features. Heart Fail Rev. 2013;18:149–66.
5. Rees DA, Alcolado JC. Animal models of diabetes mellitus. Diabet Med.
2005;22:359–70.
6. Radovits T, Korkmaz S, Loganathan S, Barnucz E, Bomicke T, Arif R, et al.
Comparative investigation of the left ventricular pressure–volume relationship in rat models of type 1 and type 2 diabetes mellitus. Am J Physiol Heart Circ Physiol. 2009;297:H125–33.
7. Radovits T, Bomicke T, Kokeny G, Arif R, Loganathan S, Kecsan K, et al.
The phosphodiesterase-5 inhibitor vardenafil improves cardiovas- cular dysfunction in experimental diabetes mellitus. Br J Pharmacol.
2009;156:909–19.
8. Matyas C, Nemeth BT, Olah A, Torok M, Ruppert M, Kellermayer D, et al.
Prevention of the development of heart failure with preserved ejection fraction by the phosphodiesterase-5A inhibitor vardenafil in rats with type 2 diabetes. Eur J Heart Fail. 2017;19:326–36.
9. Kovacs A, Olah A, Lux A, Matyas C, Nemeth BT, Kellermayer D, et al. Strain and strain rate by speckle-tracking echocardiography correlate with pres- sure–volume loop-derived contractility indices in a rat model of athlete’s heart. Am J Physiol Heart Circ Physiol. 2015;308:H743–8.
10. Pacher P, Nagayama T, Mukhopadhyay P, Batkai S, Kass DA. Measure- ment of cardiac function using pressure–volume conductance catheter technique in mice and rats. Nat Protoc. 2008;3:1422–34.
11. Lang RM, Badano LP, Mor-Avi V, Afilalo J, Armstrong A, Ernande L, et al.
Recommendations for cardiac chamber quantification by echocardiogra- phy in adults: an update from the American Society of Echocardiography and the European Association of Cardiovascular Imaging. J Am Soc Echocardiogr. 2015;28(1–39):e14.
12. Bauer M, Cheng S, Jain M, Ngoy S, Theodoropoulos C, Trujillo A, et al.
Echocardiographic speckle-tracking based strain imaging for rapid cardiovascular phenotyping in mice. Circ Res. 2011;108:908–16.
13. Radovits T, Olah A, Lux A, Nemeth BT, Hidi L, Birtalan E, et al. Rat model of exercise-induced cardiac hypertrophy: hemodynamic characterization using left ventricular pressure–volume analysis. Am J Physiol Heart Circ Physiol. 2013;305:H124–34.
14. Matyas C, Nemeth BT, Olah A, Hidi L, Birtalan E, Kellermayer D, et al. The soluble guanylate cyclase activator cinaciguat prevents cardiac dysfunc- tion in a rat model of type-1 diabetes mellitus. Cardiovasc Diabetol.
2015;14:145.
15. Chen S, Yuan J, Qiao S, Duan F, Zhang J, Wang H. Evaluation of left ventricular diastolic function by global strain rate imaging in patients with obstructive hypertrophic cardiomyopathy: a simultaneous speckle tracking echocardiography and cardiac catheterization study. Echocardi- ography. 2014;31:615–22.
16. Radovits T, Korkmaz S, Matyas C, Olah A, Nemeth BT, Pali S, et al. An altered pattern of myocardial histopathological and molecular changes underlies the different characteristics of type-1 and type-2 diabetic cardiac dysfunction. J Diabetes Res. 2015;2015:728741.
17. Mor-Avi V, Lang RM, Badano LP, Belohlavek M, Cardim NM, Derumeaux G, et al. Current and evolving echocardiographic techniques for the quan- titative evaluation of cardiac mechanics: ASE/EAE consensus statement on methodology and indications endorsed by the Japanese Society of Echocardiography. J Am Soc Echocardiogr. 2011;24:277–313.
18. Ferferieva V, Van den Bergh A, Claus P, Jasaityte R, La Gerche A, Rademak- ers F, et al. Assessment of strain and strain rate by two-dimensional speckle tracking in mice: comparison with tissue Doppler echocardiog- raphy and conductance catheter measurements. Eur Heart J Cardiovasc Imaging. 2013;14:765–73.
19. Amundsen BH, Helle-Valle T, Edvardsen T, Torp H, Crosby J, Lyseggen E, et al. Noninvasive myocardial strain measurement by speckle tracking echocardiography: validation against sonomicrometry and tagged mag- netic resonance imaging. J Am Coll Cardiol. 2006;47:789–93.
20. Muranaka A, Yuda S, Tsuchihashi K, Hashimoto A, Nakata T, Miura T, et al.
Quantitative assessment of left ventricular and left atrial functions by strain rate imaging in diabetic patients with and without hypertension.
Echocardiography. 2009;26:262–71.
21. Ernande L, Bergerot C, Rietzschel ER, De Buyzere ML, Thibault H, Pignon- blanc PG, et al. Diastolic dysfunction in patients with type 2 diabetes mellitus: is it really the first marker of diabetic cardiomyopathy? J Am Soc Echocardiogr. 2011;24(1268–75):e1.
22. Jedrzejewska I, Krol W, Swiatowiec A, Wilczewska A, Grzywanowska- Laniewska I, Dluzniewski M, et al. Left and right ventricular systolic function impairment in type 1 diabetic young adults assessed by 2D
• We accept pre-submission inquiries
• Our selector tool helps you to find the most relevant journal
• We provide round the clock customer support
• Convenient online submission
• Thorough peer review
• Inclusion in PubMed and all major indexing services
• Maximum visibility for your research Submit your manuscript at
www.biomedcentral.com/submit
Submit your next manuscript to BioMed Central and we will help you at every step:
speckle tracking echocardiography. Eur Heart J Cardiovasc Imaging.
2016;17:438–46.
23. Hollekim-Strand SM, Hoydahl SF, Follestad T, Dalen H, Bjorgaas MR, Wisloff U, et al. Exercise training normalizes timing of left ventricular untwist rate, but not peak untwist rate, in individuals with type 2 diabetes and diastolic dysfunction: a pilot study. J Am Soc Echocardiogr.
2016;29(421–30):e2.
24. Wang J, Khoury DS, Thohan V, Torre-Amione G, Nagueh SF. Global dias- tolic strain rate for the assessment of left ventricular relaxation and filling pressures. Circulation. 2007;115:1376–83.
25. Sera F, Kato TS, Farr M, Russo C, Jin Z, Marboe CC, et al. Left ventricular longitudinal strain by speckle-tracking echocardiography is associ- ated with treatment-requiring cardiac allograft rejection. J Card Fail.
2014;20:359–64.
26. Shepherd DL, Nichols CE, Croston TL, McLaughlin SL, Petrone AB, Lewis SE, et al. Early detection of cardiac dysfunction in the type 1 diabetic heart using speckle-tracking based strain imaging. J Mol Cell Cardiol.
2016;90:74–83.
27. Natali A, Nesti L, Fabiani I, Calogero E, Di Bello V. Impact of empagliflozin on subclinical left ventricular dysfunctions and on the mechanisms involved in myocardial disease progression in type 2 diabetes: rationale and design of the EMPA-HEART trial. Cardiovasc Diabetol. 2017;16:130.
28. Liu W, Wang Y, Zhou J, Bai H, Wang F, Wang J. The association of functional capacity with right atrial deformation in patients with pulmonary arterial hypertension: a study with two-dimensional speckle tracking. Heart Lung Circ. 2017. https://doi.org/10.1016/j.hlc.2017.02.029.
29. Li Y, Li L, Liu J, Li M, Lv Q, Wang J, et al. Histologic and hemodynamic cor- relates of right ventricular function in a pressure overload model: a study using three-dimensional speckle tracking echocardiography. Ultrasound Med Biol. 2017;44:467–76.
30. Rajesh M, Batkai S, Kechrid M, Mukhopadhyay P, Lee WS, Horvath B, et al. Cannabinoid 1 receptor promotes cardiac dysfunction, oxidative stress, inflammation, and fibrosis in diabetic cardiomyopathy. Diabetes.
2012;61:716–27.
31. Rajesh M, Mukhopadhyay P, Batkai S, Patel V, Saito K, Matsumoto S, et al.
Cannabidiol attenuates cardiac dysfunction, oxidative stress, fibrosis, and inflammatory and cell death signaling pathways in diabetic cardiomyo- pathy. J Am Coll Cardiol. 2010;56:2115–25.
32. Conceicao G, Heinonen I, Lourenco AP, Duncker DJ, Falcao-Pires I. Animal models of heart failure with preserved ejection fraction. Neth Heart J.
2016;24:275–86.
33. Pacher P, Mabley JG, Liaudet L, Evgenov OV, Marton A, Hasko G, et al. Left ventricular pressure–volume relationship in a rat model of advanced aging-associated heart failure. Am J Physiol Heart Circ Physiol.
2004;287:H2132–7.
34. Chang WT, Cheng JT, Chen ZC. Telmisartan improves cardiac fibrosis in diabetes through peroxisome proliferator activated receptor delta (PPARdelta): from bedside to bench. Cardiovasc Diabetol. 2016;15:113.
35. Kramann R, Erpenbeck J, Schneider RK, Rohl AB, Hein M, Brandenburg VM, et al. Speckle tracking echocardiography detects uremic cardiomyopathy early and predicts cardiovascular mortality in ESRD. J Am Soc Nephrol.
2014;25:2351–65.
36. Peng Y, Popovic ZB, Sopko N, Drinko J, Zhang Z, Thomas JD, et al. Speckle tracking echocardiography in the assessment of mouse models of cardiac dysfunction. Am J Physiol Heart Circ Physiol. 2009;297:H811–20.
37. Kramer J, Niemann M, Liu D, Hu K, Machann W, Beer M, et al. Two- dimensional speckle tracking as a non-invasive tool for identification of myocardial fibrosis in Fabry disease. Eur Heart J. 2013;34:1587–96.
38. Popovic ZB, Kwon DH, Mishra M, Buakhamsri A, Greenberg NL, Thami- larasan M, et al. Association between regional ventricular function and myocardial fibrosis in hypertrophic cardiomyopathy assessed by speckle tracking echocardiography and delayed hyperenhancement magnetic resonance imaging. J Am Soc Echocardiogr. 2008;21:1299–305.
39. Bhan A, Sirker A, Zhang J, Protti A, Catibog N, Driver W, et al. High- frequency speckle tracking echocardiography in the assessment of left ventricular function and remodeling after murine myocardial infarction.
Am J Physiol Heart Circ Physiol. 2014;306:H1371–83.
40. Popovic ZB, Benejam C, Bian J, Mal N, Drinko J, Lee K, et al. Speckle- tracking echocardiography correctly identifies segmental left ventricular dysfunction induced by scarring in a rat model of myocardial infarction.
Am J Physiol Heart Circ Physiol. 2007;292:H2809–16.
41. Malka A, Meerkin D, Barac YD, Malits E, Bachner-Hinenzon N, Carasso S, et al. TVP1022: a novel cardioprotective drug attenuates left ventricular remodeling after ischemia/reperfusion in pigs. J Cardiovasc Pharmacol.
2015;66:214–22.
42. Rappaport D, Adam D, Lysyansky P, Riesner S. Assessment of myocardial regional strain and strain rate by tissue tracking in B-mode echocardio- grams. Ultrasound Med Biol. 2006;32:1181–92.