A comparison of two sleep spindle detection methods
based on all night averages: individually adjusted vs. fixed frequencies
Péter Przemyslaw Ujma1, Ferenc Gombos2, Lisa Genzel3, Boris Nikolai Konrad4, Péter Simor5,6, Axel Steiger2, Martin Dresler4,7* and Róbert Bódizs1,2
1Institute of Behavioral Science, Semmelweis University, Budapest, Hungary
2Department of General Psychology, Pázmány Péter Catholic University, Budapest, Hungary
3Centre for Cognitive and Neural Systems, University of Edinburgh, Edinburgh, UK
4Department of Clinical Research, Max Planck Institute of Psychiatry, Munich, Germany
5Department of Cognitive Sciences, Budapest University of Technology and Economics, Budapest, Hungary
6Nyírõ Gyula Hospital, National Institute of Psychiatry and Addictions, Budapest, Hungary
7Donders Institute for Brain, Cognition and Behaviour, Radboud University Medical Centre, Nijmegen, Netherlands
Edited by:
Simon C. Warby, Stanford University, USA Reviewed by:
Thien Thanh Dang-Vu, Concordia University, Canada
Suzana Schonwald, Hospital de Clinicas de Porto Alegre, Brazil Dennis Angel Dean, Brigham and Women’s Hospital and Harvard Medical School, USA
*Correspondence:
Martin Dresler, Department of Clinical Research, Max Planck Institute of Psychiatry, Kraepelinstraße 2-10, 80804 München, Germany
e-mail: dresler@mpipsykl.mpg.de
Sleep spindles are frequently studied for their relationship with state and trait cognitive variables, and they are thought to play an important role in sleep-related memory consolidation. Due to their frequent occurrence in NREM sleep, the detection of sleep spindles is only feasible using automatic algorithms, of which a large number is available.
We compared subject averages of the spindle parameters computed by a fixed frequency (FixF) (11–13 Hz for slow spindles, 13–15 Hz for fast spindles) automatic detection algorithm and the individual adjustment method (IAM), which uses individual frequency bands for sleep spindle detection. Fast spindle duration and amplitude are strongly correlated in the two algorithms, but there is little overlap in fast spindle density and slow spindle parameters in general. The agreement between fixed and manually determined sleep spindle frequencies is limited, especially in case of slow spindles. This is the most likely reason for the poor agreement between the two detection methods in case of slow spindle parameters. Our results suggest that while various algorithms may reliably detect fast spindles, a more sophisticated algorithm primed to individual spindle frequencies is necessary for the detection of slow spindles as well as individual variations in the number of spindles in general.
Keywords: EEG, sleep spindles, sigma waves, automatic detections, fixed frequency method, IAM, comparison
INTRODUCTION
Sleep spindles are oscillations emerging from interacting thala- mocortical, corticothalamic, and reticular networks in NREM sleep (Steriade and Deschenes, 1984; Amzica and Steriade, 2000;
Steriade, 2000; Fogel and Smith, 2011), which are thought to play an important role in sleep-related brain plasticity (Genzel et al., 2014). Due to their trait-like nature and relationship to plastic- ity, sleep spindles are frequently studied as candidate indexes of individual variations in cognitive performance. Sleep spindles are remarkably individual features: sleep spindle parameters are char- acterized by high intra-individual stability and inter-individual variability (De Gennaro et al., 2005), a strong genetic background (De Gennaro et al., 2008), and a correlation with anatomical properties of the brain (Piantoni et al., 2013; Saletin et al., 2013).
Due to their high prevalence and specific signal properties automatic detection methods have proven to be viable and prefer- able alternatives to visual detection. Some of the earliest studies (Broughton et al., 1978; Campbell et al., 1980) used phase- locked loop devices for automatic sleep spindle detection and already reported an adequate agreement with visual detection.
An early combined software-hardware system (Ferri et al., 1989) also reliably replicated visual spindle detection results. Software solutions for automatic spindle detection were introduced some- what later (Schimicek et al., 1994) and reported relatively high (approx. 70%) specificity for 90% sensitivity, while an improved method (Devuyst et al., 2006) could increase this to almost 76%
in a clinical sample. More recently, sophisticated automatic sleep spindle detection methods using artificial neural networks (Acır and Güzeli¸s, 2004; Ventouras et al., 2005) and decision trees (Duman et al., 2009) reached even higher performance, with correct classification frequently exceeding 90%.
Automatic sleep spindle recognition was further refined by adapting algorithms that take into account the inter-individual differences in sleep spindle activity, which vastly exceed intra- individual variation (De Gennaro et al., 2005) and emerge—
among others—as a function of age and sex (Driver et al., 1996;
Carrier et al., 2001; Huupponen et al., 2002; Genzel et al., 2012).
Sleep spindle detection methods have been developed to operate with individually adjusted amplitude limits (Huupponen et al., 2000, 2007; Ray et al., 2010). A novel algorithm (Bódizs et al.,
2009; Ujma et al., 2014) based on the electrophysiological fin- gerprint theory of human sleep (De Gennaro et al., 2005, 2008) is the Individual Adjustment Method (IAM), which takes into account inter-individual variations not only in the amplitude, but also in the frequency of sleep spindles. In the IAM, sleep spin- dles are therefore not only detected based on individual amplitude thresholds, but also within the exact frequency bands where they are present in a given individual. A similarly adaptive detection method (based on a probabilistic model) is reported inNonclercq et al. (2013).
A comparison of four different spindle detection methods (Huupponen et al., 2007) reported acceptable, but not over- whelming concordance. A recent study (Warby et al., 2014) investigated the agreement in spindle detection between expert human raters, non-experts recruited in an internet crowdsourc- ing effort, and automatic detection algorithms. Concordance was strongest among human experts, followed by non-experts oper- ation in a crowdsourcing scheme, and weakest among automatic algorithms.
While the progress in automatic sleep spindle detection meth- ods is impressive, there are numerous concerns which must be addressed in this field. A practical criticism may arise from the fact that automatic sleep spindle detections are frequently vali- dated against visual detections: however, agreement in the visual scoring of spindles is not perfect (Campbell et al., 1980; Warby et al., 2014), the visual detection of spindles is often considered as a consensus from several raters which may bias results (Ray et al., 2010), and—despite stronger agreement among human raters than algorithms (Warby et al., 2014)—the use of human expert opinion as an absolute gold standard is philosophically questionable in itself (Bódizs et al., 2009).
Further criticism must be given to the fact of the use of standard signal detection terminology (such as sensitivity and specificity) in case of sleep spindle detection algorithms. Sleep spindles are frequent phenomena, but even so the vast major- ity of a sleep EEG recording does not consist of sleep spindles.
Therefore, correct negative classifications are by far the most common result produced by any sleep spindle detector, which might drastically inflate specificity. The ratio of correct hits and false detections—including misses and false positives—would be a much more conservative, but also more informative measure of detection performance.
Sleep spindles are not only biological signals, but important markers of individual traits (De Gennaro et al., 2005, 2008) as well as powerful correlates of human cognition (among others:
Bódizs et al., 2005; Schabus et al., 2006; Fogel et al., 2007; Ujma et al., 2014). Therefore, an alternative option in order to assess detection algorithms would be to investigate how much they can reproduce trait-like individual averages (instead of comparing individual spindle detections).
To our knowledge, it has never been investigated how strongly spindle measures of different detection methods are correlated if not individual spindle detections, but subject averages are consid- ered. This can evidently not predicted from the signal detection characteristics of the comparison of individual spindle detec- tions of various methods—albeit the literature usually reports moderate agreement between the individual spindle detections
of different algorithms, it is unknown whether the different spindle samples obtained by different methods approximate the same individual averages. Therefore, the aim of our study was to reveal the correlation between individual sleep spindle parameters calculated with two different detection methods.
MATERIALS AND METHODS
SUBJECTS
We examined polysomnographic data of 161 healthy volunteers (88 males, 73 females, age between 17 years and 69 years, mean age 29.4 years, StD 10.7 years) recorded on the second night spent in a sleep laboratory. All procedures were approved by the responsible institution’s ethical board and subjects gave informed consent. A semi-structured interview excluded any history of neurologic or psychiatric disease, but six subjects suffered from frequent nightmares. Subjects were free of drugs and prescrip- tion medication (except for contraceptives, all data self-reported).
Alcohol and excessive caffeine consumption (over two cups of coffee before noon) was not allowed. Eight subjects were smok- ers, while the rest were non-smokers (self-reported). This dataset used for analysis was the same as inUjma et al. (2014), except for the inclusion of one female subject who was excluded from the previous study due to her unavailable IQ score.
SLEEP RECORDINGS
All subjects spent two nights in a sleep laboratory and polysomnographic data from the 2nd night was used for analysis.
Since the study was performed in cooperation between multi- ple sleep laboratories, recordings were performed in four slightly different designs.
For 31 subjects, recordings were performed with 18 EEG elec- trodes using a Flat Style SLEEP La Mont Headbox device with a HBX32-SLP preamplifier (La Mont Medical Inc. USA), with a sampling rate of 249 Hz, hardware prefiltering 0.5–70 Hz and a precision of 12 bit.
For 16 subjects signals were collected, prefiltered (0.33–
1500 Hz, 40 dB/decade anti-aliasing hardware input filter), ampli- fied and digitized with 4096 Hz/channel sampling rate (syn- chronous) and 12 bit resolution by using the 32 channel EEG/polysystem (Brain-Quick BQ 132S, Micromed, Italy). A fur- ther 40 dB/decade anti-aliasing digital filter was applied by digital signal processing which low-pass filtered the data at 450 Hz.
Finally, the digitized and filtered EEG was undersampled at 1024 Hz.
For 114 subjects, recordings were performed with a Comlab 32 Digital Sleep Lab device (Schwarzer, Germany) with a sampling rate of 250 Hz, hardware prefiltering 0.53–70 Hz and a precision of 8 bit. In 94 of these subjects, 22 EEG electrode sites were used, while in the others 20 subjects 10 EEG electrodes were used.
Common recording sites in all subjects which were used in the analysis were Fp1, Fp2, F3, F4, Fz, F7, F8, C3, C4, Cz, P3, P4, T3, T4, T5, T6, O1, and O2, all referred to the mathematically linked mastoids. For the 20 subjects with only 10 electrodes, data from Fp1, Fp2, F3, F4, C3, C4, P3, P4, O1 and O2 was available and for the other electrodes these subjects were treated as missing data.
In order to correct for potentially different baseline ampli- tudes depending on the recording device (Vasko et al., 1997),
the analog-digital conversion and filtering characteristics of all recording devices were measured and sleep spindle amplitudes were corrected for the measured differences as follows (Ujma et al., 2014). We determined the amplitude reduction rate of each recording system by calculating the proportion between dig- ital (measured) and analog (generated) amplitudes of sinusoid signals at typical sleep spindle frequencies (10, 11, 12, 13, 14, and 15 Hz) for both inducing (40 and 355μV amplitude) sig- nals. Machine-specific amplitude reduction rates were given as the mean amplitude rate between digital and analog values at the two amplitudes and six measured frequencies. Sleep spindle amplitudes were corrected by dividing their calculated values by the amplitude reduction rate of the recording system. Given the individual- and derivation-specific adjustment inherent to both the Fixed frequency method (FixF) and the IAM, sleep spindle densities and durations are amplitude-insensitive measures. Thus, there is no need for the compensation of the different recording systems in these values.
Sleep recordings of the second nights were scored according to standard criteria (Iber et al., 2007) on a 20 s basis and artifacts were removed by visual inspection on a 4 s basis. Sleep spin- dle analysis was performed on artifact-free segments of NREM sleep.
ANALYSES
Fixed frequency method of sleep spindle analysis
For the FixF method we determined the 11–13 Hz range as a slow spindle frequency band and the 13–15 Hz window as a fast spindle frequency band. These frequencies were selected to ensure con- sistency with previous studies (Schabus et al., 2006, 2007, 2008;
Chatburn et al., 2013), which used a similar approach for the separation of slow and fast spindles.
Sleep spindles were automatically detected within artifact-free NREM sleep periods on every EEG derivation. For slow spindle detection, data were bandpass-filtered between 11 Hz and 13 Hz.
The root mean squares of the filtered signals were determined for 0.25 s length time windows. Next a threshold was calculated at the 95th percentile of the root mean square values for every EEG derivation. A spindle was identified when at least two consecu- tive root mean square time points exceeded the threshold, and the duration criterion (≥0.5 s) was met. Four spindle characteris- tics were calculated; these were density (number of spindles/min);
amplitude (peak-to-peak difference in voltage, expressed inμV);
duration (s), and frequency (number of cycles/s, in Hz). The same procedure was followed for detecting fast spindles, using a band pass filter of 13–15 Hz (Schabus et al., 2007; Gruber et al., 2013).
Sleep spindle analysis according to the IAM
The second sleep spindle detection algorithm was the IAM (Bódizs et al., 2009). This sleep spindle detection method takes into account both inter-individual variations and intra-individual consistency in sleep spindle frequency (De Gennaro et al., 2005, 2008), analyzing sleep spindles at the individual peak frequency for all subjects.
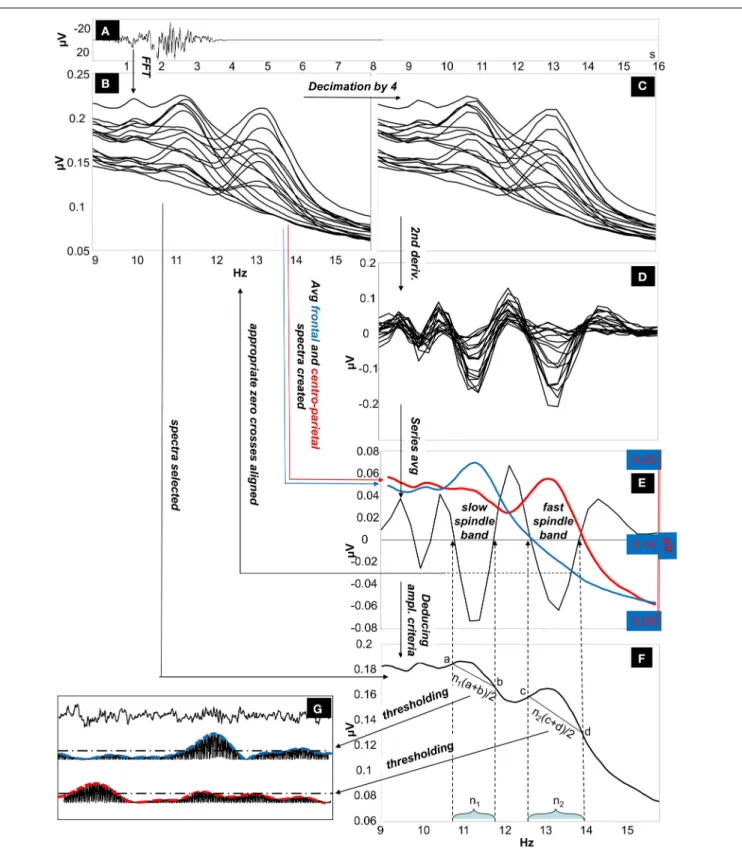
The IAM procedure (Bódizs et al., 2009) consisted of several steps as described below (illustrated onFigure 1).
i. Average amplitude spectra. Non-overlapping 4 s artifact-free NREM sleep EEG segments are Hanning-tapered (50%), then zero-padded to 16 s. Average amplitude spectra of all-night NREM sleep EEG derivations is computed between 9 Hz and 16 Hz by using an FFT routine (frequency resolution:
0.0625 Hz).
ii. Individually adjusted frequency limits of slow and fast sleep spindles. Determination of the individual slow and fast sleep spindle frequencies is based on second order derivatives of the 9–16 Hz amplitude spectra. In order to avoid small fluctua- tions in convex and concave segments average amplitude spec- tra of 0.0625 Hz resolution (i) is downsampled (decimated) by a factor of 4 (resulting in a resolution of 0.25 Hz) before calculating the derivation-specific second-order derivatives in this frequency range. Derivation-specific second order deriva- tives of the amplitude spectra are then averaged over all EEG derivations resulting in a whole-scalp second order deriva- tive for each subject. Individual-specific frequency limits of sleep spindles are defined as pairs of zero crossing points encompassing a negative peak in the whole-scalp second order derivatives. These zero-crossing points are rounded to the closest bins within the high-resolution (0.0625 Hz) amplitude spectra obtained in step i. Two pairs of individual-specific fre- quency limits and corresponding ranges are defined (one for slow and one for fast spindles). In cases of uncertainty (lack of zero crossing points indicating slow spindles or partial overlap between slow and fast sleep spindles in some cases), frequen- cies with predominance of power in averaged frontal (Fp1, Fp2, F3, F4, Fz, F7, F8) over averaged centro-parietal (C3, C4, Cz, P3, P4) amplitude spectra were considered as slow spin- dle frequencies (N=18). There was no case of uncertainty related to the individual-specific frequency boundaries of fast sleep spindles.
iii. Individual-specific spindle middle frequencies. Slow spindle middle frequency of a given subject was quantified as the arithmetic mean of the individual-specific lower and upper limits for slow spindling as obtained above (ii). In case of fast sleep spindling the arithmetic mean of the lower and the upper frequency limits of fast sleep spindles were considered.
iv. Individual- and derivation-specific amplitude criteria for sleep spindles. Spindles are defined as those EEG segments contributing to the peak region of the average amplitude spec- trum. Hence we intended to obtain an amplitude criterion corresponding to the line determined by they-values (μV) pertaining to the individually adjusted pairs of frequency limits (ii) in the average amplitude spectra (i).
a. The number of high resolution (0.0625 Hz) frequency bins (i) falling in the individual-specific slow- and fast sleep spindle frequency ranges (ii) is determined.
b. The amplitude spectral values (i) at the individually adjusted frequency limits for slow and fast sleep spindles (ii) are determined. This is performed in a derivation- specific manner.
c. Number of bins for slow and fast sleep spindling (iv/a) are multiplied by the arithmetic mean of the pairs of derivation-specific amplitude spectral values for slow and
FIGURE 1 | The Individual Adjustment Method (IAM) of sleep spindle analysis. (A)Four-second EEG epoch Hanning-tapered and zero padded to 16 s.
(B)Fast Fourier Transformation (FFT) is used to calculate 9–16 Hz average amplitude spectra of all night NREM sleep EEG from Hanning-tapered and zero-padded segments (derivations: Fp1, Fp2, F3, F4, Fz, F7, F8, T3, T4, T5, T6, C3, C4, Cz, P3, P4, O1, O2 referred to the mathematically-linked mastoids).(C) Amplitude spectra are decimated (down-sampled) by a factor of 4.(D)Second order derivatives of the decimated amplitude spectra.(E)Calculating the
whole-scalp second order derivatives by averaging all series. The resulting average series is overplotted with the averaged frontal (Fp1, Fp2, F3, F4, Fz, F7, F8) and centro-parietal (C3, C4, Cz, P3, P4) amplitude spectra (the left-side Y axis is for average second-order derivatives, while the second Y axis on the right is for average amplitude spectra). Appropriate zero-crossing points encompassing individual-specific slow and fast sleep spindle bands are selected on the 9–16 Hz frequency scale.(F)Derivation-specific amplitude criteria are calculated.(G) Thresholding of the envelopes of the slow and fast-spindle filtered signal.
fast sleep spindle frequency limits (iv/b), respectively.
Outcomes are individual- and derivation specific ampli- tude criteria for slow and fast sleep spindle detections.
v. Envelopes of sleep spindling. EEG data is band-pass filtered for the slow and fast spindle frequency ranges by using an FFT-based Gaussian filter with 16 s windows:f(x)=eˆ(−(x− xm)/(w/2)), where x varies between zero and the Nyquist fre- quency according to the spectral resolution, xmis the middle frequency of the spindle range (iii), and w is the width of the spindle range (ii) (ii and iii). Filtered signal is rectified and smoothed by a moving average weighted with a Hanning win- dow of 0.1 s length and multiplied withπ/2 (the latter is the inverse of the mean of a rectified sine wave).
vi. Detection and characterization of sleep spindles. If envelopes of this band-pass filtered and rectified data (v) exceed the indi- vidual and derivation-specific threshold as defined above (iv) for at least 0.5 s, a sleep spindle is detected. Sleep spindles detected this way are analyzed and average sleep spindle den- sity (number of spindles per minute), sleep spindle duration (s), as well as median and maximum amplitude (expressed as all-night means of intra-spindle envelopes inμV at the mid- dle of the detected spindles and at the maxima of the spindles, respectively) is calculated for the subject.
STATISTICS
FixF and IAM spindle parameters were compared using paired- samplet-tests (α=0.05). The Benjamini-Hochberg method of false detection rate correction was performed in order to correct for multiple comparisons.
We computed Pearson’s point-moment correlation coefficients between comparable sleep spindle measures (that is, sleep spin- dle parameters computed from the same electrode) produced by IAM, and the FixF method.
RESULTS
IAM FREQUENCY BANDS
For the IAM method, individual slow spindle lower frequency limits ranged from 8.98 Hz to 12.95 Hz (mean: 10.96 Hz), while higher frequency limits ranged from 10.14 Hz to 13.7 Hz (mean:
11.9 Hz). Slow spindle middle frequencies ranged from 9.59 to 13.28 Hz (mean: 11.43 Hz). Fast spindle lower frequency lim- its ranged from 11.82 Hz to 14.77 Hz (mean: 13.06 Hz), while higher frequency limits ranged from 13.04 Hz to 16.03 Hz (mean:
14.36 Hz). Fast spindle middle frequencies ranged from 12.49 Hz to 15.38 Hz (mean: 13.71 Hz).
Individual slow spindle frequency bands were on average 0.94 Hz wide (range: 0.34–2.2 Hz). Individual fast spindle fre- quency bands were on average 1.3 Hz wide (range: 0.84–1.89 Hz).
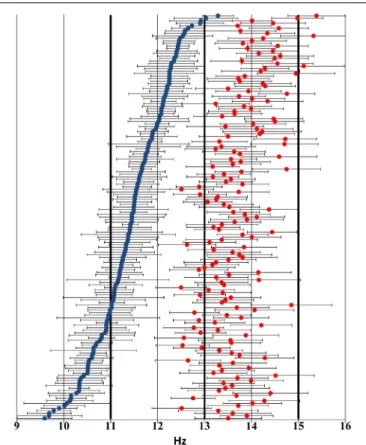
Figure 2 shows the distribution of individual sleep spindle frequencies.
FixF vs. IAM SPINDLE PARAMETERS
IAM provides an approximately twice higher sleep spindle density than the FixF method in case of both slow and fast spindles as well as 1.5–2 times longer sleep spindle durations. Standard deviations of the individual averages of the FixF parameters are much smaller
FIGURE 2 | Distribution of individual sleep spindle frequency bands across the 9–16 Hz frequency domain based on visual inspection of the sleep EEG spectrum and the zero crossings of the second-order derivatives thereof.Blue markers indicate slow spindle middle frequencies, while red markers show fast spindle middle frequencies.
Negative and positive error bars illustrate lower and higher individual frequency limits, respectively. Thick lines highlight the 11 Hz, 13 Hz, and 15 Hz thresholds used in the FixF method. Subjects have been ordered by slow spindle middle frequency to ensure better visibility.
than in case of IAM parameters, even proportionally to the lower mean values.
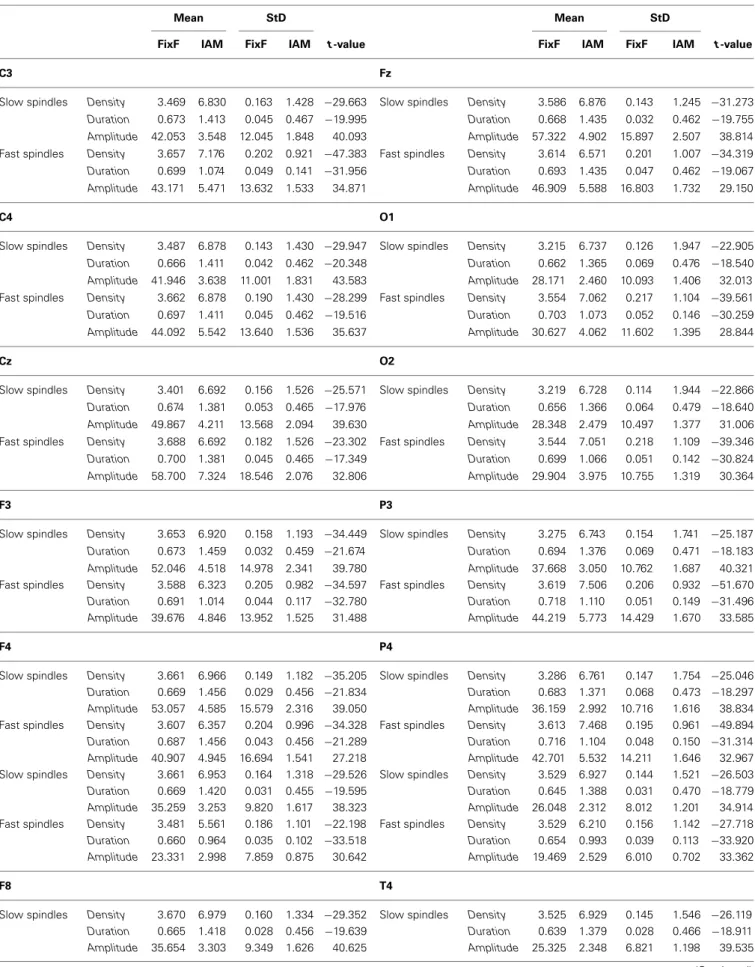
Sleep spindle parameters are shown in Table 1. It must be noted that while FixF and IAM amplitude measures are displayed and compared, they are not expected to be on the same scale due to the narrower frequency band of IAM and the fact that in the FixF method amplitude was expressed as the mean maximum peak-to-peak voltage difference within a spindle, while in IAM amplitude was defined as the mean maximum of intra-spindle envelopes of the individually band-passed EEG.
The difference between comparable FixF and IAM spin- dle parameters is significant in all cases at p<0.0001, and all comparisons remain significant after correction for multiple comparisons.
CORRELATIONS BETWEEN FixF AND IAM SPINDLE PARAMETERS Despite the differences in the results, individual spindle param- eters obtained with the FixF and IAM methods are strongly correlated in case of the amplitude and duration of fast spindles.
These correlations are always over 0.5 for amplitude and over 0.4 for duration and they are highest (>0.8 for amplitude,>0.7 for
Table 1 | Sleep spindle parameters calculated by IAM and the fixed frequency method (FixF).
Mean StD Mean StD
FixF IAM FixF IAM t-value FixF IAM FixF IAM t-value
C3 Fz
Slow spindles Density 3.469 6.830 0.163 1.428 −29.663 Slow spindles Density 3.586 6.876 0.143 1.245 −31.273 Duration 0.673 1.413 0.045 0.467 −19.995 Duration 0.668 1.435 0.032 0.462 −19.755 Amplitude 42.053 3.548 12.045 1.848 40.093 Amplitude 57.322 4.902 15.897 2.507 38.814 Fast spindles Density 3.657 7.176 0.202 0.921 −47.383 Fast spindles Density 3.614 6.571 0.201 1.007 −34.319 Duration 0.699 1.074 0.049 0.141 −31.956 Duration 0.693 1.435 0.047 0.462 −19.067 Amplitude 43.171 5.471 13.632 1.533 34.871 Amplitude 46.909 5.588 16.803 1.732 29.150
C4 O1
Slow spindles Density 3.487 6.878 0.143 1.430 −29.947 Slow spindles Density 3.215 6.737 0.126 1.947 −22.905 Duration 0.666 1.411 0.042 0.462 −20.348 Duration 0.662 1.365 0.069 0.476 −18.540 Amplitude 41.946 3.638 11.001 1.831 43.583 Amplitude 28.171 2.460 10.093 1.406 32.013 Fast spindles Density 3.662 6.878 0.190 1.430 −28.299 Fast spindles Density 3.554 7.062 0.217 1.104 −39.561 Duration 0.697 1.411 0.045 0.462 −19.516 Duration 0.703 1.073 0.052 0.146 −30.259 Amplitude 44.092 5.542 13.640 1.536 35.637 Amplitude 30.627 4.062 11.602 1.395 28.844
Cz O2
Slow spindles Density 3.401 6.692 0.156 1.526 −25.571 Slow spindles Density 3.219 6.728 0.114 1.944 −22.866 Duration 0.674 1.381 0.053 0.465 −17.976 Duration 0.656 1.366 0.064 0.479 −18.640 Amplitude 49.867 4.211 13.568 2.094 39.630 Amplitude 28.348 2.479 10.497 1.377 31.006 Fast spindles Density 3.688 6.692 0.182 1.526 −23.302 Fast spindles Density 3.544 7.051 0.218 1.109 −39.346 Duration 0.700 1.381 0.045 0.465 −17.349 Duration 0.699 1.066 0.051 0.142 −30.824 Amplitude 58.700 7.324 18.546 2.076 32.806 Amplitude 29.904 3.975 10.755 1.319 30.364
F3 P3
Slow spindles Density 3.653 6.920 0.158 1.193 −34.449 Slow spindles Density 3.275 6.743 0.154 1.741 −25.187 Duration 0.673 1.459 0.032 0.459 −21.674 Duration 0.694 1.376 0.069 0.471 −18.183 Amplitude 52.046 4.518 14.978 2.341 39.780 Amplitude 37.668 3.050 10.762 1.687 40.321 Fast spindles Density 3.588 6.323 0.205 0.982 −34.597 Fast spindles Density 3.619 7.506 0.206 0.932 −51.670 Duration 0.691 1.014 0.044 0.117 −32.780 Duration 0.718 1.110 0.051 0.149 −31.496 Amplitude 39.676 4.846 13.952 1.525 31.488 Amplitude 44.219 5.773 14.429 1.670 33.585
F4 P4
Slow spindles Density 3.661 6.966 0.149 1.182 −35.205 Slow spindles Density 3.286 6.761 0.147 1.754 −25.046 Duration 0.669 1.456 0.029 0.456 −21.834 Duration 0.683 1.371 0.068 0.473 −18.297 Amplitude 53.057 4.585 15.579 2.316 39.050 Amplitude 36.159 2.992 10.716 1.616 38.834 Fast spindles Density 3.607 6.357 0.204 0.996 −34.328 Fast spindles Density 3.613 7.468 0.195 0.961 −49.894 Duration 0.687 1.456 0.043 0.456 −21.289 Duration 0.716 1.104 0.048 0.150 −31.314 Amplitude 40.907 4.945 16.694 1.541 27.218 Amplitude 42.701 5.532 14.211 1.646 32.967 Slow spindles Density 3.661 6.953 0.164 1.318 −29.526 Slow spindles Density 3.529 6.927 0.144 1.521 −26.503 Duration 0.669 1.420 0.031 0.455 −19.595 Duration 0.645 1.388 0.031 0.470 −18.779 Amplitude 35.259 3.253 9.820 1.617 38.323 Amplitude 26.048 2.312 8.012 1.201 34.914 Fast spindles Density 3.481 5.561 0.186 1.101 −22.198 Fast spindles Density 3.529 6.210 0.156 1.142 −27.718 Duration 0.660 0.964 0.035 0.102 −33.518 Duration 0.654 0.993 0.039 0.113 −33.920 Amplitude 23.331 2.998 7.859 0.875 30.642 Amplitude 19.469 2.529 6.010 0.702 33.362
F8 T4
Slow spindles Density 3.670 6.979 0.160 1.334 −29.352 Slow spindles Density 3.525 6.929 0.145 1.546 −26.119 Duration 0.665 1.418 0.028 0.456 −19.639 Duration 0.639 1.379 0.028 0.466 −18.911 Amplitude 35.654 3.303 9.349 1.626 40.625 Amplitude 25.325 2.348 6.821 1.198 39.535 (Continued)
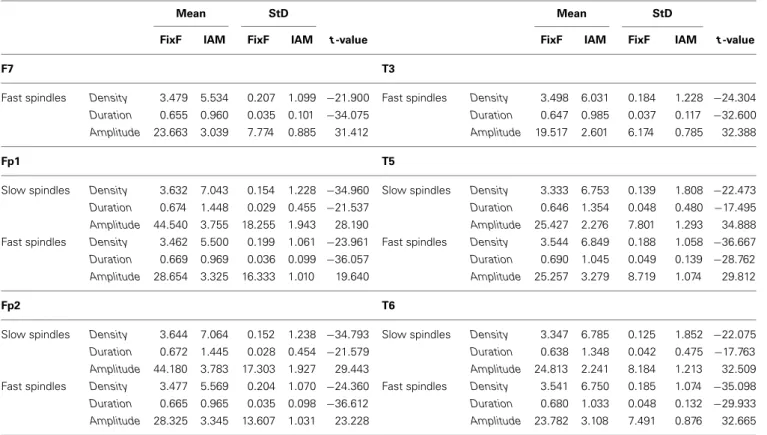
Table 1 | Continued
Mean StD Mean StD
FixF IAM FixF IAM t-value FixF IAM FixF IAM t-value
F7 T3
Fast spindles Density 3.479 5.534 0.207 1.099 −21.900 Fast spindles Density 3.498 6.031 0.184 1.228 −24.304 Duration 0.655 0.960 0.035 0.101 −34.075 Duration 0.647 0.985 0.037 0.117 −32.600 Amplitude 23.663 3.039 7.774 0.885 31.412 Amplitude 19.517 2.601 6.174 0.785 32.388
Fp1 T5
Slow spindles Density 3.632 7.043 0.154 1.228 −34.960 Slow spindles Density 3.333 6.753 0.139 1.808 −22.473 Duration 0.674 1.448 0.029 0.455 −21.537 Duration 0.646 1.354 0.048 0.480 −17.495 Amplitude 44.540 3.755 18.255 1.943 28.190 Amplitude 25.427 2.276 7.801 1.293 34.888 Fast spindles Density 3.462 5.500 0.199 1.061 −23.961 Fast spindles Density 3.544 6.849 0.188 1.058 −36.667 Duration 0.669 0.969 0.036 0.099 −36.057 Duration 0.690 1.045 0.049 0.139 −28.762 Amplitude 28.654 3.325 16.333 1.010 19.640 Amplitude 25.257 3.279 8.719 1.074 29.812
Fp2 T6
Slow spindles Density 3.644 7.064 0.152 1.238 −34.793 Slow spindles Density 3.347 6.785 0.125 1.852 −22.075 Duration 0.672 1.445 0.028 0.454 −21.579 Duration 0.638 1.348 0.042 0.475 −17.763 Amplitude 44.180 3.783 17.303 1.927 29.443 Amplitude 24.813 2.241 8.184 1.213 32.509 Fast spindles Density 3.477 5.569 0.204 1.070 −24.360 Fast spindles Density 3.541 6.750 0.185 1.074 −35.098 Duration 0.665 0.965 0.035 0.098 −36.612 Duration 0.680 1.033 0.048 0.132 −29.933 Amplitude 28.325 3.345 13.607 1.031 23.228 Amplitude 23.782 3.108 7.491 0.876 32.665 Density, duration and amplitude means, standard deviations (StD) and comparison t-values are shown.
duration) in derivations where fast spindles are most prominent (central and parietal electrodes) as well as in occipital derivations.
There is, surprisingly, a negative correlation between fast spindle density calculated by the IAM and the FixF method.
There is only a week concordance between FixF and IAM slow spindle parameters. There is no significant FixF-IAM correlation in case of slow spindle density and duration, and only a mod- est correlation in case of slow spindle amplitude (r<0.5 except for F3).
Table 2 presents the Pearson correlation coefficients depict- ing the linear relationship between corresponding IAM and FixF spindle parameters on all electrodes.
Given that 1) our sample consisted of several datasets recorded on various EEG devices and 2) the FixF ranges we analyzed—while based on previous literature—did not corre- spond well to the frequency ranges computed by IAM, we re- analyzed our sample divided in subsamples as well as with differ- ent FixF ranges set with slow spindles between 10 Hz and 12.5 Hz and fast spindles between 12.5 Hz and 15 Hz. In both re-analyses, we attempted to replicate our most prominent results, and inves- tigated fast spindle parameters on P4 and slow spindle parameters on F3. F3 was selected over Fz because of the higher availability of this electrode in the sample.
Results are similar across subsamples: that is, fast spin- dle density is negatively correlated; slow spindle density and duration are not correlated, slow spindle amplitude is mod- erately and positively correlated while fast spindle duration
and amplitude are strongly and positively correlated. FixF-IAM correlations for slow spindles on F3 are as follows for density (rBudapest1=0.427, p=0.016; rBudapest2= −0.032, p=0.908;
rMunich=0.129, p=0.086), duration (rBudapest1=0.086, p=0.647; rBudapest2= −0.143, p=0.597; rMunich= −0.072, p=0.448) and amplitude (rBudapest1=0.353, p=0.052;
rBudapest2=0.498,p=0.049;rMunich=0.519,p<0.001). FixF- IAM correlations for fast spindles on P4 are as follows for density (rBudapest1= −0.28, p=0.127; rBudapest2= −0.282, p=0.291;
rMunich= −0.359, p<0.001), duration (rBudapest1=0.844, p<0.001; rBudapest2=0.661, p=0.005; rMunich=0.805, p<0.001) and amplitude (rBudapest1=0.75, p<0.001;
rBudapest2=0.798,p<0.001;rMunich=0.861,p<0.001).
Application of the new frequency bands also did not change the pattern of consistency of our methods significantly. With the 10–12.5 Hz FixF windows, FixF-IAM correlations for slow spindles on F3 are the following: rdensity=0.083, p=0.292;
rduration= −0.069,p=0.39;ramplitude=0.419,p<0.001. With the 12.5–15 Hz FixF windows, FixF-IAM correlations for fast spindles on P4 are the following: rdensity= −0.149, p=0.06;
rduration=0.802,p<0.001;ramplitude=0.66,p<0.001.
DISCUSSION
While previous studies compared sleep spindle detections between various manual and automatic methods (Huupponen et al., 2007; Warby et al., 2014), to our knowledge no previous study compared individual averages of sleep spindle parameters